Page History
| Table of Contents | ||||||
|---|---|---|---|---|---|---|
|
...
General
How to create a project?
To create a project, you first need to transfer files to the Partek Flow server, and then import the files into your project using the import data wizard, here is the video and more information.
...
Yes, navigate to My profile and click the "Change image" button. Do this by clicking your avatar at the top right corner of the interface, select Settings, then choose My profile Profile.
How do I add and use my own lists?
Click your avatar in the top right corner of the Partek Flow interface, choose "hoose Settings" in in the menu, and select "select Lists" from the left panel of the Components section. For the Components section. Lists can also be generated from result tables using the "Save as managed list" button. For more information please click here.We do provide hosted lists (from publications) for different cell types or conditions which can also be used in your analysis and lists can also be generated from result tables.
Can I repeat a task and everything downstream of it, while changing only one/a few parameters?
Yes, click on the rectangular task that you want to change the parameters. On the context-specific menu on the right, under Task actions, select ‘Rerun with downstream tasks’, this will bring you to the task set up page where you can edit the parameters for the task, then click Finish to run the task with the new parameters. The tasks downstream of it will be initiated automatically.
What can I use to identify cells that are actively expressing genes within a gene list?
Use AUCell to identify cells with active gene sets; this task calculates a value for each cell by ranking all genes by their expression level in the cell and identifying what proportion of the genes from the gene list fall within the top 5% (default cutoff) of genes. An alternative option is to use the "gene Gene score" for for a feature list to select and filter populations based on the distribution; Click click here for more information.
Can I build and use pipelines for my analysis?
Yes, click on the link "on Import a pipeline" on on the bottom of the “Analyses” Analyses tab dashboard. This will help you import either our hosted pipelines or your own saved pipeline which can be found under Settings -> Components -> Pipelines. Click here for steps to save and run a pipeline. For more information related to navigating pipelines click here.
...
We recommend cleaning up projects as well as removing library files that you do not need, then removing the orphaned files. You can also export analyzed projects and save them on an external machine, then when you need them again you can import them to the server. Please see this information for more details related to: Project management, Removing library files, and Orphaned files. Right click on the data node to delete files from projects that are not needed (e.g. fastqs from project pipelines that are analyzed); you will not be able to perform tasks from this node once the files are deleted.
How do I add
...
library files if I am not studying human or mouse?
Find the reference genome and annotation files for the species of interest using Ensembl. When adding an assembly, we will need both the reference genome and the transcriptome information library files. For more details on adding a reference genome please click here. The annotation file will give us information on gene (transcript) location and we recommend using the .gtf file format; for more information click here. To add a new assembly, click on Settings -> Library files. From the Assembly drop-down list, select Add assembly and specify the species. If the species name is not in the list, choose Other and type in the name with the assembly version (multiple assembly versions can exist for one species, e.g. hg19 and hg38 for Homo Sapiens). You need to add the reference file which is a .fasta file containing sequence information. Once the reference file is added, you can build any aligner index to perform the alignment task.
The Annotation model is a file containing feature location. This file can be used to quantify to annotation model in RNA-Seq analysis, or annotate variant or peaks in a DNA-Seq or ATAC-Seq/ChIP-Seq data analysis pipeline. The file format should be .gtf/.gff/.bed.
We recommend looking for the species files on the Ensembl website. There is no need to unzip or save these files to your local machine, instead right click and copy the link address . We also have a short video hereof the specific file (not a link to a folder). For more details, here is the documentation chapter: Library File Management - Partek® Documentation.
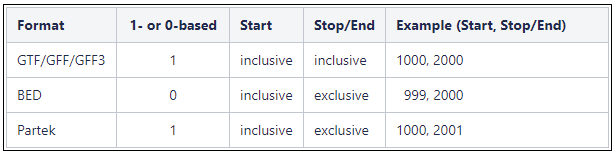
Are Genome coordinates 1-based or 0-based?
Genome coordinates for annotation models stored in Partek Flow are 1-based, start-inclusive, and stop-exclusive. This means that the first base position starts from one, the start coordinate for a feature is included in the feature and the stop/end coordinate is not included in the feature. These are the genome coordinates that are printed in various task reports and output files when an annotation model is involved in the task. When custom annotation files are added to Partek Flow, the genome coordinates are converted into this format. The coordinates are converted back if necessary for a specific task. shows how the genome coordinates vary between different annotation formats.
Can I add transgenes to my reference files?
Yes, to add transgenes (including gfp or related) to the references files, first choose an assembly, create the transgene reference, and merge the references together (e.g. combine mm10 with dttomato). This is the same process for the annotation file.
...
Left click to select the data node you want to export. In the bottom of the task menu there will be an option to "Download data".
Can I visualize fold change values on a heatmap without using a z-score?
Yes, the default settings can be modified by clicking "Configure" in the Advanced settings during task set-up, then change the "feature scaling" option to "none" to plot the values without scaling. For more information related to to the heatmap click here.
Visualization
How do I order my heatmap by the cell types?
If you would like specific groups (e.g. cell types) in a certain order, do not perform hierarchical Hierarchical clustering on these cells and instead choose to assign order, then use click and drag to reorder the groups. If you want to remove a group, you can choose to exclude this group in the filtering section. You can still perform hierarchical Hierarchical clustering on the features if you would like to. Hierarchical clustering will force the heatmap to cluster and you would need to click the dendrogram nodes to switch the order. Click here for more information.
How do I display UMAP for each sample in the Data Viewer?
For a multi-sample project, all of the downstream tasks will be run separately if the PCA ran with 'Split by sample' was checked when performing the PCA task. Visualization of different samples could can be displayed by 'Sample' option under using the 'Misc' section in 'axis' the Axes card. If one would like to To show different samples side by side, one can click 'Duplicate plot' first, then use the 'Sample' option to switch one of the samples.
Statistics FAQs
...
Can I visualize fold change values on a heatmap without using a z-score?
Yes, the default settings can be modified by clicking "Configure" in the Advanced settings during task set-up, then change the "feature scaling" option to "none" to plot the values without scaling. For more information related to to the heatmap click here.
Why don't I see Flip mode on the heatmap? Why can't I download all of the data after zooming?
The Flip mode and download all data options are disabled if there are more than 2.5 million values (rows x columns) in the heatmap.
How to label gene names on volcano plot?
By default, genes are selected if the p-value is <=0.05 and |fold change| >=2 and when the number of selected genes is less than 2000 genes, they will be labeled. You can click on Style button in Configure section, choose a gene annotation field from the Label by drop-down list to change the label. If you number of selected genes is select less than or equal to 100, Partek Flow will try to spread out labels as much as possible to clearly display the labels. If number of selected genes is more than 100, labels will be next to the selected genes, there will be overlaps where genes are close together. If there are more than 2000 genes selected, no label will be displayed.
If you click any blank space, you can turn off select and use different selection mode button on the vertical bar on the upper-right corner of the plot to manually select dots on the plot.
Statistics
Why do I get "?" for FDR p-values in my Deseq2 result?
...
Click here for troubleshooting other differential analysis models and "?" results
What is fold change?
Fold change indicates the extent of increase or decrease in feature expression in a comparison. In Partek Flow, fold change is in linear scale (even if the input data is in log scale). It is converted from ratio, which is the LSmean of group one divided by LSmean of group two in your comparison. When the ratio is greater than 1, fold change is identical to ratio; when the ratio is less than 1, fold change is -1/ratio. There is no fold change value between -1 to 1. When ratio/fold change is 1, that means there is no change between the two groups.
Log ratio option in Partek Flow is converted from ratio, this is a value comparable to log fold change in some other tools.
Can I label a Volcano plot with gene names?
Yes, go to Style in the Data Viewer and make sure Gene name is selected under "Labeling". Next, go to the in plot selection tools (right side of the graphic) and use any of the selection tools to select the cells that you would like to label. You can use ctrl or shift to select multiple populations at once. For more information on the Volcano plot click here.
In Volcano plot, what is inconclusive group mean?
By default, Flow is using the p value <= 0.05 and |fold change|>=2 as the significance cutoff. If genes meet both p value and fold change cutoff, they are significantly up or down regulated genes. If they only meet one criteria, they are called inconclusive. If genes won't pass either criteria, they are not significant. Click on the Statistics button in the Configure section in the left control panel, you can change the cutoff. Click on the Style button to change the color of significance categories.
What is the difference between FDR and FDR step up?
...
Can I compare one attribute at a time versus all of the others combined?
Yes, you can use the Compute biomarkers task which will perform Student's t-Tests on the selected attribute, by comparing task to compare one subgroup at a time to all of the others combined; by default, the up-regulated features (e.g. genes) are reported as biomarkers. . An alternative option is to set up the differential analysis model comparison is in this way; for more information please see the information here for each model.
...
I downloaded gene counts from the output data node generated by the Quantify to annotation model task, why can't I find my genes of interest?
In the Quantifying to an annotation model dialog, by default, Partek Flow filters features based on the total count across all of the samples and features with a total count greater than 10 will be reported. If you want to report all of the genes in the annotation file, change the Filter features value to 0.
Biological Interpretation
What is the difference between GSEA and Gene Set Enrichment?
In Partek Flow, GSEA should be performed on a sample/cell and feature matrix data node (e.g. normalization count data). GSEA is used to detect a gene set/a pathway which is significantly different between two groups. Gene set enrichment should be performed on a filtered gene list; it is used to identify overrepresented gene set/pathway based the filtered gene list using Fisher's exact test. The input data is a filtered list using gene names.
What is the enrichment score shown in the Gene Set Enrichment report?
The enrichment score shown in the enrichment report is the negative natural log of the enrichment p-value derived from Fisher Exact test. The higher the enrichment score, the more overrepresented our list of genes in the gene set of a GO/pathway category.
In KEGG pathway, genes can be colored by Fold change and p-value etc, how are the gene statistics calculated?
For Gene set enrichment analysis, only genes from the input data node (filtered gene list) will be colored in the KEGG pathway gene network, using the statistics in the data node.
During GSEA (or Gene set ANOVA) computation, we also perform ANOVA on each gene based on the attributed selected independent from GESA computation (at gene set level). The results of ANOVA is only used to color the genes in the KEGG gene network. If GSEA is computed using another other database, e.g. GO, we don't compute ANOVA on each gene since GO databased doesn't have gene network information.
When should I use GSEA or Gene set ANOVA?
...
Overview
Content Tools