Overview
This guide gives the basics of Partek® Flow® usage. Partek Flow can be installed in either a server, computer cluster or on the cloud. Regardless of where it's installed, it can be viewed using any web browser. We recommend using Google Chrome.
This guide covers:
Logging in to your Partek Flow account will bring up the Home page (Figure 1). This page will show recent activities you've performed, recent projects you've worked on and pertinent details about each project.
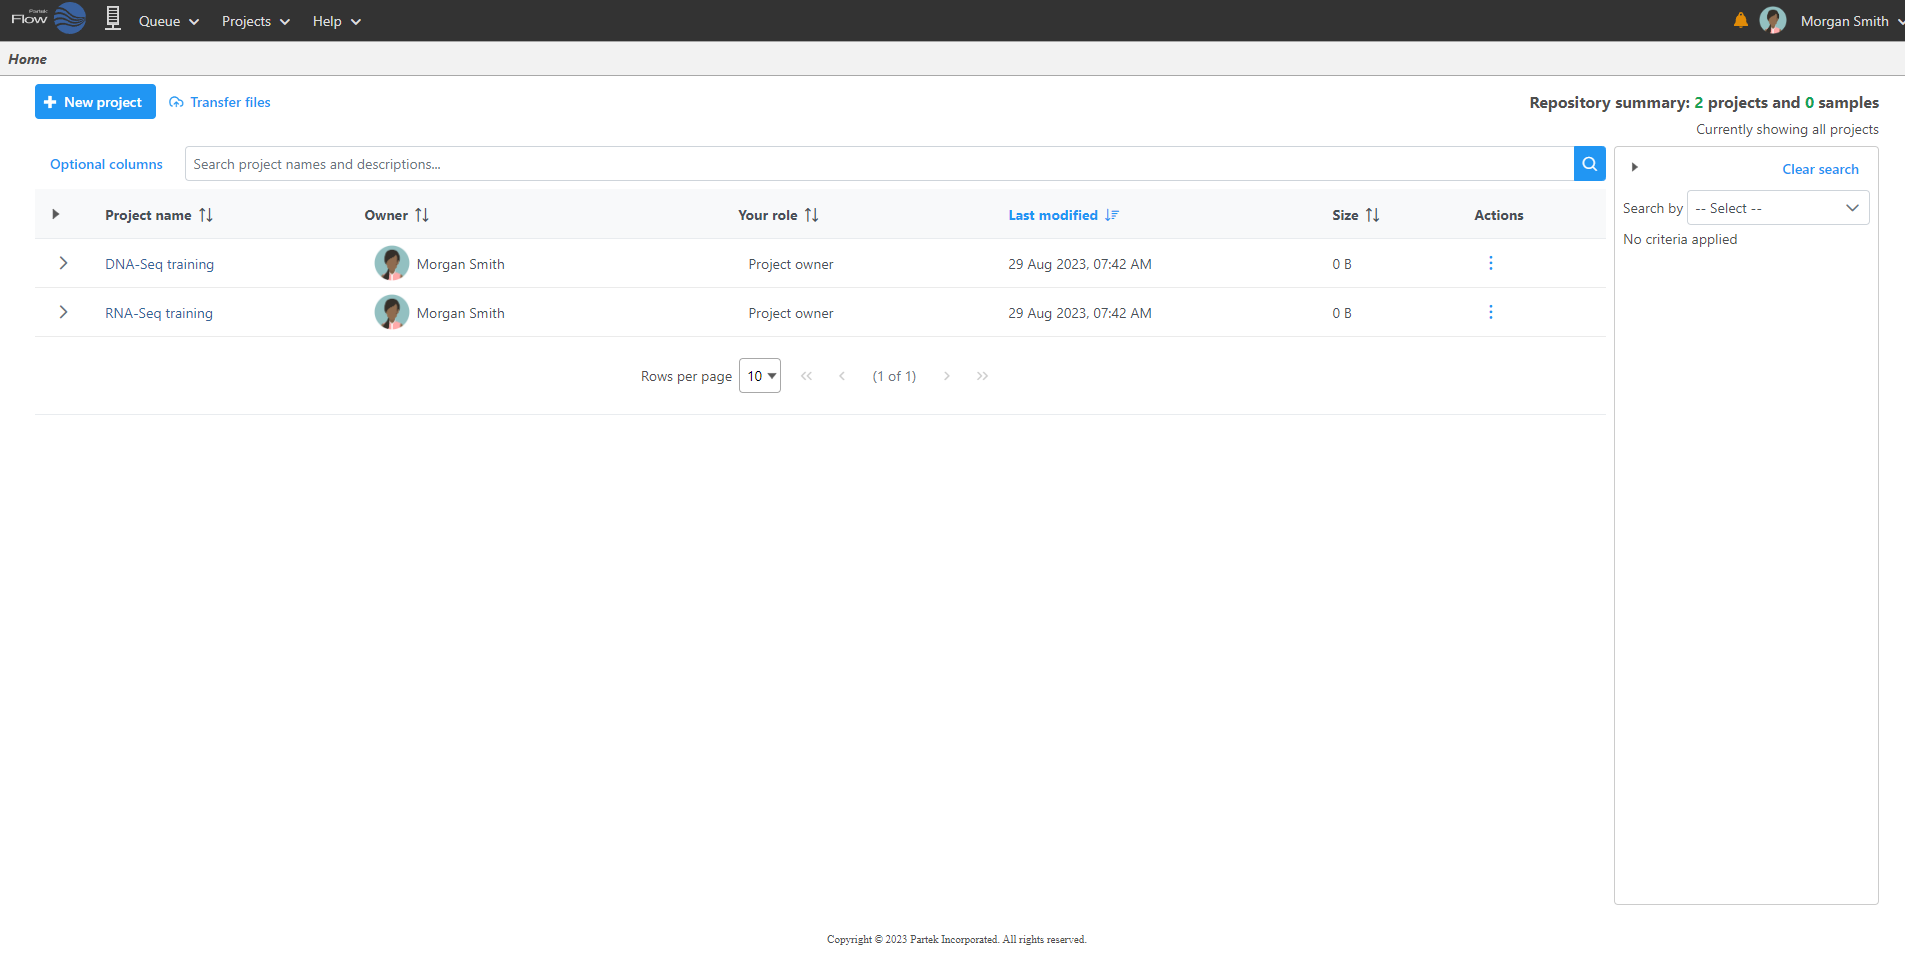
Figure 1. Partek Flow Home page
Starting a new project
From the Home Page, click the New project button  . Assign a name to the project and click the Create project button.
Uploading your dataset
Upon creation of a new project, the Analyses tab will appear, prompting you to add samples to your project. Click the blue Add data button ![]() (Figure 2).
(Figure 2).
Select the type of data (Single cell, Bulk, Other), choose the assay type, and select the data format. Partek Flow accepts various data types. Use the Next button to proceed with import.
There are three ways you can upload the data:
- From your Partek Flow server (click here for more information)
- From a URL
- From a GEO / ENA Bioproject (click here for more information)
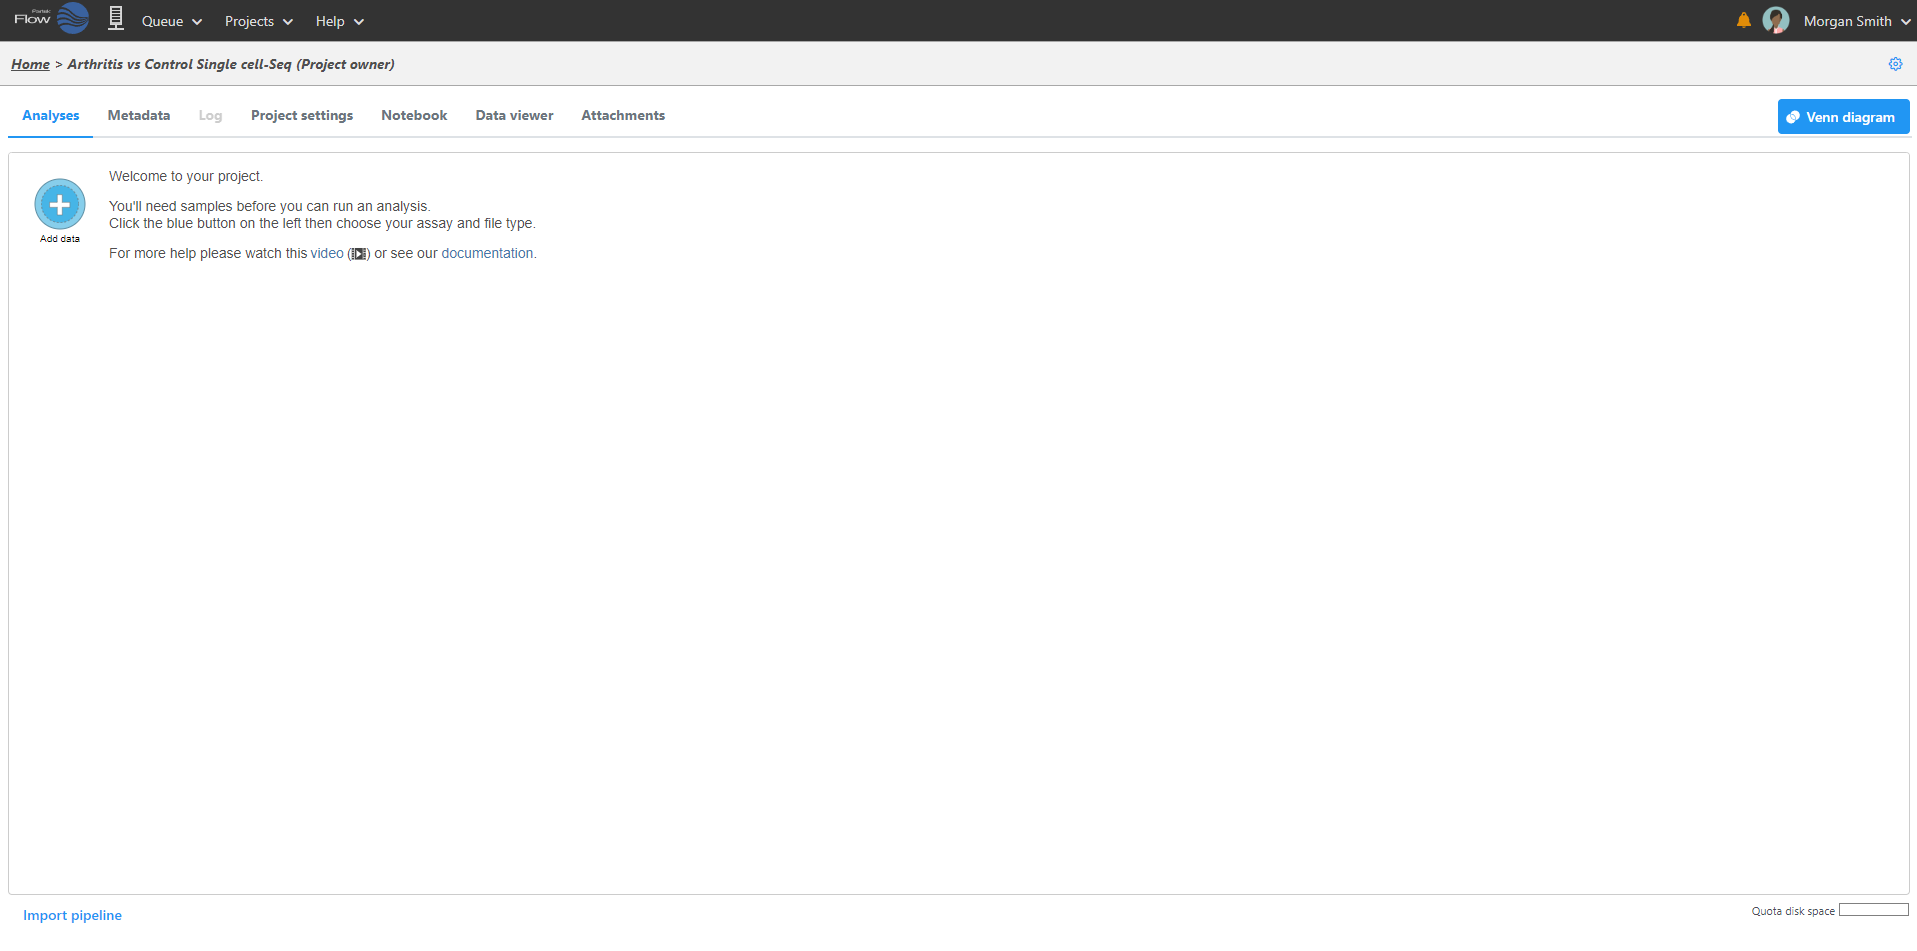
Figure 2. Add data to the project by clicking the blue circle
Because genomics datasets are generally large, it is ideal to have the data copied in a folder directly accessible to the Partek Flow server. Make sure that the directory has the appropriate permissions for Partek Flow to read and write files in that folder. You may wish to seek assistance from your system administrator in uploading your data directly.
Select the files you would like to create samples from. Once they've been created, assign the corresponding sample attributes for each sample using the Metadata tab. The most efficient way to assign sample attributes is by clicking Assign sample attributes from a file and uploading a tab delimited text file. The file should contain a table with the following:
- The first row lists the attribute names (e.g. Treatment, Exposure) and
- The first column of the table lists the sample names (the sample names in the file must be identical to the ones listed in the Sample name column in the Data tab)
- List the corresponding attributes for each sample in the succeeding columns
Basic Partek Flow layout
The Analyses Tab
After samples have been added and associated with valid data files, a data node will appear in the Analyses tab (Figure 3). The Analyses tab is where you can invoke tasks, using the context sensitive menu on the right, and view the results of your analysis.
To add more data use the Add data task in the menu on the right or Add data in the Metadata tab. Once a task is performed, data can no longer be added to the project.
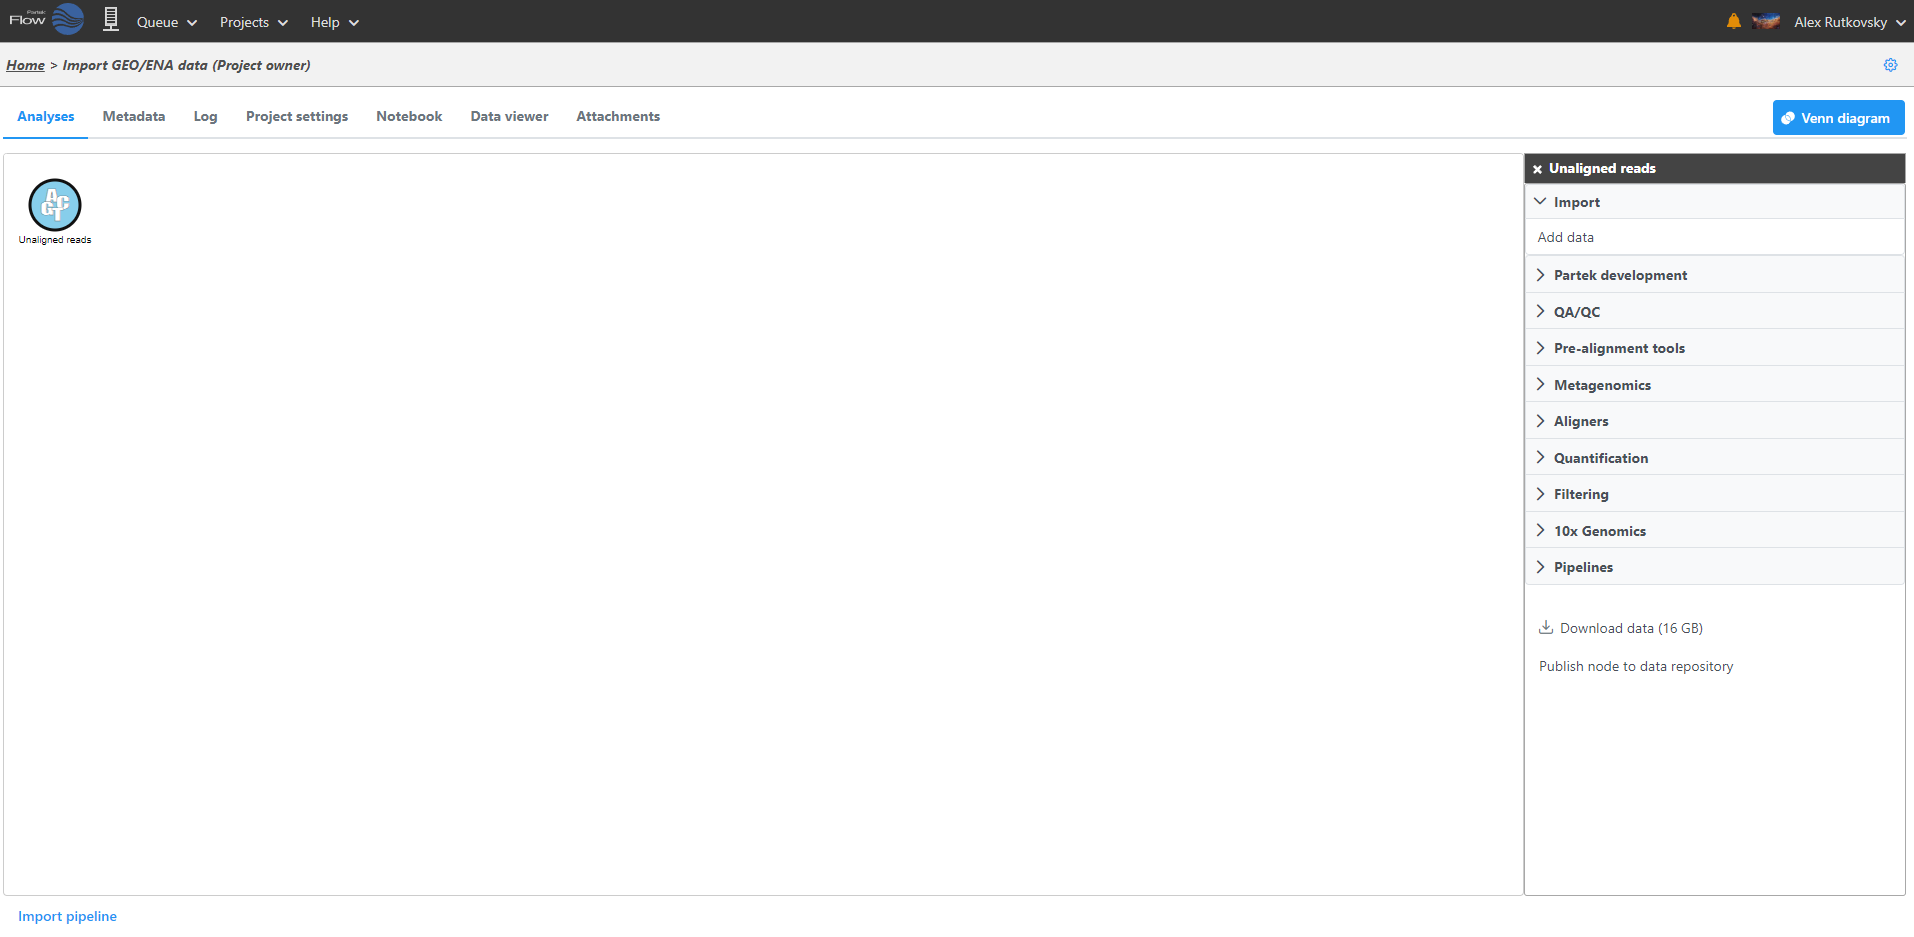
Figure 3. The Analyses tab showing a data node of unaligned reads
Data and task nodes
The Analyses tab contains two elements: data nodes (circles) and task nodes (rounded rectangles) connected by lines and arrows . Collectively, they represent a data analysis pipeline (Figure 4).
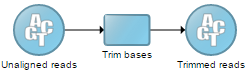
Figure 4. Example of a data analysis pipeline
Performing tasks
Clicking a data node brings up a context sensitive menu on the right (Figure 5). This menu changes depending on the type of data node. It will only present tasks which can be performed on that specific data type. Hover over the task to obtain additional information regarding each option.
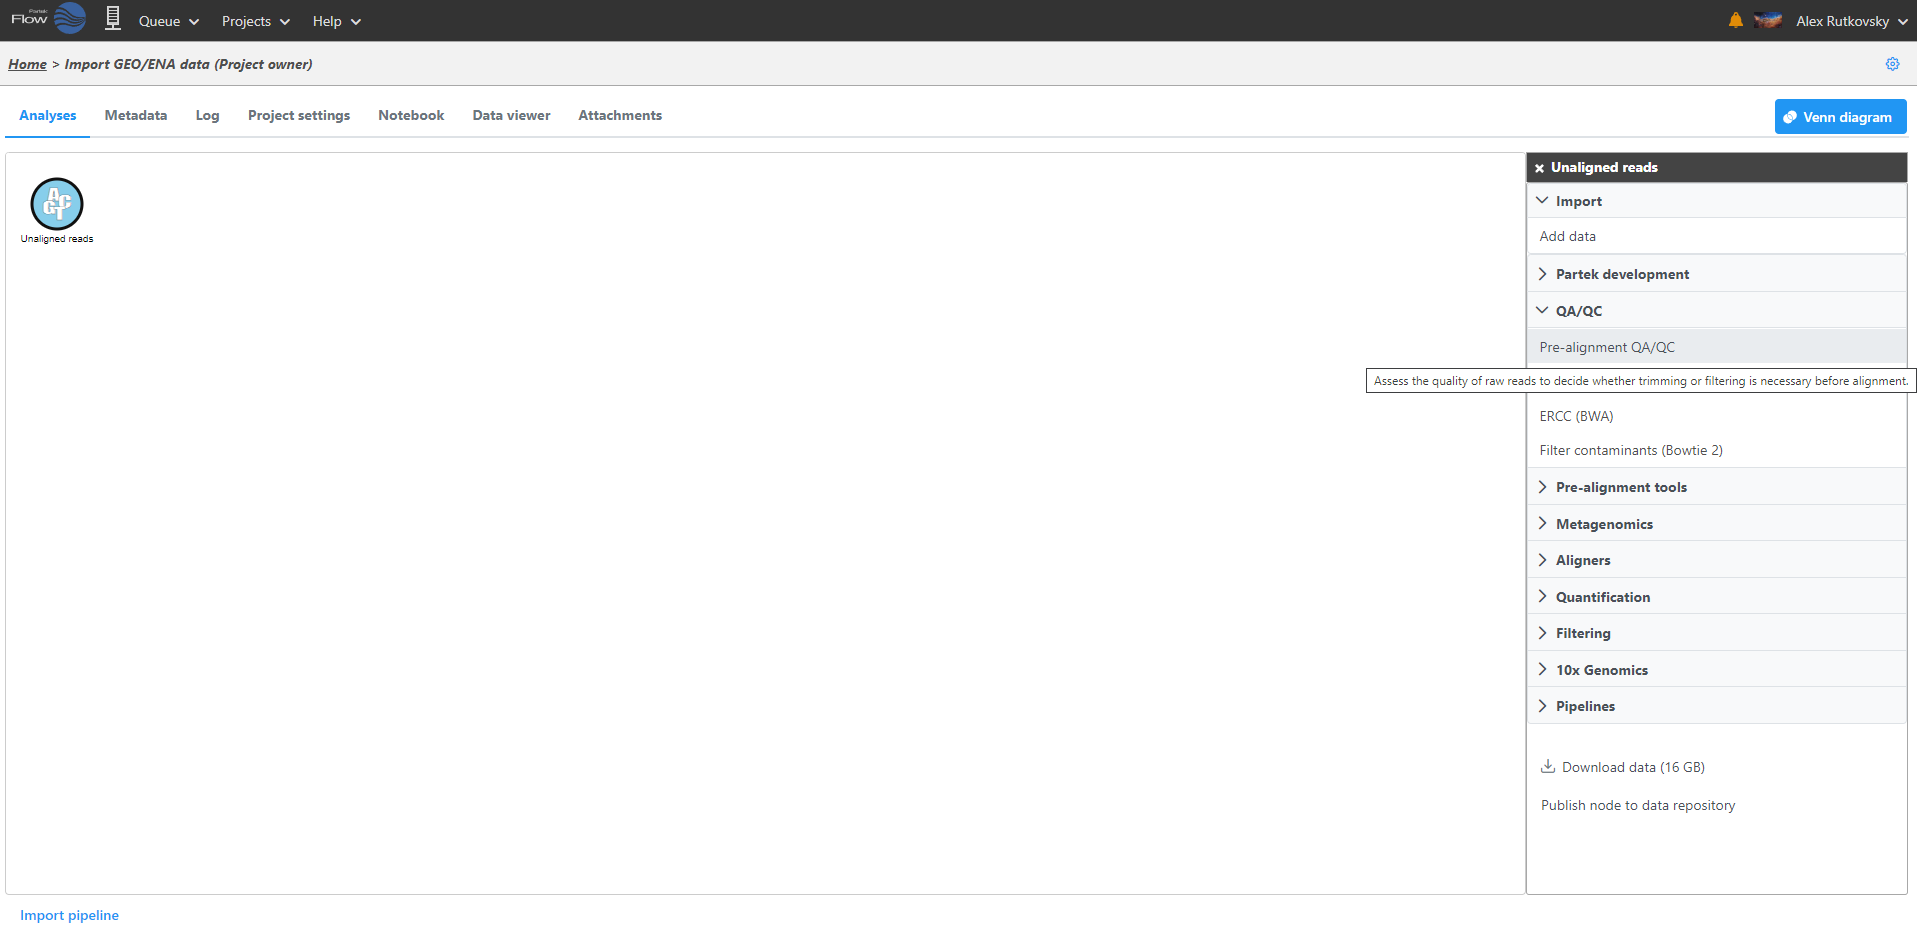
Figure 5. Context sensitive menu for unaligned reads data node
Select the task you wish to perform from the menu. When configuring task options, additional information regarding each option is available (Figure 6). When available, hover over ![]() Tooltips or click the
Tooltips or click the![]() video help for decision making. Click Finish to perform the task.
video help for decision making. Click Finish to perform the task.
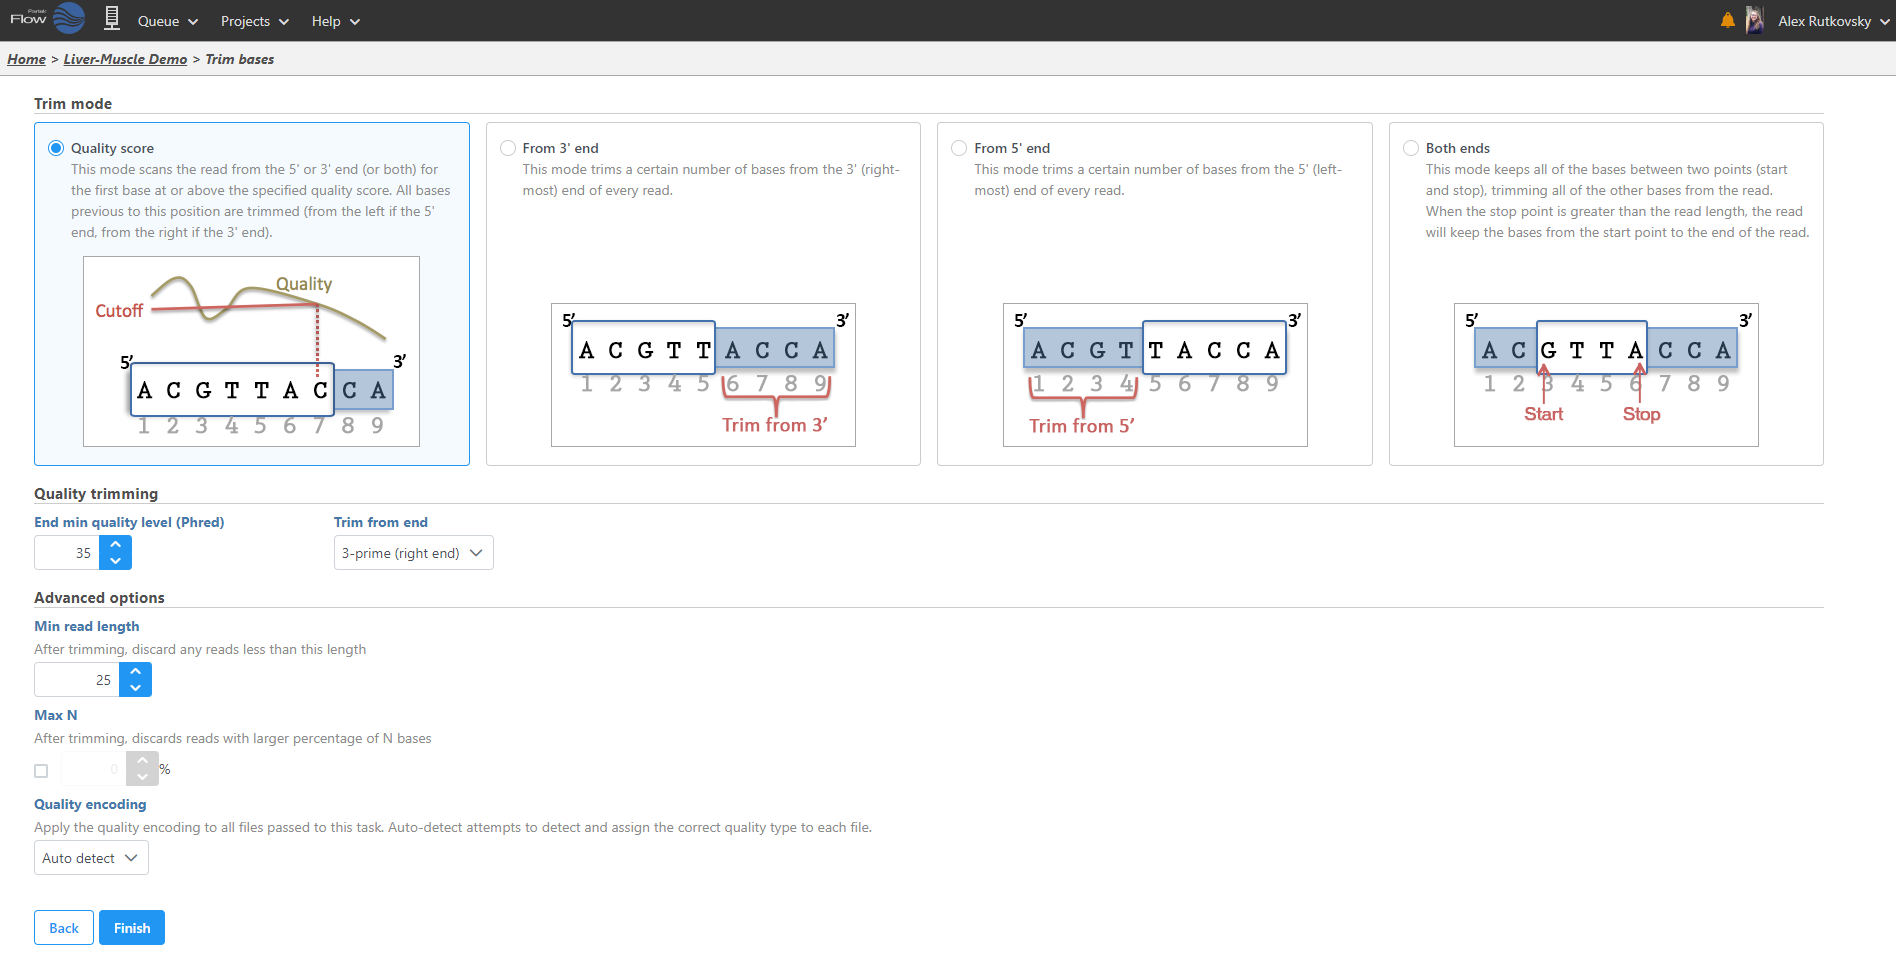
Figure 6. Additional information about a task option
Depending on the task, a new data node may automatically be created and connected to the original data node. This contains the data resulting from the task. Tasks that do not produce new data types, such as Pre-alignment QA/QC, will not produce an additional data node.
To view the results of a task, click the task node and choose the Task report option on the menu.
Saving visualizations
Click Save ![]() on any visualization to export a publication-quality image (Figure 7).
on any visualization to export a publication-quality image (Figure 7).
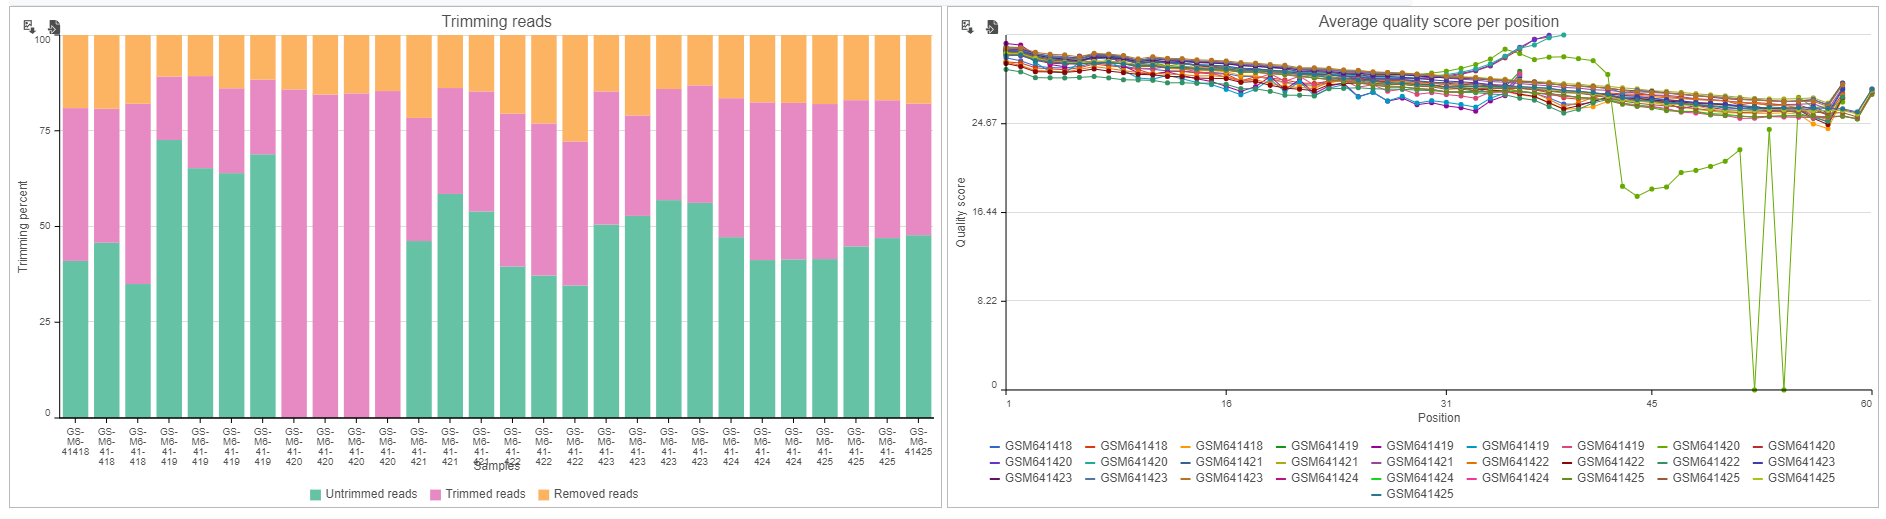
Figure 7. Save visualizations using the save icon
Downloading your data
Data associated with any data node can be downloaded by clicking the node and choosing Download data at the bottom of the task menu (Figure 8). Compressed files will be downloaded to the local computer where the user is accessing the Partek Flow server. Note that bigger files (such as unaligned reads) would take longer to download. For guidance, a file size estimate is provided for each data node. Downloaded files can be seamlessly imported in Partek® Genomics Suite®.
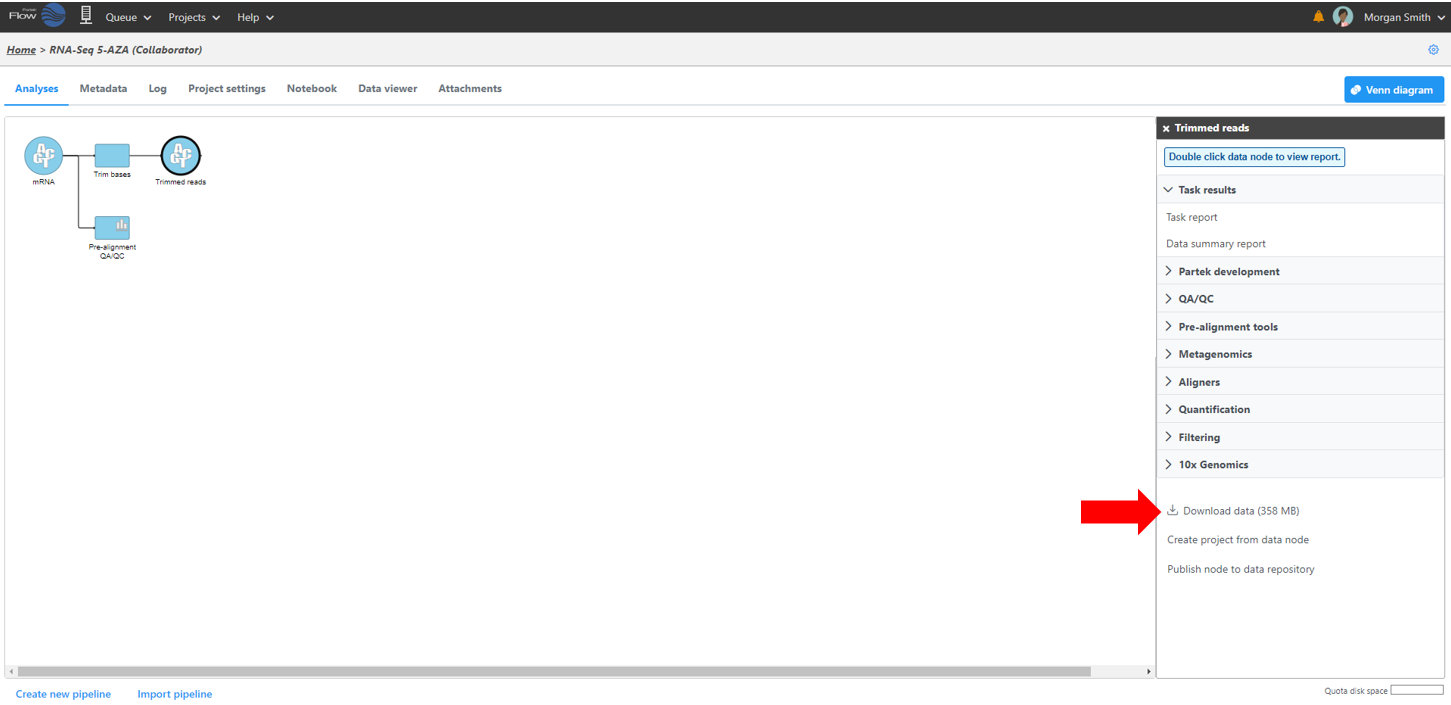
Figure 8. Downloading data
Partek Flow in action
Watch a webinar of how to set-up a simple RNA-Seq project.
Additional Assistance
If you need additional assistance, please visit our support page to submit a help ticket or find phone numbers for regional support.


| Your Rating: |
|
Results: |

|
54 | rates |
Overview
Content Tools
1 Comment
Melissa del Rosario
author: cignacio