This task can be invoked from count matrix data node or clustering task report (Statistics > Compute biomarkers). It performs Student's t-tests on the selected attribute, comparing one subgroup at a time vs all the others combined. By default, the up-regulated genes are reported as biomarkers.
Compute biomarker dialog
In the set-up dialog, select the attribute from the drop down list. The available attributes are categorical attributes which can be seen on the Data tab (i.e. project-level attributes) as well as and data node-specific annotation, e.g. graph-based clustering result (Figure 1). If the task is run on graph-based clustering output data node, the calculation is using upstream data node which contains feature counts – typically the input data node of PCA.
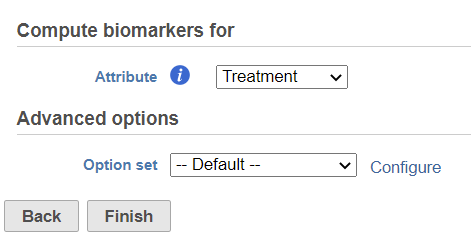
Figure 1. Compute biomarker dialog: selecting attribute
Click on the Configure under Advanced options to change the criteria for the output features (Figure 2).
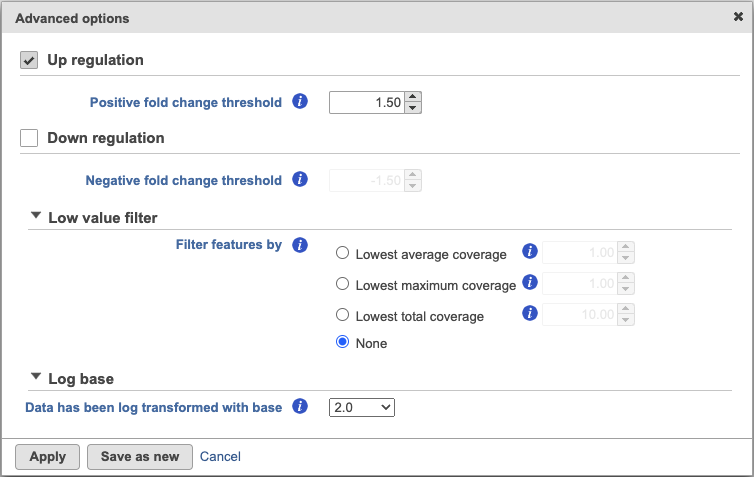
Figure 2. Configure the biomarker filter criteria based on fold change
By default, the result outputs the top 10 features that are up-regulated by at least 1.5 fold change (in linear scale) for each subgroup comparing to the others. The result is displayed in a table with each column is a subgroup name, each row is a feature. Features are ranked by the ascending p-values within each sub-category. An example is shown in Figure 3. If a subgroup has fewer biomarkers than the others, the "extra" fields for that subgroup will be left blank.
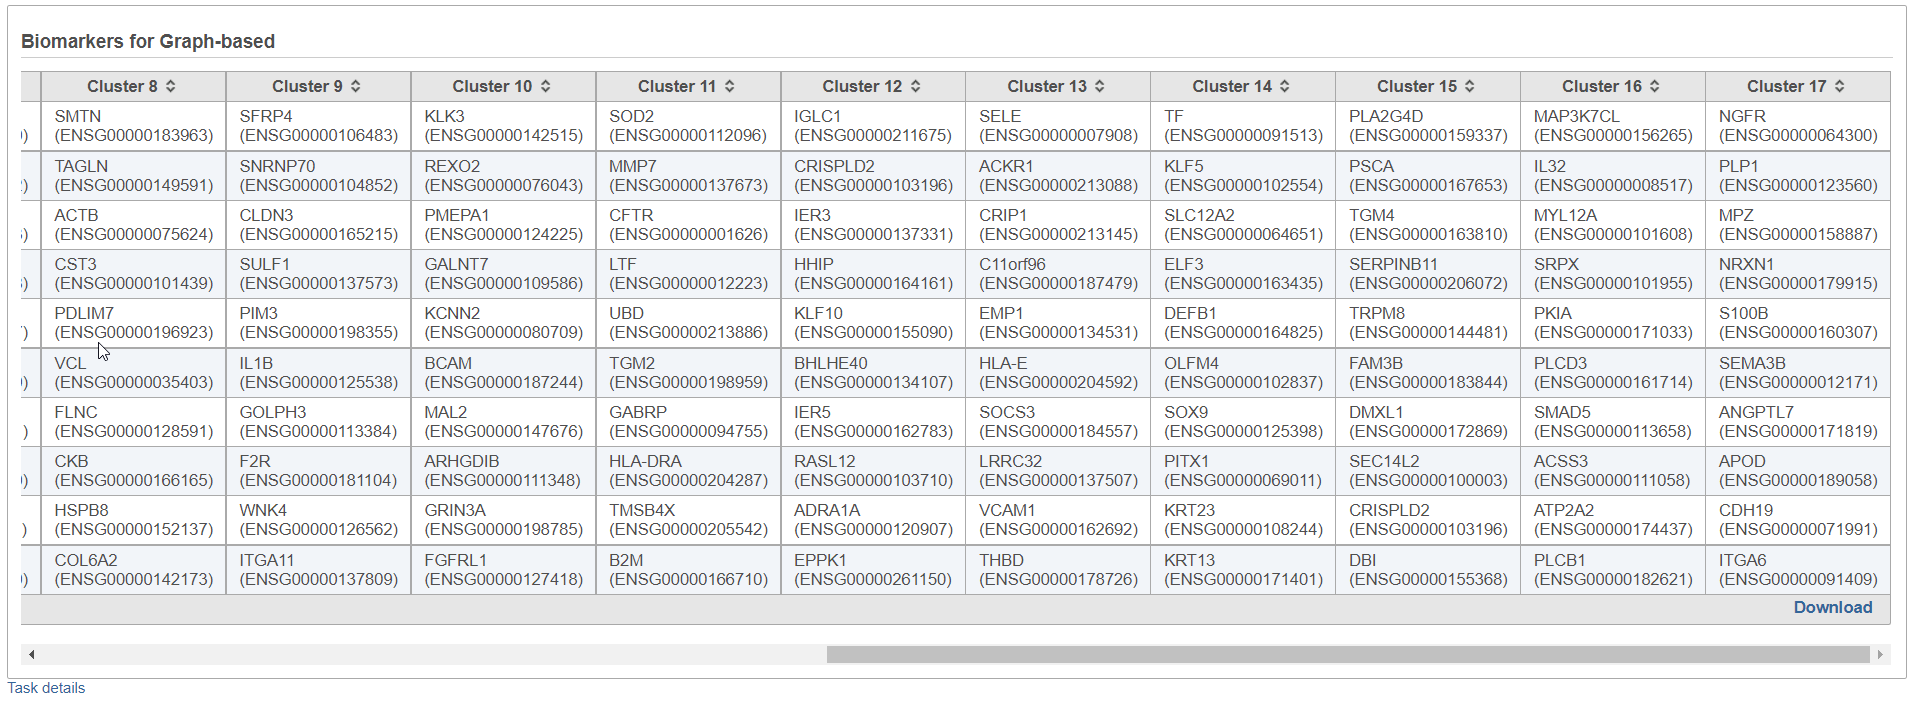 Figure 3. Biomarkers table (example). Top 10 biomarkers for each cluster are shown. Download link provides the full results table
Furthermore, the Download link (lower right corner of the table report; Figure 3) downloads a .txt file to the local computer (default file name: Biomarkers.txt), which contains the full report: all the genes with fold change > 1.5, with corresponding fold change and p-values.
Additional Assistance
If you need additional assistance, please visit our support page to submit a help ticket or find phone numbers for regional support.


| Your Rating: |
|
Results: |

|
13 | rates |
Overview
Content Tools