| Name
|
Size
|
Creator |
Creation Date
|
Last Modification Date
|
Labels |
Attached To |
|
PNG File image2019-8-30_10-13-54.png |
46 kB |
Paul Fullerton |
Aug 30, 2019 10:13 |
Aug 30, 2019 10:13 |
|
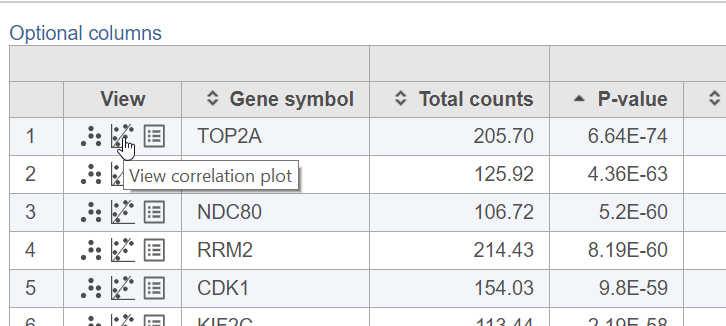
Page: Correlation Plot
|
|
PNG File image2023-12-11_18-7-5.png |
46 kB |
Alex Rutkovsky |
Dec 11, 2023 17:07 |
Dec 11, 2023 17:07 |
|
Page: Start with pre-processed Space Ranger output files
|
|
PNG File image2023-12-11_18-7-5.png |
46 kB |
Alex Rutkovsky |
Dec 11, 2023 17:19 |
Dec 11, 2023 17:19 |
|
Page: Spatial data analysis steps
|
|
PNG File kmer_content.png |
46 kB |
admin |
Jun 09, 2016 12:04 |
Jul 18, 2016 16:39 |
|
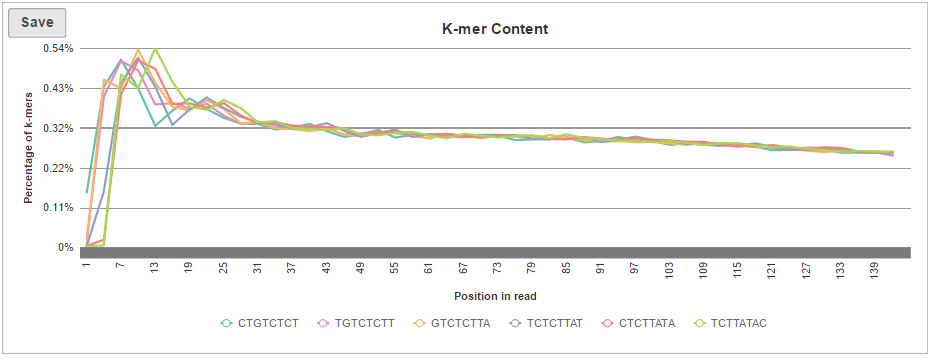
Page: Pre-alignment QA/QC
|
|
PNG File Select_CD19_positive_cells.png |
46 kB |
Simit Patel |
Jul 01, 2020 09:36 |
Jul 01, 2020 09:36 |
|
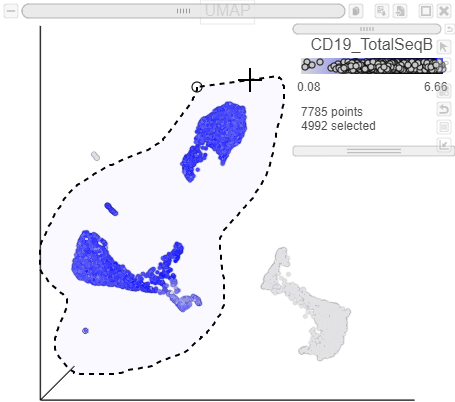
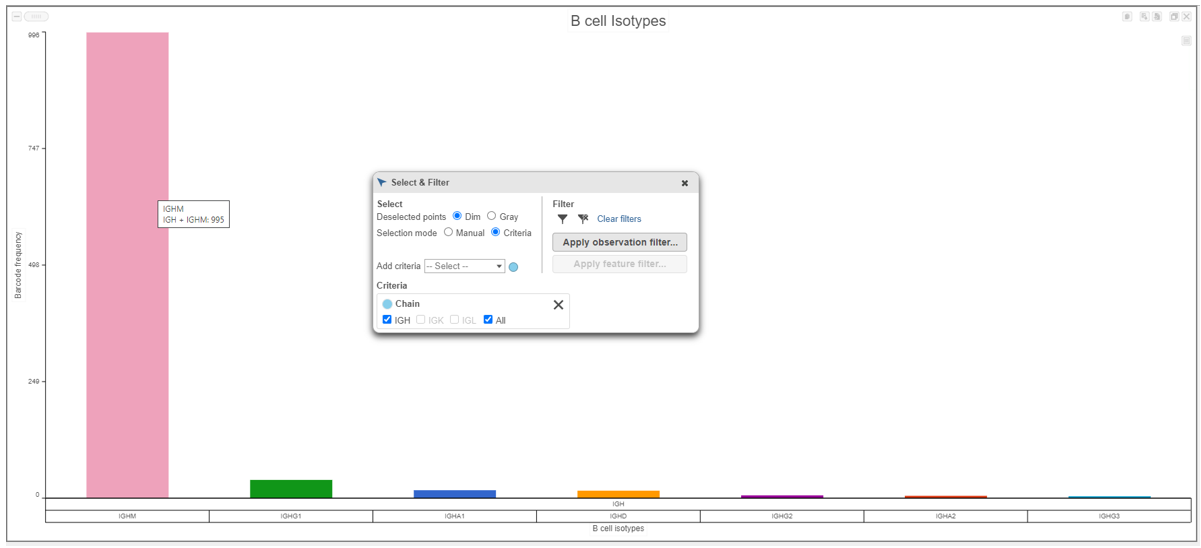
Page: Classifying Cells
|
|
PNG File table3.png |
46 kB |
admin |
Jun 09, 2016 10:22 |
Jul 19, 2016 18:30 |
|
Page: RNA-Seq Quantification
|
|
PNG File alt-splicing-chrview.png |
46 kB |
Xiaowen Wang |
Mar 29, 2017 14:13 |
Mar 29, 2017 14:13 |
|
Page: Detect alt-splicing (ANOVA)
|
|
PNG File image2018-1-24 10:57:47.png |
46 kB |
Paul Fullerton |
Jan 24, 2018 10:57 |
Jan 24, 2018 11:44 |
|
Page: Getting started with the tutorial data set
|
|
PNG File image2018-1-24 10:57:47.png |
46 kB |
Alex Rutkovsky |
Jul 07, 2023 11:29 |
Jul 07, 2023 11:29 |
|
Page: Start with pre-processed Space Ranger output files
|
|
PNG File image2018-1-24 10:57:47.png |
46 kB |
Alex Rutkovsky |
Jul 12, 2023 07:38 |
Jul 12, 2023 07:38 |
|
Page: Import 10x Genomics Xenium Analyzer output
|
|
PNG File image2019-5-24 11:43:18.png |
46 kB |
Paul Fullerton |
May 24, 2019 11:43 |
May 24, 2019 11:43 |
|
Page: Analyzing CITE-Seq Data
|
|
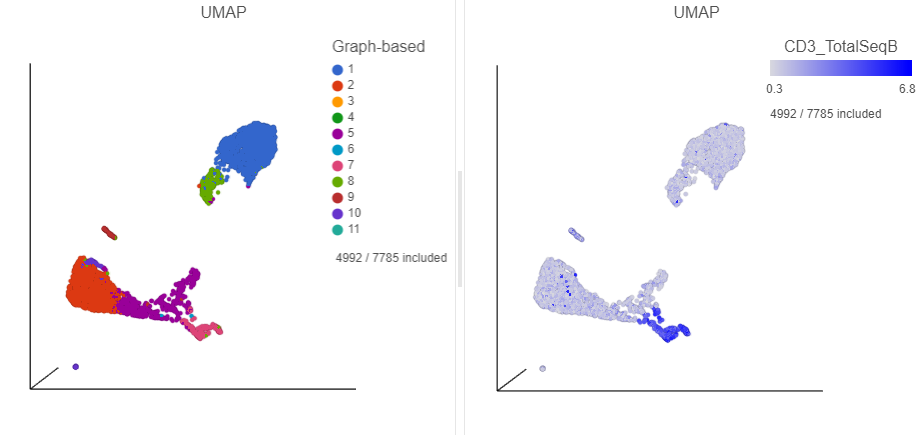
PNG File Color_B_cells_by_CD3.png |
46 kB |
Simit Patel |
Jul 01, 2020 10:08 |
Jul 01, 2020 10:08 |
|
Page: Classifying Cells
|
|
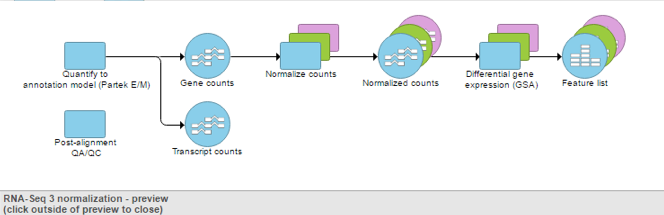
PNG File image2018-4-4 10:45:2.png |
46 kB |
Paul Fullerton |
Apr 04, 2018 10:45 |
Apr 04, 2018 10:45 |
|
Page: Normalizing counts
|
|
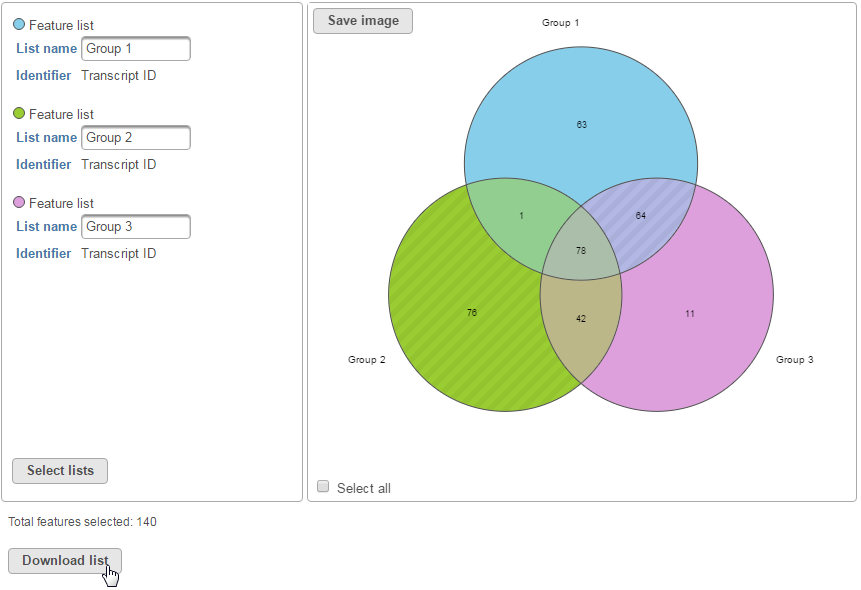
PNG File list_generator_venn_diagram_download.png |
46 kB |
Cherry Ignacio |
Jun 27, 2016 17:34 |
Jul 18, 2016 17:26 |
|
Page: List Generator (Venn Diagram)
|
|
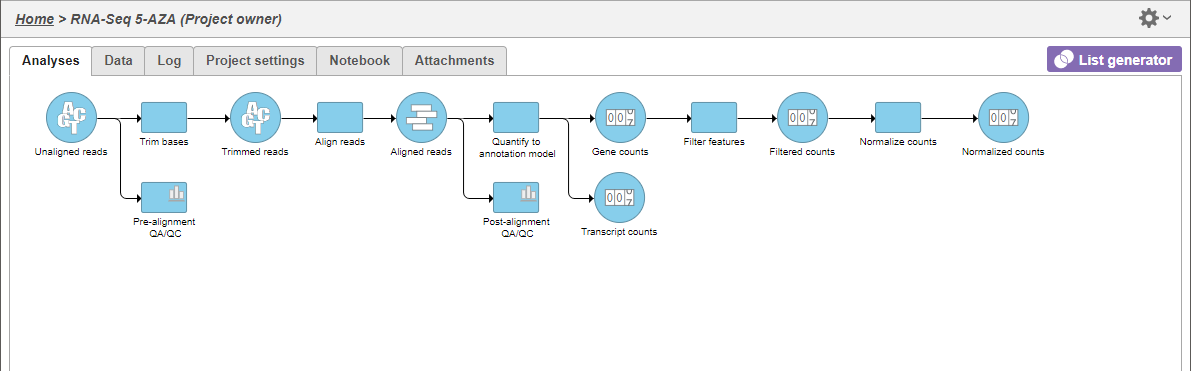
PNG File pipeline_preview_example_image.png |
46 kB |
admin |
Jun 10, 2016 10:21 |
Jul 18, 2016 18:46 |
|
Page: Previewing a Pipeline
|
|
PNG File image2024-1-24_14-52-2.png |
46 kB |
Alex Rutkovsky |
Jan 24, 2024 13:52 |
Jan 24, 2024 13:52 |
|
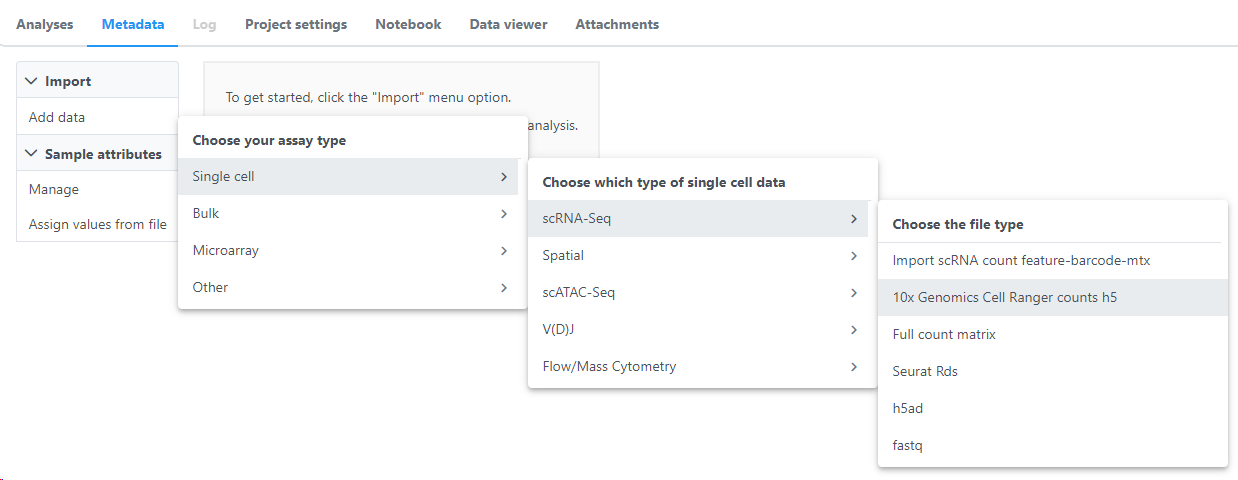
Page: The Metadata Tab
|
|
PNG File image2022-8-16_19-20-43.png |
46 kB |
Alex Rutkovsky |
Aug 16, 2022 18:20 |
Aug 16, 2022 18:20 |
|
Page: V(D)J Analysis
|
|
PNG File image2019-8-23_13-37-12.png |
46 kB |
Paul Fullerton |
Aug 23, 2019 13:37 |
Aug 23, 2019 13:37 |
|
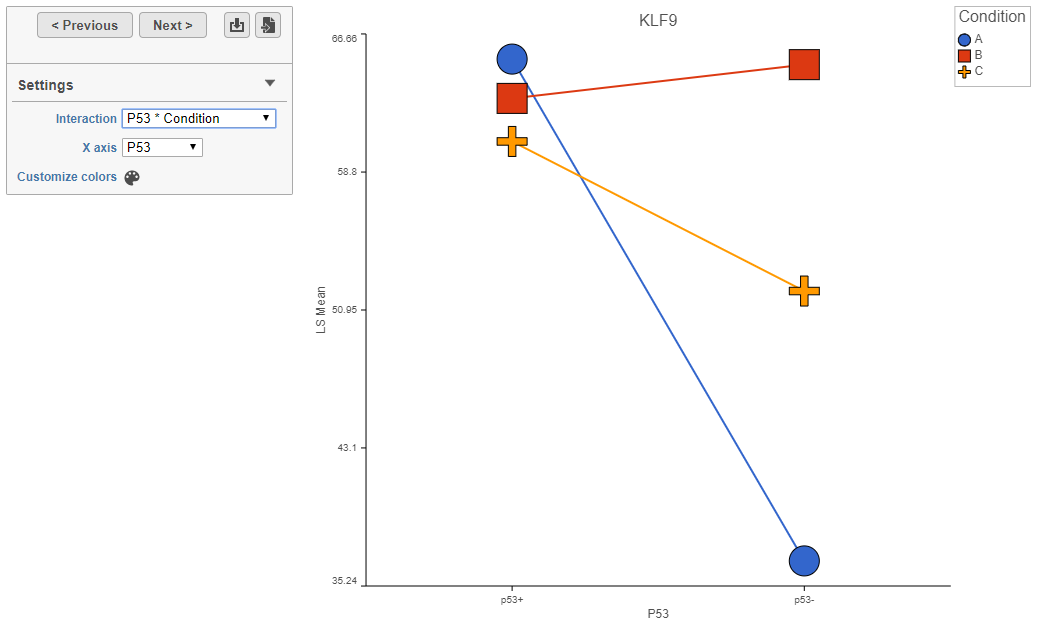
Page: Interaction Plots
|
|
PNG File image2018-4-4 11:20:47.png |
46 kB |
Paul Fullerton |
Apr 04, 2018 11:20 |
Apr 04, 2018 11:20 |
|
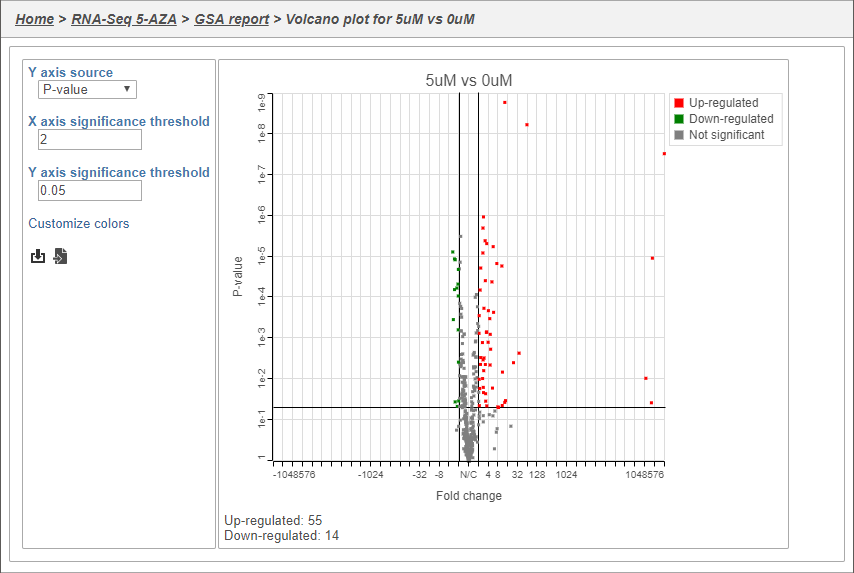
Page: Viewing DESeq2 results and creating a gene list
|
|
PNG File image2018-1-29 17:18:19.png |
45 kB |
Paul Fullerton |
Jan 29, 2018 17:18 |
Jan 29, 2018 17:18 |
|
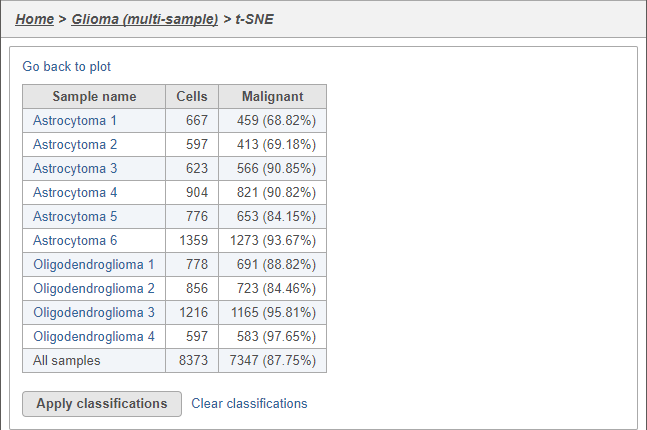
Page: Classify cells from multiple samples using t-SNE
|