Introduction
Partek Flow has a List generator function that allows you to investigate unique and common features between different lists within a project. These can be visualized in a Venn diagram consisting of up to five sets.
Filtering Lists
Feature lists can be generated by RNA-Seq tasks such as GSA and ANOVA. Filter your feature lists as needed. In the example below, three feature lists were generated by filtering the same multivariate GSA result on three different contrasts. Each filtered list appears as its own layer on the Analyses tab.
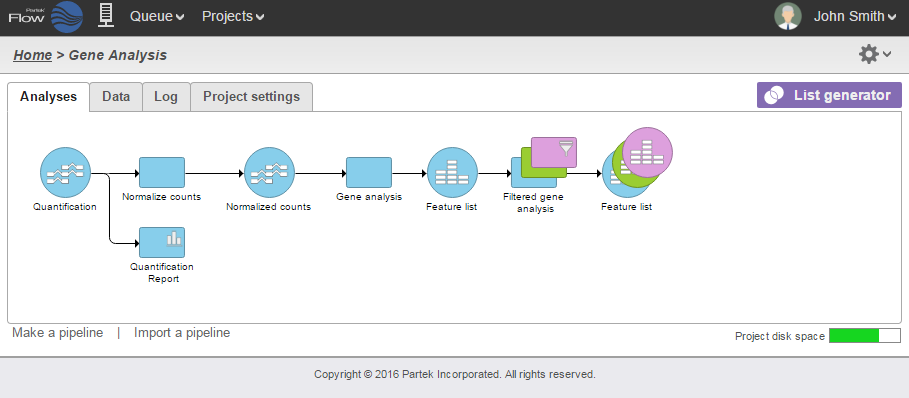 Figure 1. Project with multiple gene lists
Selecting Lists for Venn Diagram
To invoke the Venn diagram, click the  button. This brings up the list selector window. Select the data nodes you would like to include on the diagram using the check boxes.
Note that you must be a collaborator in the project to see the purple List Generator button.
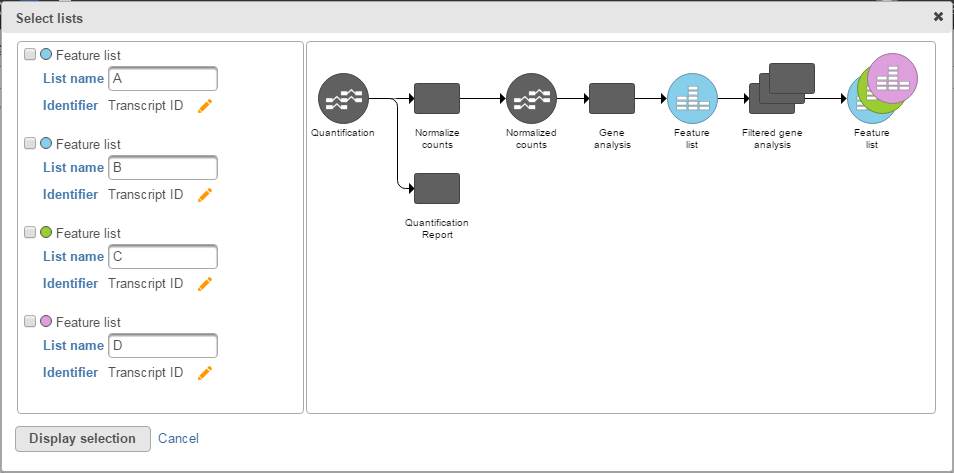 Figure 2. List selector window
If the current project does not contain any feature lists, a message will appear.
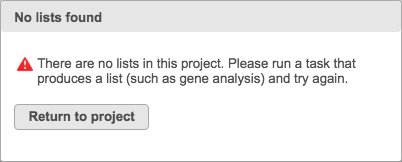 Figure 3. Error message appears when no lists within a project
The List name field can be customized to provide specific information about the selected list and will also serve as the set's name on the Venn diagram. Hovering your mouse over a specific feature list highlights its node location on the task graph.
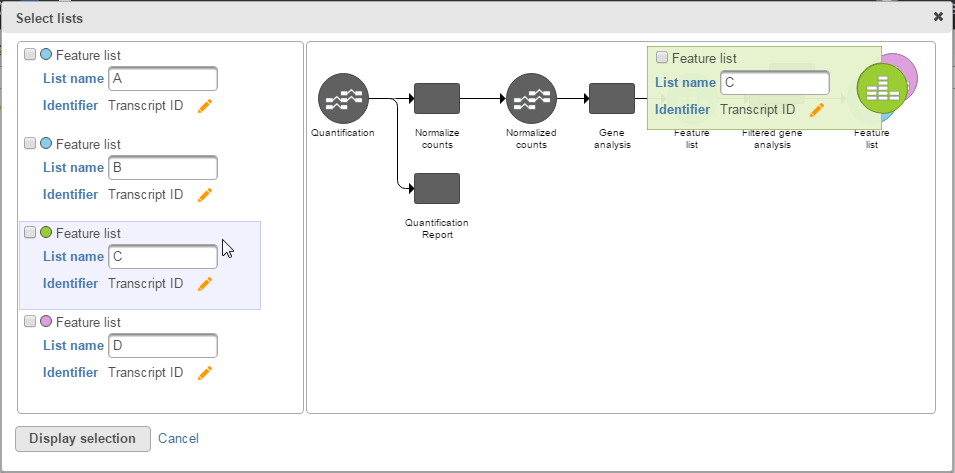 Figure 4. Selecting feature list highlights data node
Conversely, clicking a feature list data node highlights the feature list on the right panel.
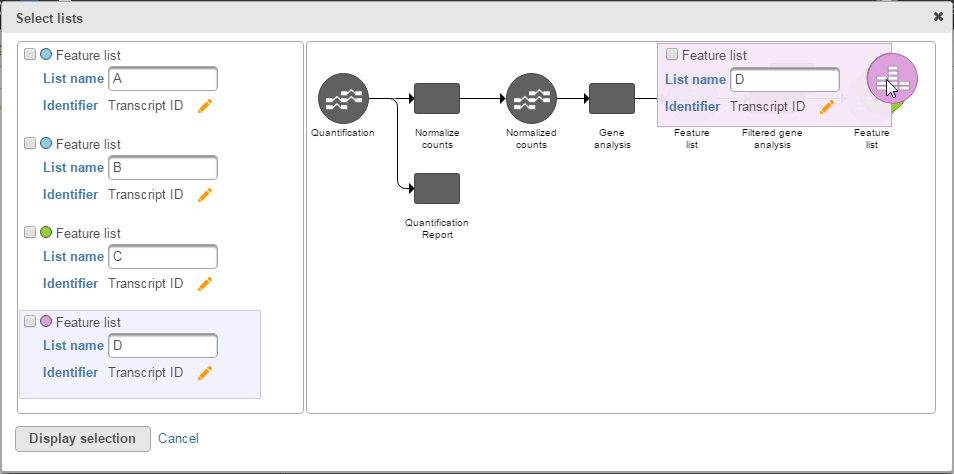 Figure 5. Selecting the data node
Click on the ![]() icon to select the identifier that will be used to compare between the sets. The Select identifier dialog box will then appear.
icon to select the identifier that will be used to compare between the sets. The Select identifier dialog box will then appear.
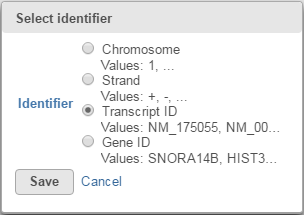 Figure 6. The Select identifier dialog box
For your convenience, example entries for each possible identifier is displayed. Select the radio button of the identifier you would like to use for comparison. Note that the List generator only uses Identifiers to determine common features within a list. For feature lists generated by automated tasks like Cufflinks' novel transcript discovery function, keep in mind that these identifiers may not be referring to the same feature.
Venn Diagram
Once you have selected your lists, click the Display selection button to invoke the Venn diagram.
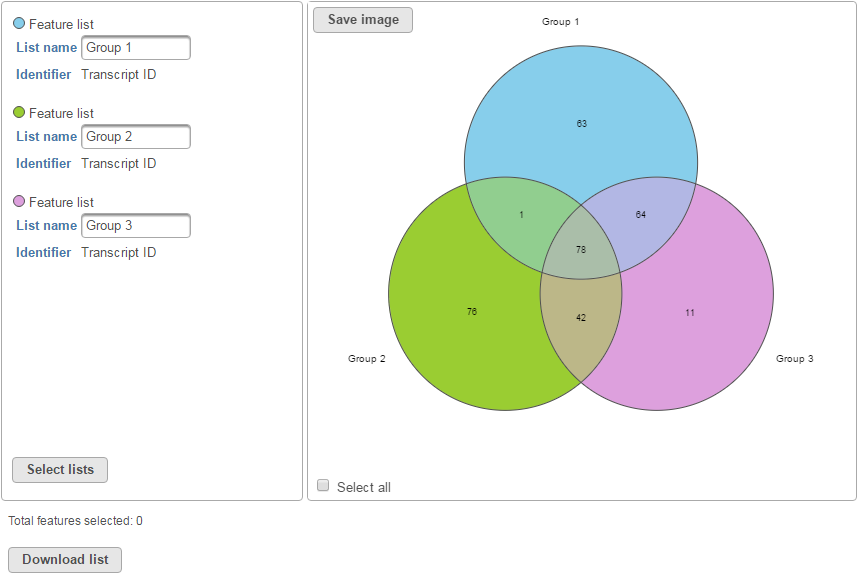 Figure 7. Venn diagram window
To save the current diagram displayed, click the Save image button. Images can be either in SVG or PNG format. You can also define the size and resolution you want the diagram to be. To maintain the fidelity of the colors in the Venn Diagram, we recommend downloading the image in PNG format. If a vector-based file format is required, you can also export the diagram in SVG format.
The Venn diagram is also interactive. Hovering over specific sections of the diagram highlight the feature list represented by that section. A tooltip also appears describing the number of elements in that section.
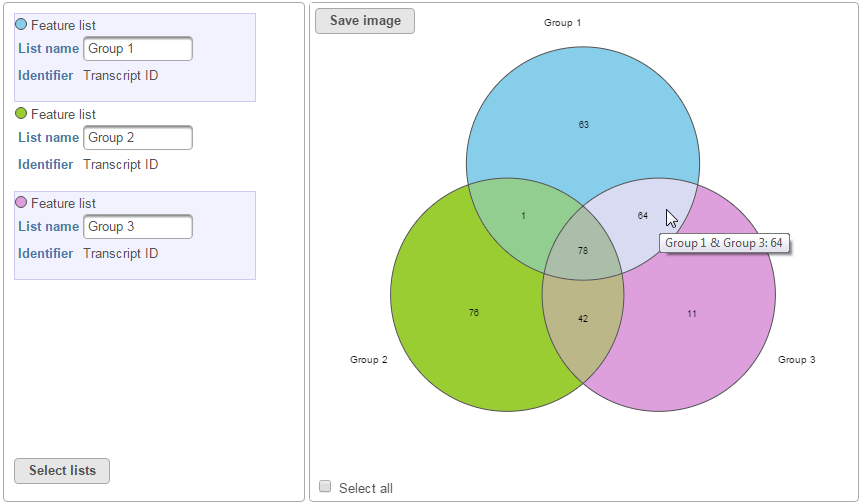 Figure 8. Highlighted Venn diagram
To download a list of identifiers belonging to a section, click on the section (a striped pattern will appear) and click the Download list button. Multiple sections can be selected to download a merged list of all corresponding identifiers. The Total features selected display updates the number of features selected as you select more sections.
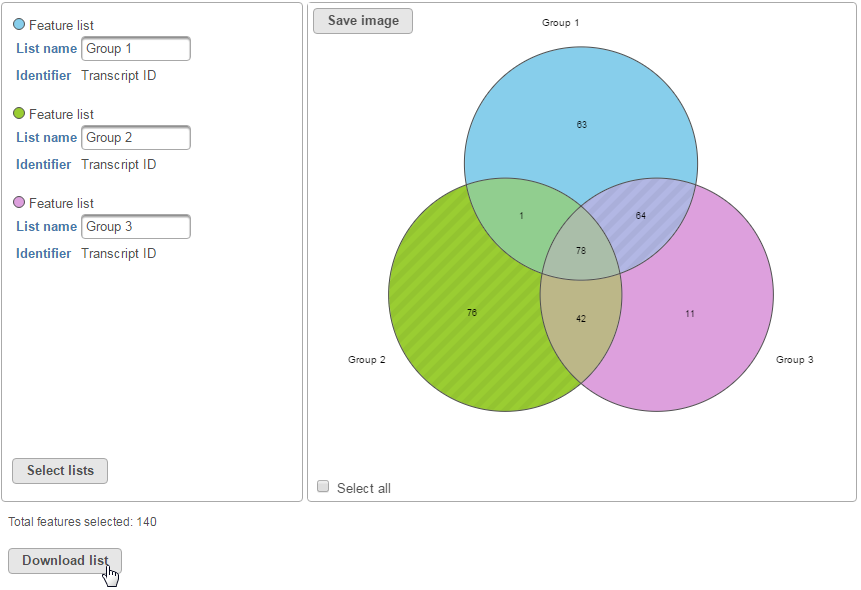 Figure 9. Downloading list of sections selected within a Venn diagram
Additional Assistance
If you need additional assistance, please visit our support page to submit a help ticket or find phone numbers for regional support.


| Your Rating: |
|
Results: |

|
34 | rates |
Overview
Content Tools
1 Comment
Melissa del Rosario
author: cignacio