Once we have performed DESeq2 to identify differentially expressed genes, we can create a list of significantly differentially expressed genes using cutoff thresholds.
- Double click the Feature list data node to open the task report
The task report spreadsheet will open showing genes on rows and the results of the DESeq2 on columns (Figure 1).
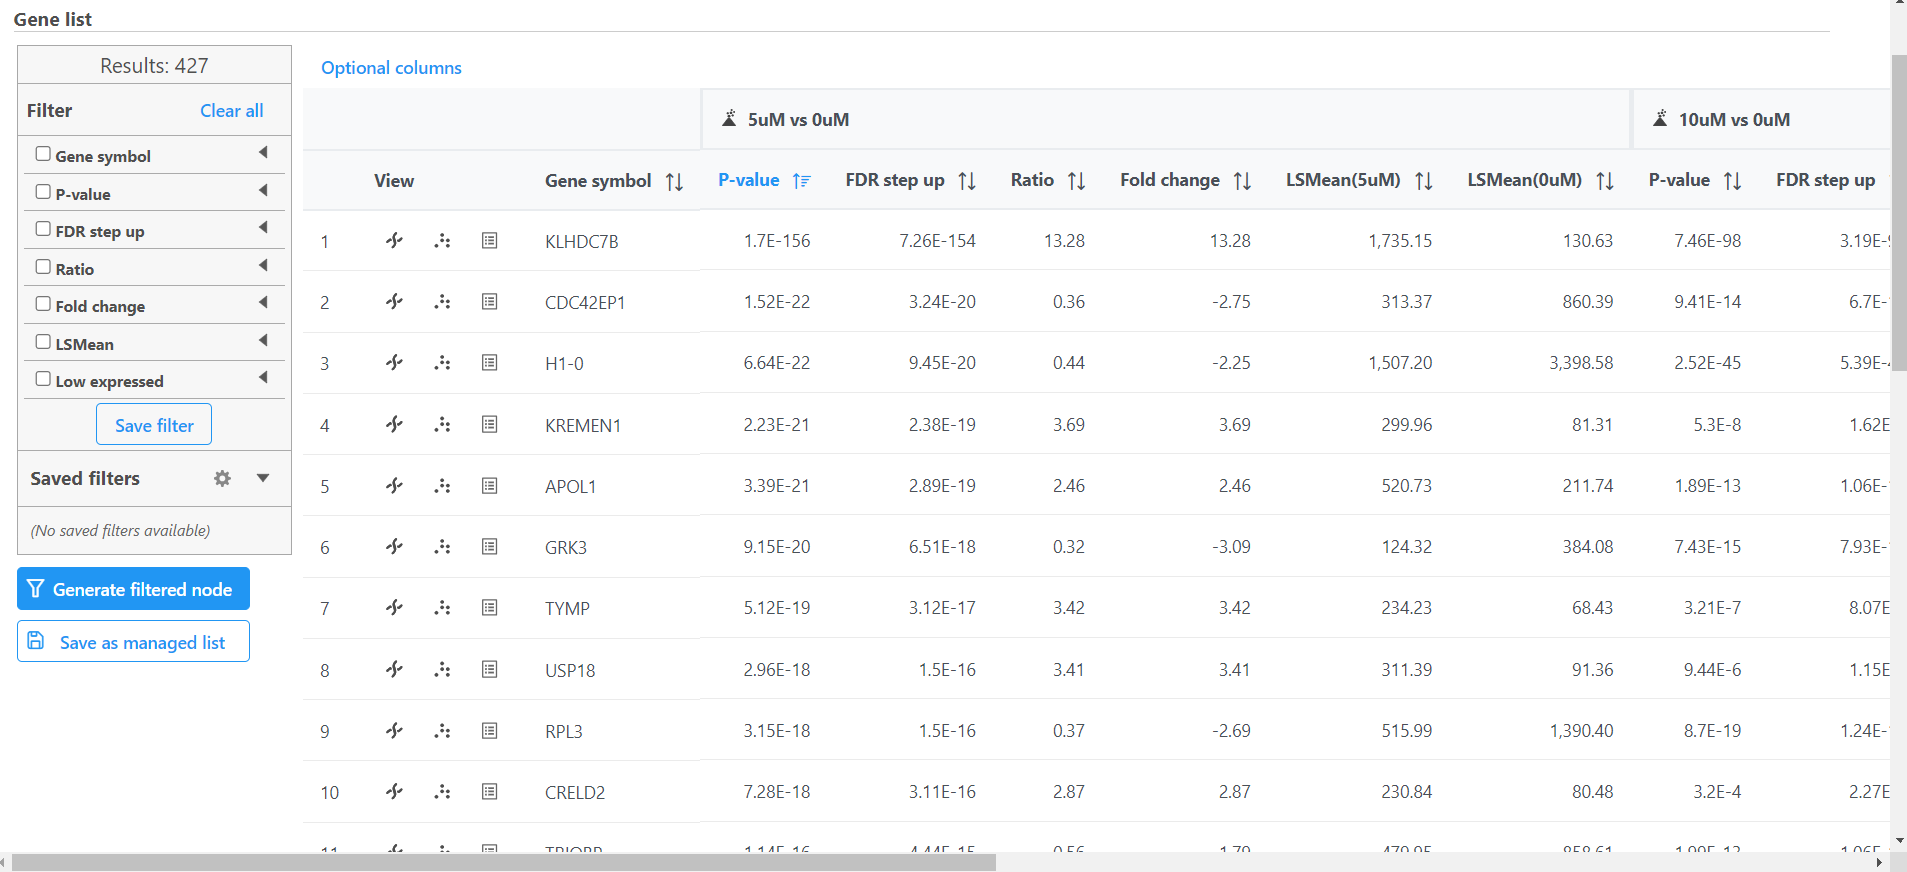
Figure 1. Viewing the DESeq2 task report spreadsheet
To get a sense of what filtering thresholds to set, we can view a volcano plot for a comparison.
- Click
 next to the 5uM vs. 0uM comparison
A volcano plot will open showing p-value on the y-axis and fold-change on the x-axis (Figure 2). If the gene labels are on (not shown), click on the plot to turn them off.
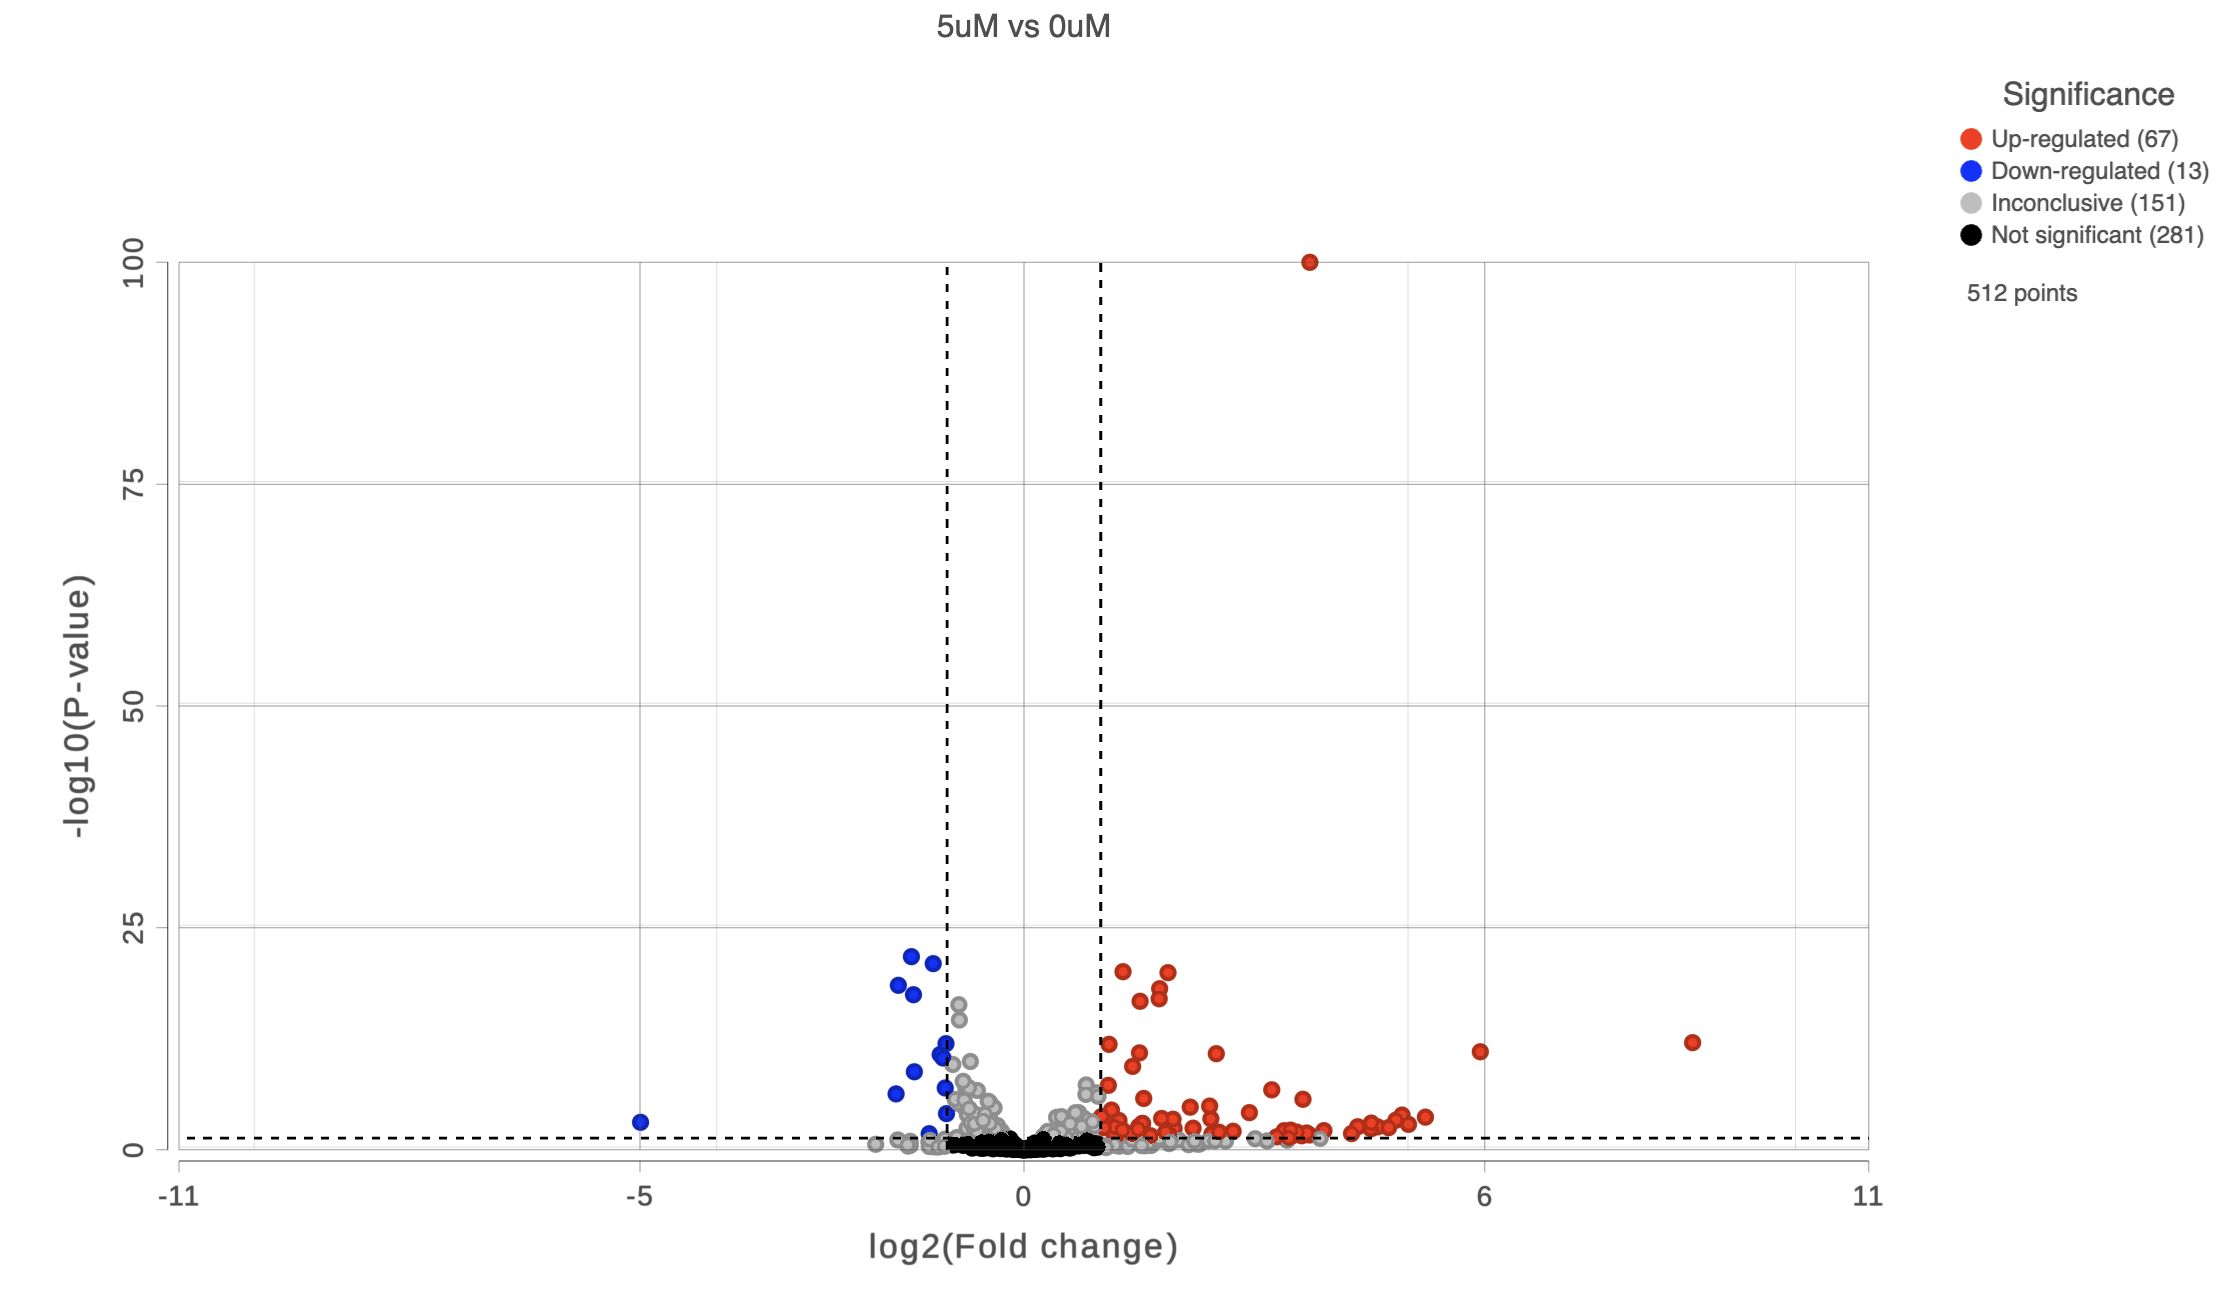
Figure 2. Viewing DESeq2 results with a volcano plot
Thresholds for the cutoff lines are set using the Statistics card (Configuration panel > Configure > Statistics). The default thresholds are |2| for the X axis and 0.05 for the Y axis.
- Switch to the browser tab showing the DESeq2 report
- Click FDR step up
- Click the triangle next to FDR step up to open the FDR step up options
- Leave All contrasts selected
- Set the cutoff value to 0.05. Hit Enter.
This will include genes that have a FDR step up value of less than or equal to 0.05 for all three contrasts, 5μM vs. 0μM, 10μM vs. 0μM and 5μM:10μM vs. 0μM. FDR step up is the false discovery rate adjusted p-value used by convention in microarray and next generation sequencing data sets in place of unadjusted p-value.
- Click Fold-change
- Click the triangle next to Fold-change to open the Fold-change options
- Leave All contrasts selected
- Set to From -2 to 2 with Exclude range selected. Hit Enter.
Note that the number of genes that pass the filter is listed at the top of the filter menu next to Results: and will update to reflect any changes to the filter. Here, 27 genes pass the filter (Figure 3). Depending on your settings, the number may be slightly different.
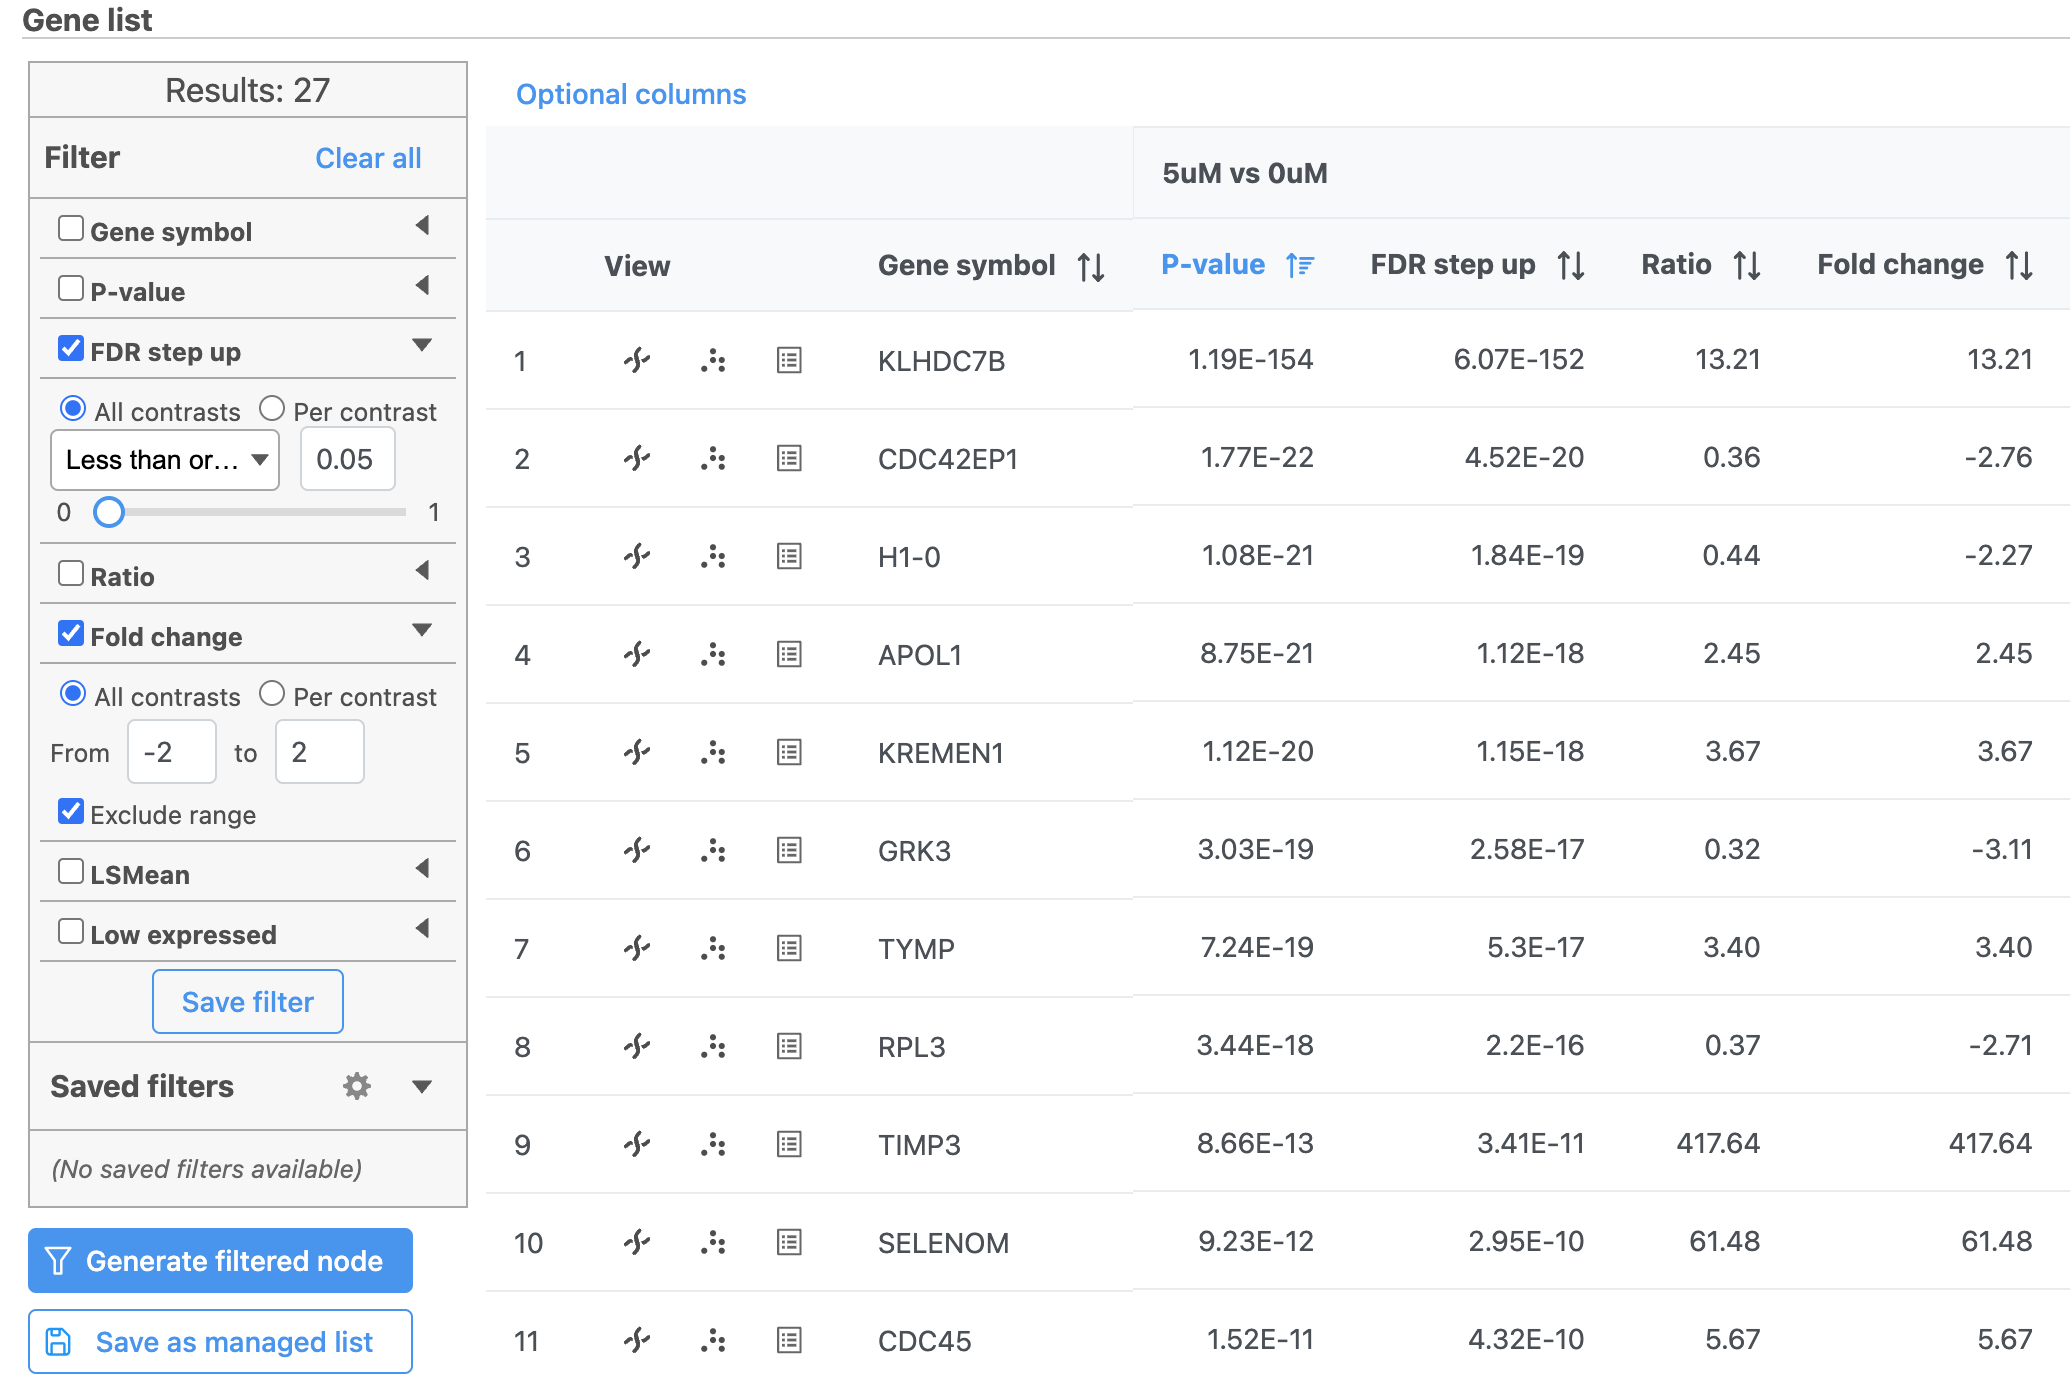
Figure 3. Applying filters to the DESeq2 results spreadsheet
- Click
 to create a data node with only the genes that pass the filter
This creates a Filter list task node and a Filtered feature list data node (Figure 4).
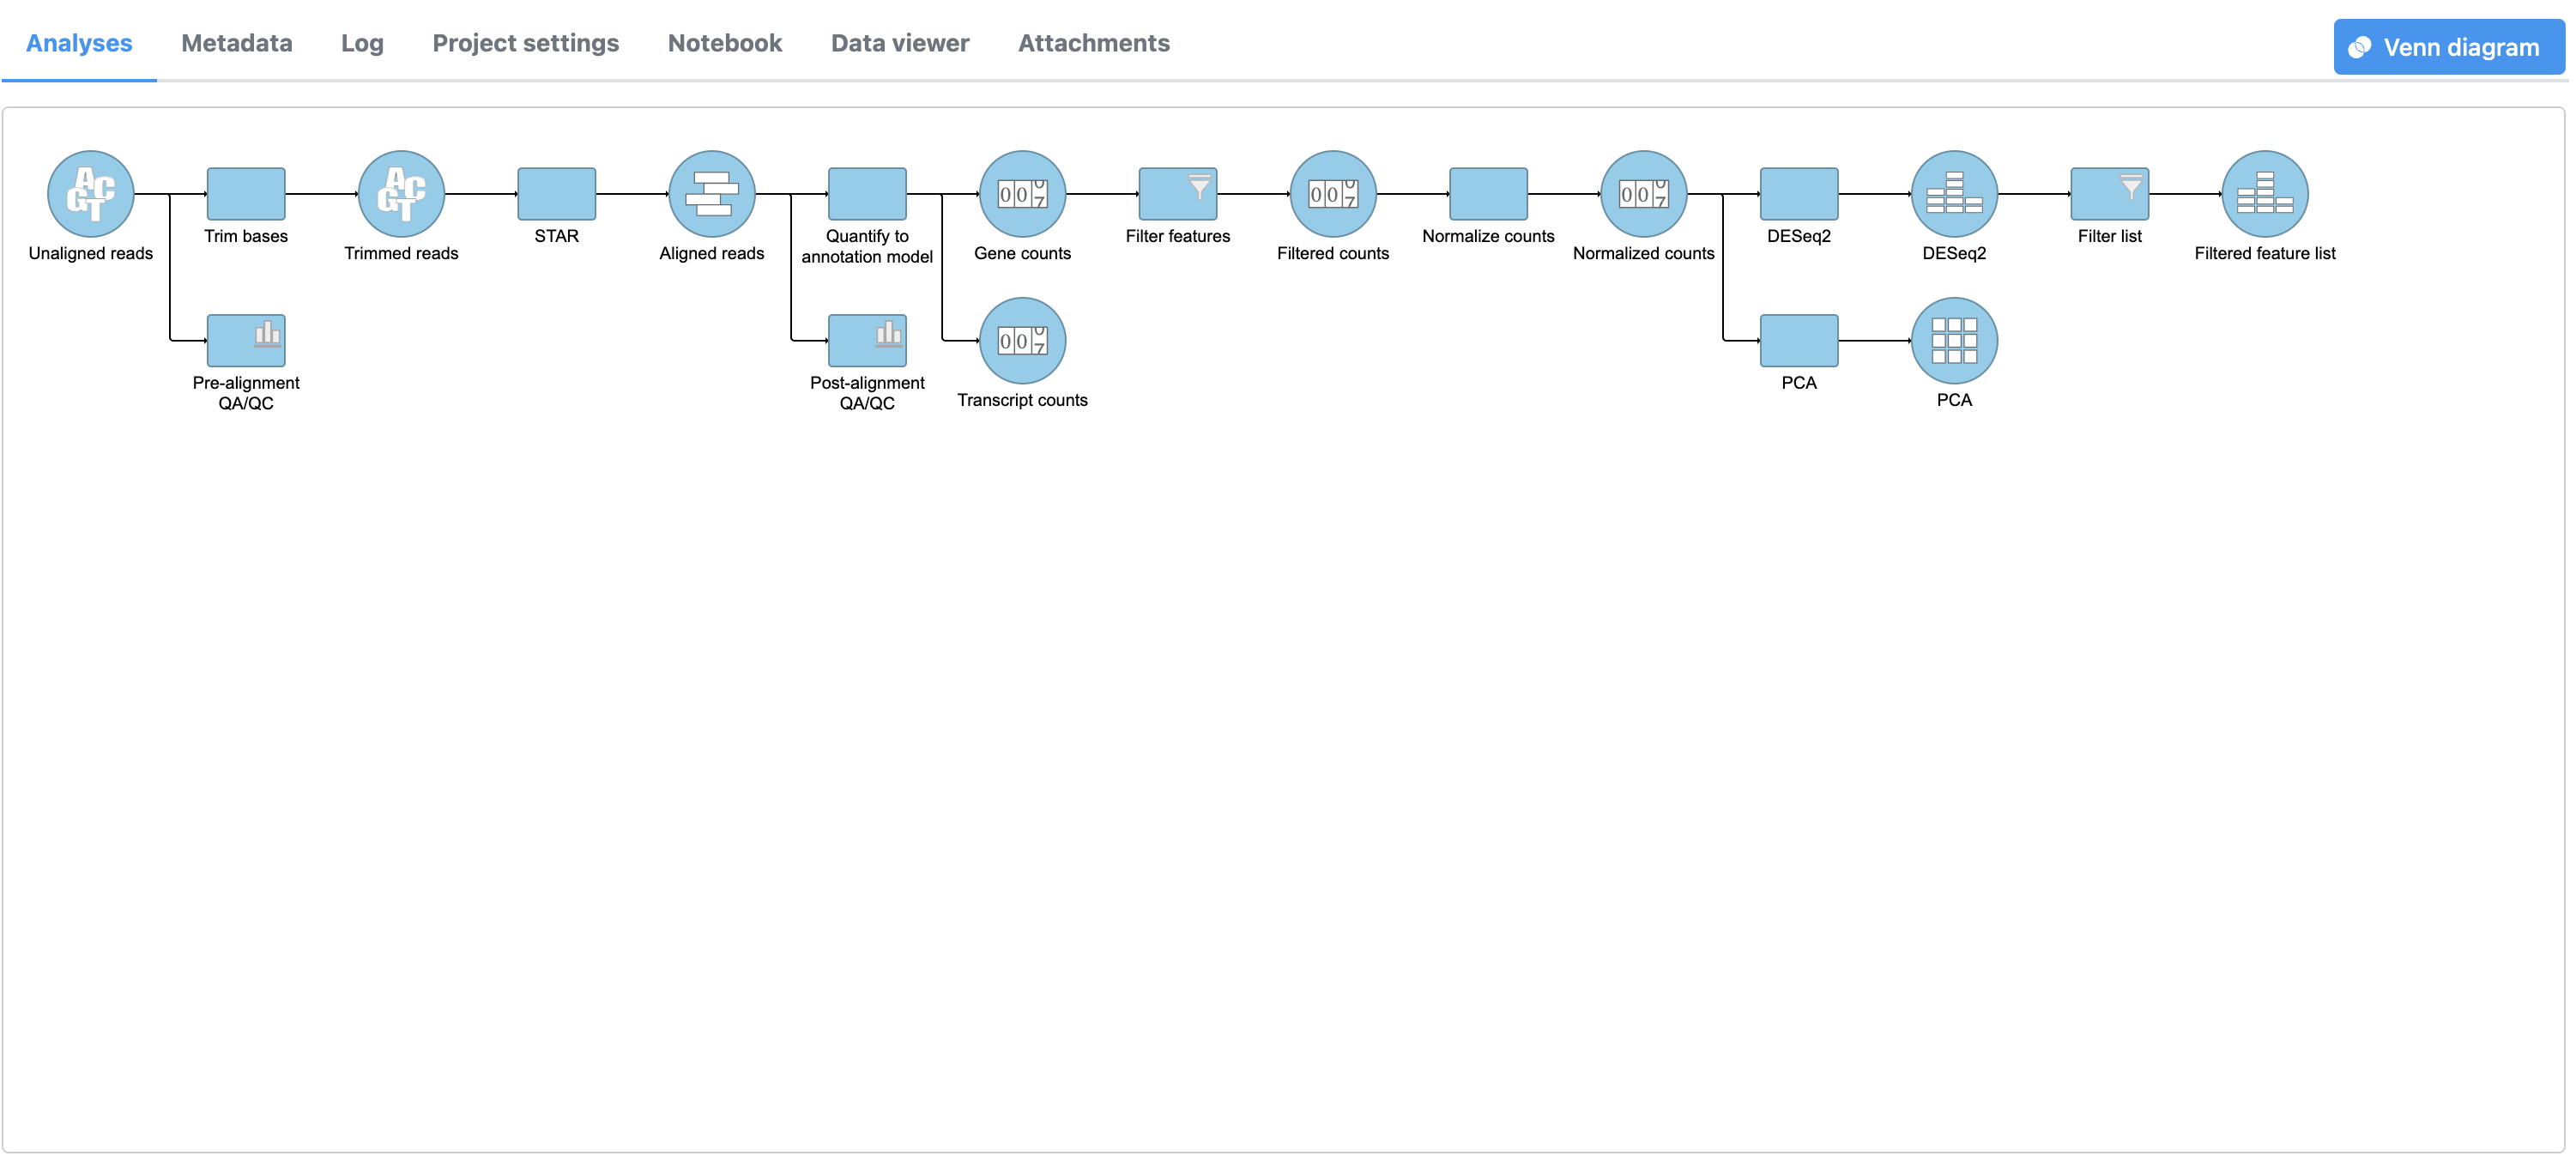
Figure 4. Filter list and a new Feature list node are added to the pipeline
Additional Assistance
If you need additional assistance, please visit our support page to submit a help ticket or find phone numbers for regional support.


| Your Rating: |
|
Results: |

|
30 | rates |
Overview
Content Tools