After normalizing the data, we can perform differential analysis to identify genes that are differentially expressed based on treatment.
- Click the Normalized counts node
- Click Statistics in the task menu
- Click Differential analysis in the task menu (Figure 1)
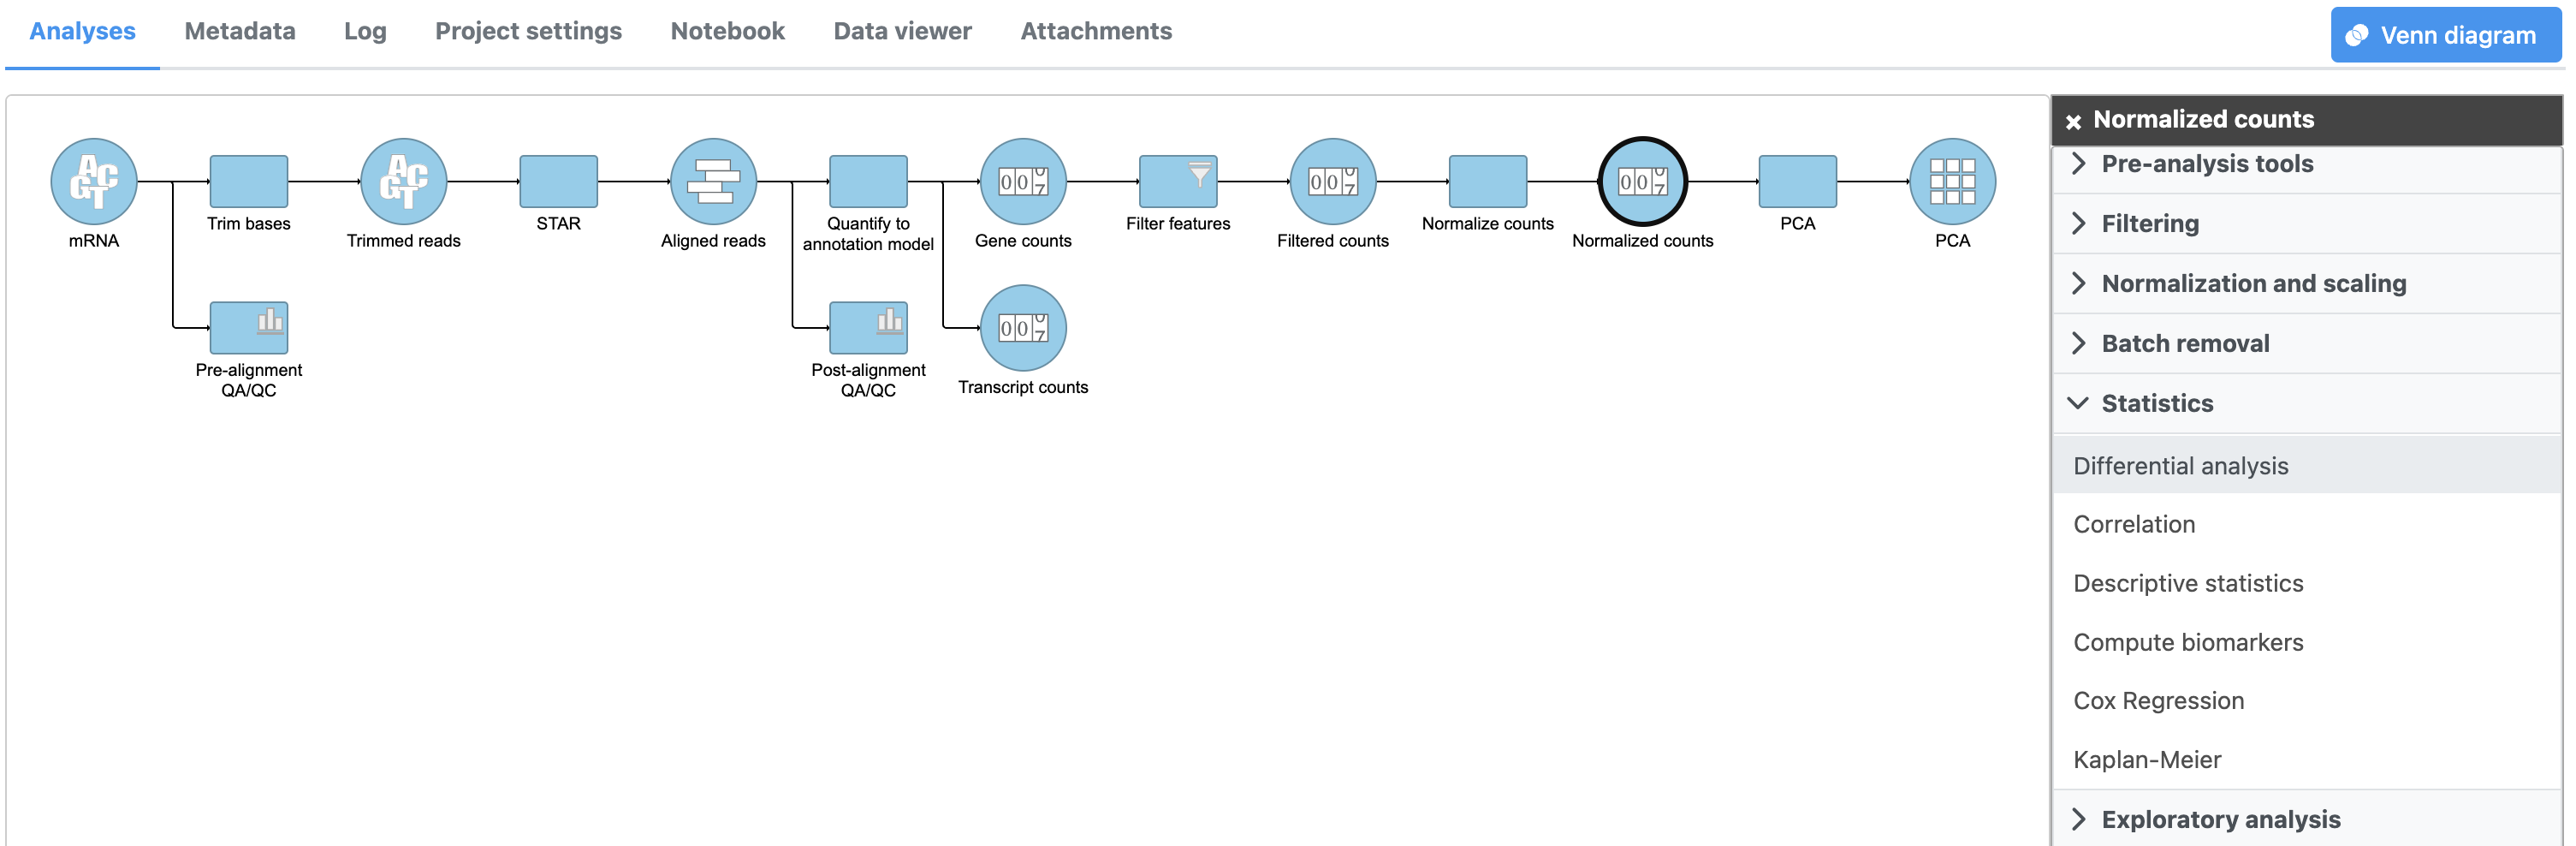
Figure 1. Navigating to the differential analysis options
Select the appropriate differential analysis method (Figure 2). In this tutorial we are going to use DESeq2, but Partek® Flow® offers a number of alternatives. Hover the mouse over the ![]() symbol for more information on each differential analysis method, or see our Differential Analysis user guide for a more in-depth look.
symbol for more information on each differential analysis method, or see our Differential Analysis user guide for a more in-depth look.
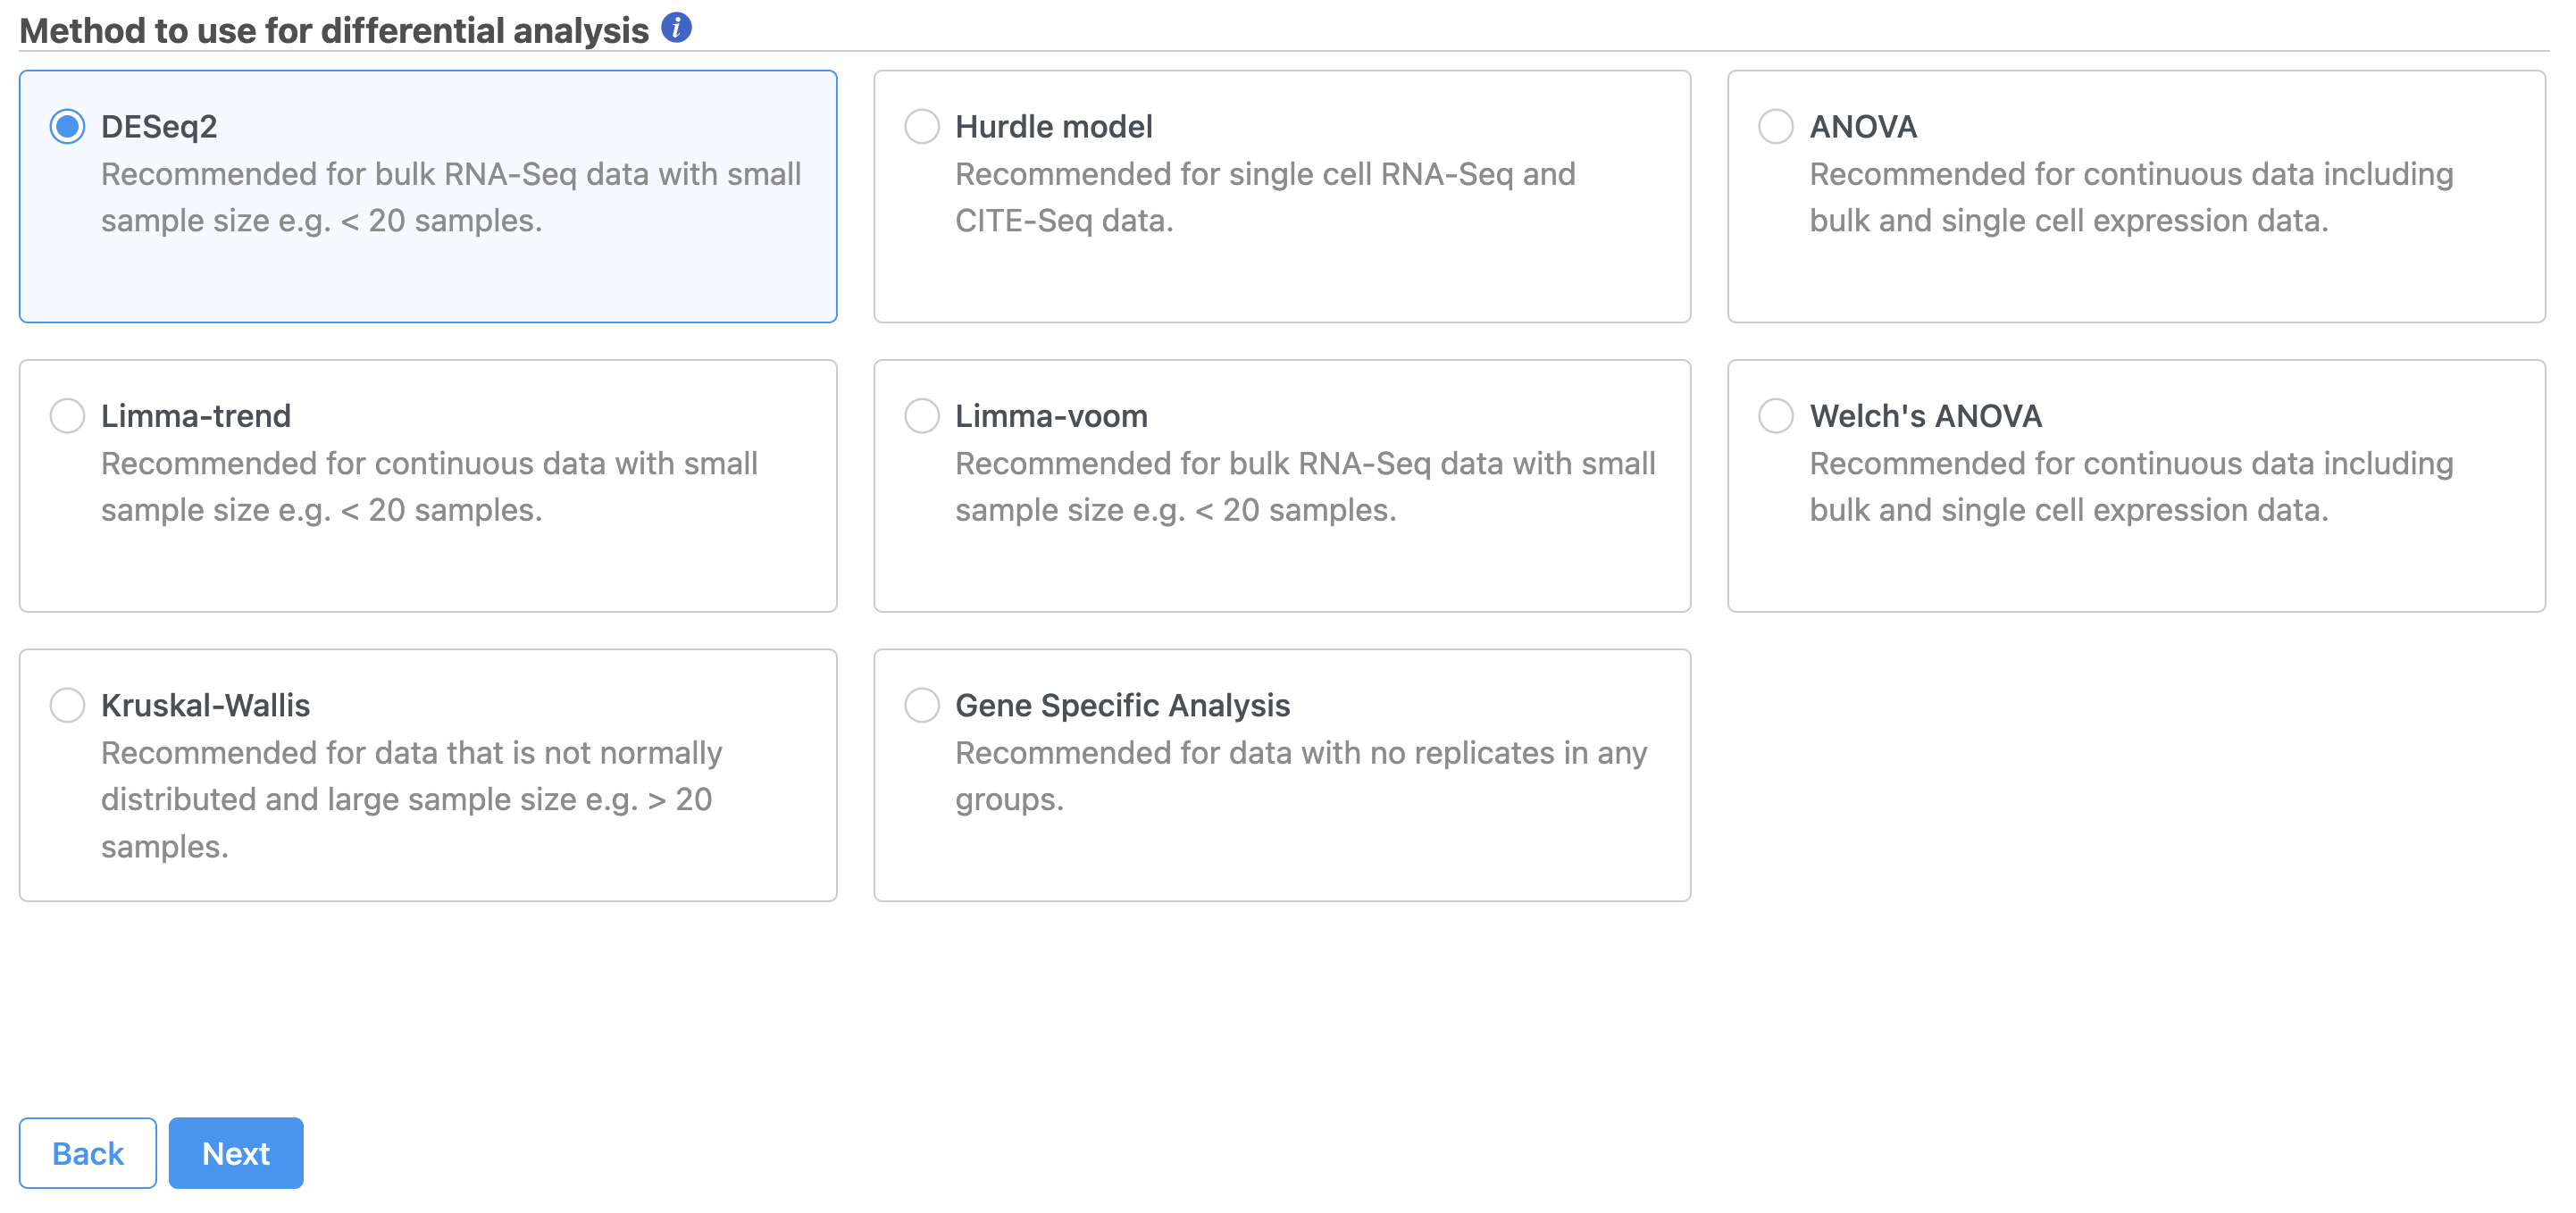 Figure 2. Select the method for differential analysis from the options provided.
- Check 5-AZA Dose and click Add factors to add the attribute to the statistical model.
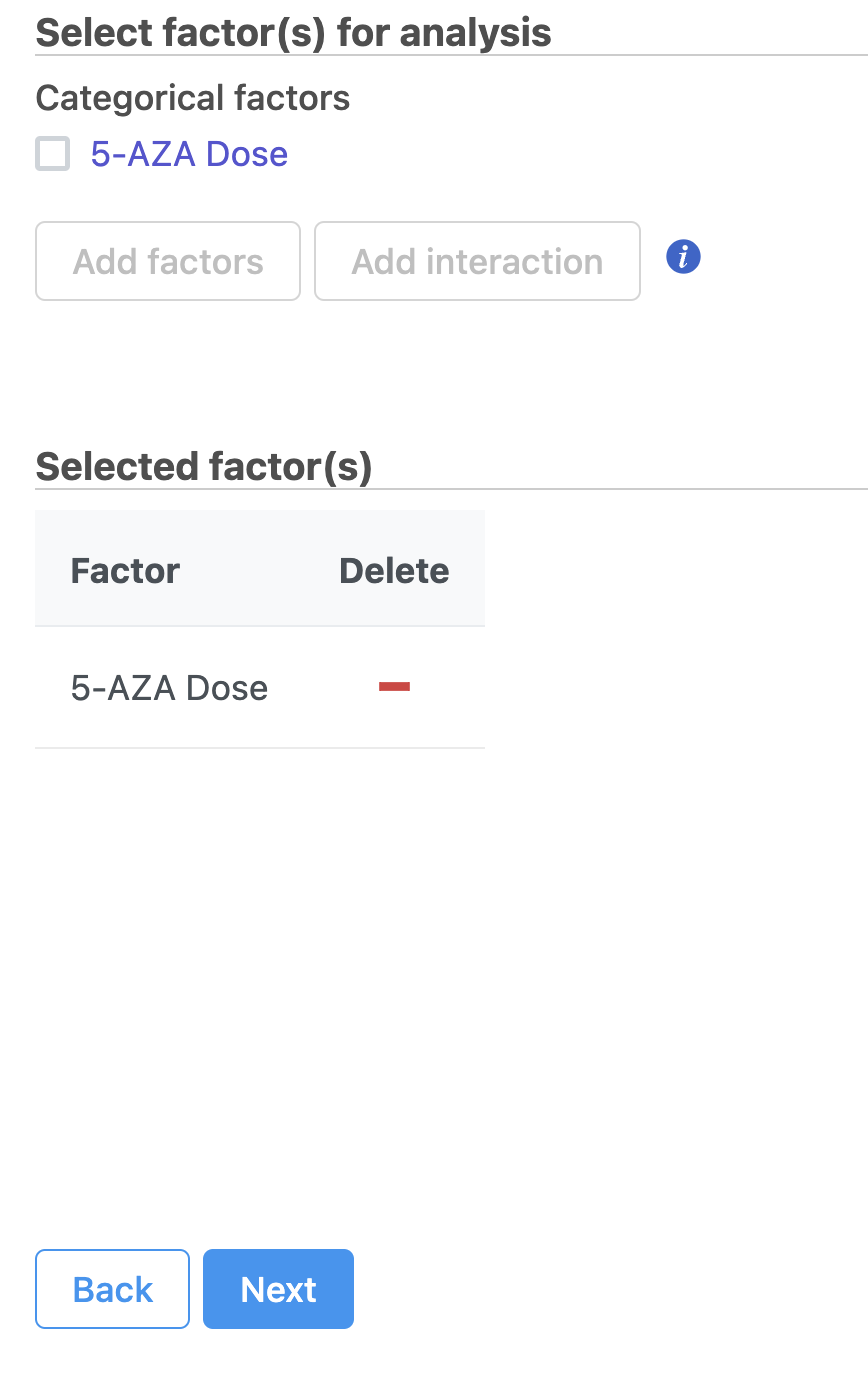
Figure 3. Selecting attributes to include
- Select Next to continue with 5-AZA Dose as the selected attribute
The Comparisons page will open (Figure 4).
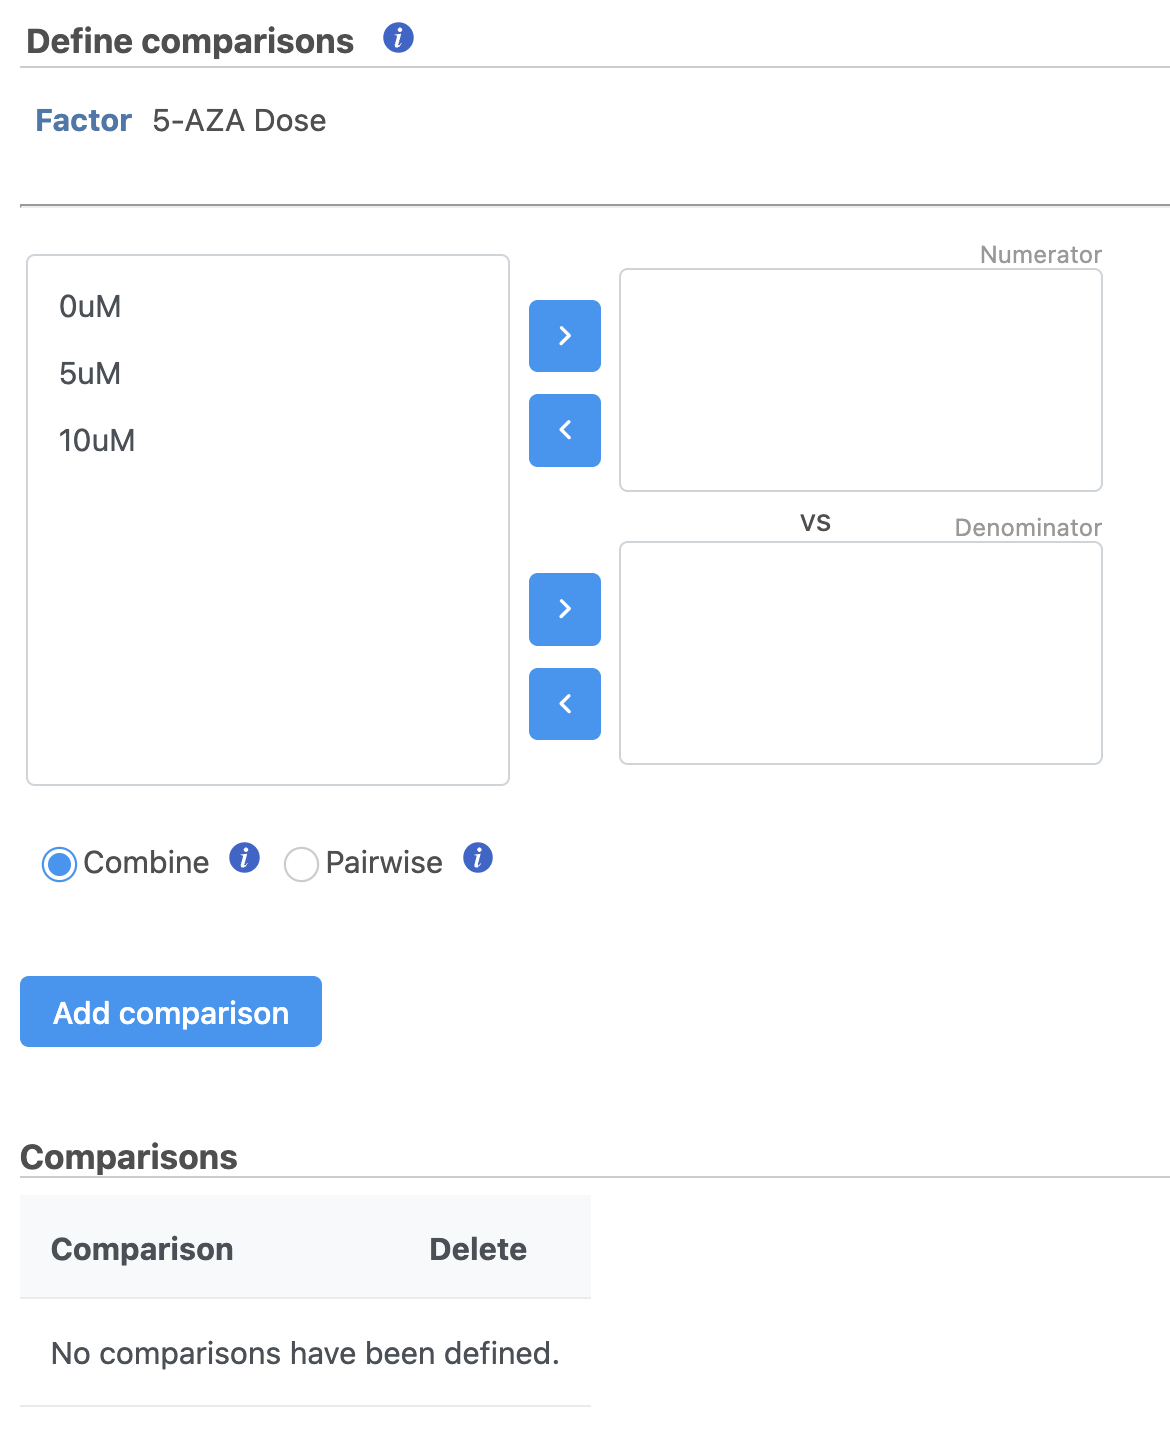
Figure 4. The Comparison selector allows multiple comparisons to be designed and added
It is easiest to think about comparisons as the questions we are asking. In this case, we want to know what are the differentially expressed genes between untreated and treated cells. We can ask this for each dose individually and for both collectively.
The upper box will be the numerator and the lower box will be the denominator in the comparison calculation so we will select the 0μM control in the lower box.
- Drag 5μM to the upper box
- Drag 0μM to the lower box
- Click Add comparison to add 5μM vs. 0μM to the comparison table (Figure 5)
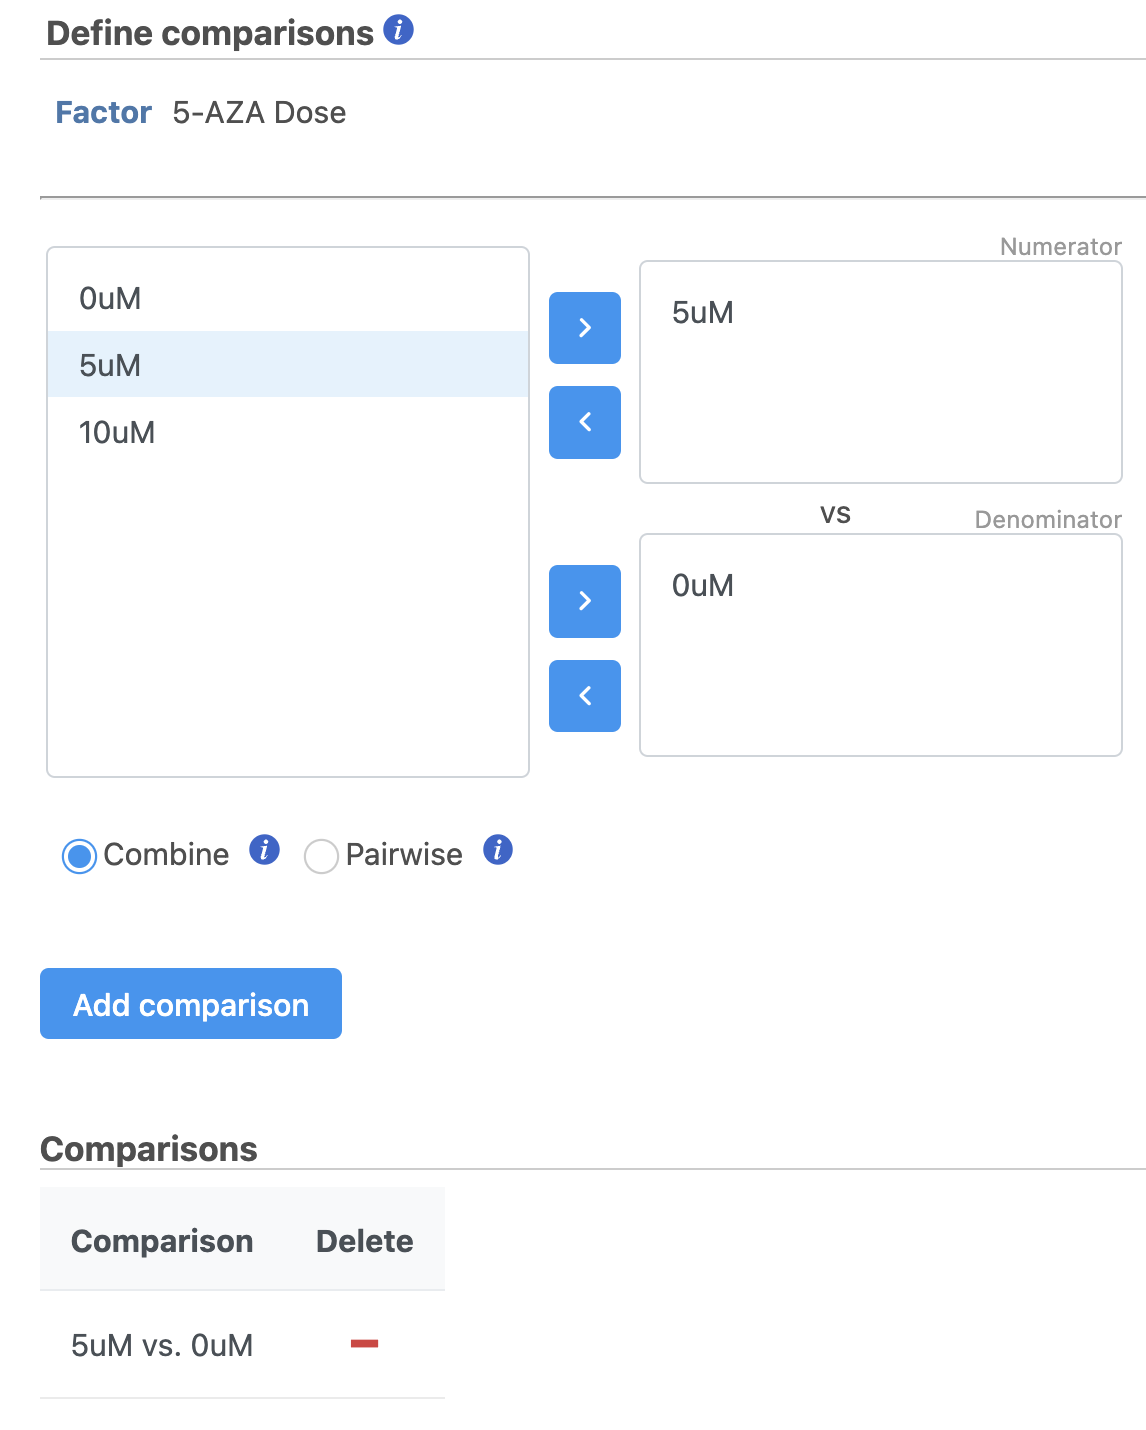
Figure 5. Designing a comparison to add
- Repeat to create comparisons for 10μM vs. 0μM and 10μM,5μM vs. 0μM (Figure 6)
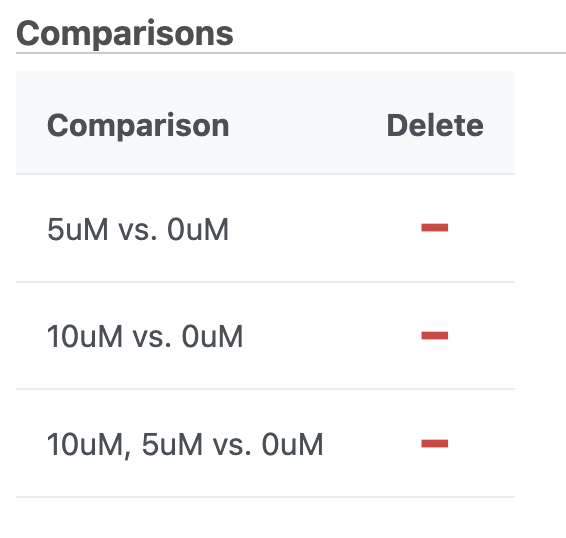
Figure 6. Comparisons for 5uM vs. 0uM, 10uM vs. 0uM, and 5uM:10uM vs. 0uM have been added
- Click Finish to perform DESeq2 as configured
A DESeq2 task node and a DESeq2 data node will be added to the pipeline (Figure 7).
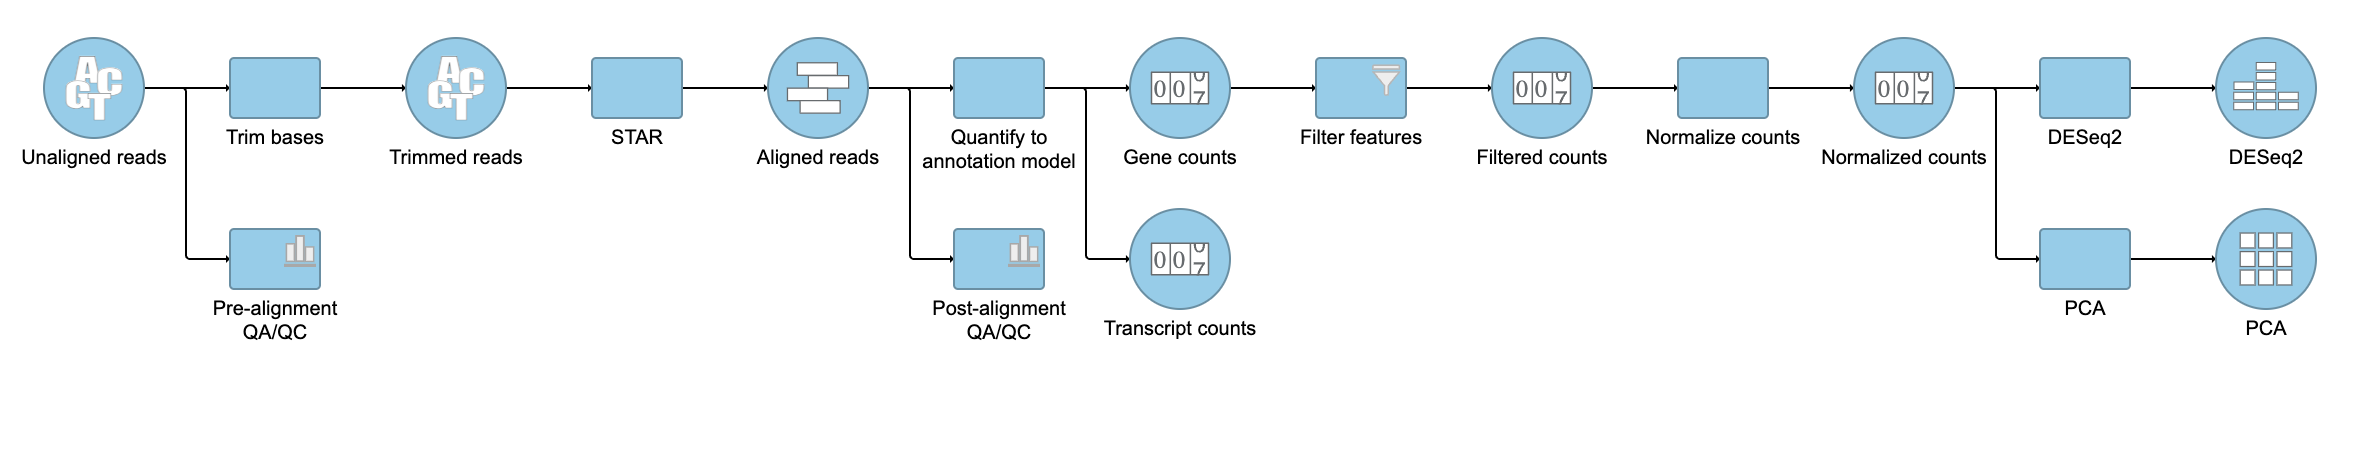
Figure 7. Gene analysis task node and Feature list data nodes
Additional Assistance
If you need additional assistance, please visit our support page to submit a help ticket or find phone numbers for regional support.


| Your Rating: |
|
Results: |

|
31 | rates |
Overview
Content Tools