In addition to the volcano plot showing all genes, we can view expression levels of each gene on a dot plot.
- Double-click the Filtered feature list data node to open the task report
- Click the FDR step up header in the 5uM vs. 0uM section to sort by ascending FDR step up
In the task report table, there is a column labeled View with three icons  in each row.
- Select
 to open a dot plot for the gene SELENOM
The dot plot for SELENOM (Figure 1) shows each sample as a point with normalized reads on the y-axis. Samples are separated and colored by treatment group.
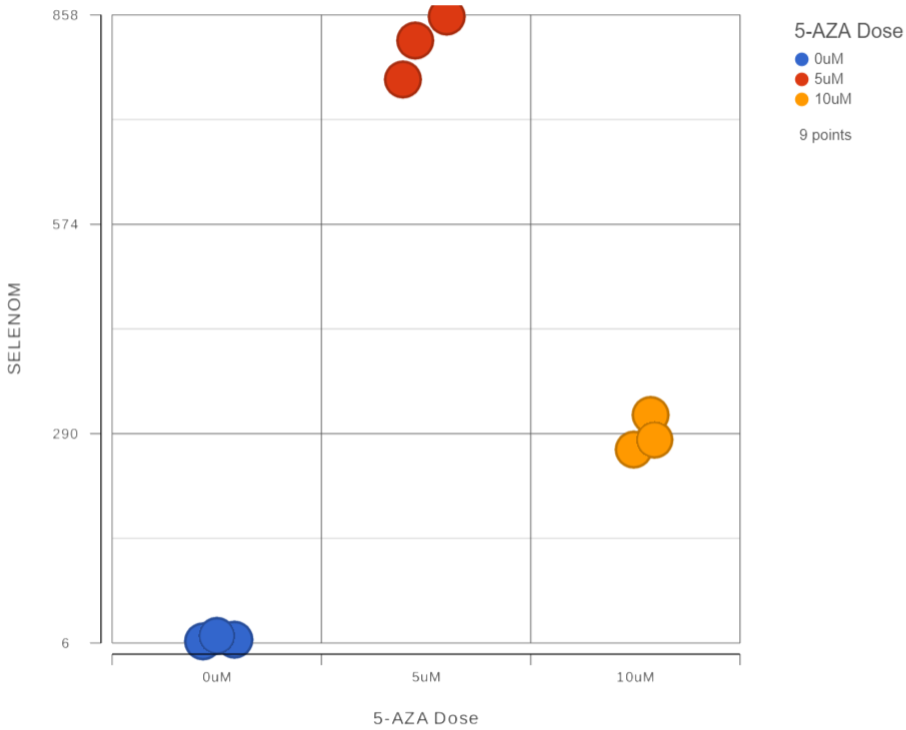
Figure 1. Dot plot for SELM
For more information about the dot plot, please see the Dot Plot user guide. To return to the DESeq2 report, switch to the browser table with filtered feature list.
In the DESeq2 report, you can select  to view additional information about the statistical results for a gene or select
  to view the region in Chromosome View. Chromosome View is discussed in the next section of the tutorial.
Additional Assistance
If you need additional assistance, please visit our support page to submit a help ticket or find phone numbers for regional support.


| Your Rating: |
|
Results: |

|
30 | rates |
Overview
Content Tools