Alternative splicing results in a single gene coding for multiple protein isoforms, so this task can only be invoked from transcript level data. The algorithm is is based on ANOVA to detect genes with multiple transcripts showing expression changes differently in different biology groups, e.g. a gene has two transcripts: A and B, transcript A is showing up-regulation in the treated group comparing to the control group, while B is showing down regulation in treated group.
Alt-splicing ANOVA dialog
The alt-splicing dialog is very similar to ANOVA dialog, since the analysis is based on the ANOVA model specified. To setup an ANOVA model, first chose factors from the available sample attributes. The factors can be categorical or numeric attribute(s). Click on a check box to select and click Add factors button to add a factor to the model (Figure 1).
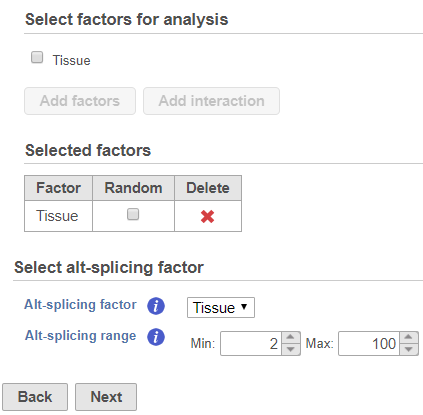 Figure 1. Alt-splicing dialog: selecting factors and alt-splicing factors
Only one alt-splicing factor needs to be selected from the ANOVA factors. The ANOVA model performed is based on the factors specified in the dialog, while the transcript ID and transcript ID interaction with alt-splicing factor effects are added into the model automatically.
Figure 1. Alt-splicing dialog: selecting factors and alt-splicing factors
Only one alt-splicing factor needs to be selected from the ANOVA factors. The ANOVA model performed is based on the factors specified in the dialog, while the transcript ID and transcript ID interaction with alt-splicing factor effects are added into the model automatically.
- Transcript ID effect: not all transcripts of a gene are expressed at the same level, so transcript ID is added to the model to account for transcript-to.transcript differences.
- Interaction of transcript ID with alt-splicing factor: that effect is used to estimate whether different transcripts have different expression among the levels of the same factor.
Suppose there is an experiment designed to detect transcripts showing differential expression in two tissue groups: liver vs muscle. The alt-splicing ANOVA dialog allows you to specify the ANOVA model that in this analysis is the Tissue. The alt-splicing factor is chosen from the ANOVA factor(s), so the alt-splicing factor is also Tissue (Figure 1).
The alt-splicing range will limit analysis to genes possessing the number of transcripts in the specified range. Lowering the maximum number of transcripts will increase the speed of analysis.
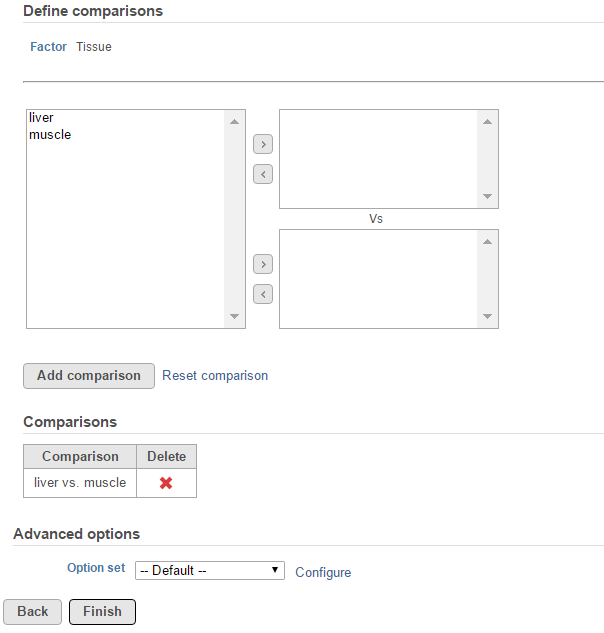 Figure 2. Alt-splicing ANOVA comparisons setup dialog
Click Next to setup the comparisons (Figure 2). The levels (i.e. subgroups) of the alt-splicing factor will be displayed in the left panel; click to select a level name and move it to one of the panels on the right. The fold change calculation on the comparison will use the group in the top panel as the numerator, and the group in the bottom panel as the denominator. Click on Add comparison button to add a comparison to the comparisons table.
Figure 2. Alt-splicing ANOVA comparisons setup dialog
Click Next to setup the comparisons (Figure 2). The levels (i.e. subgroups) of the alt-splicing factor will be displayed in the left panel; click to select a level name and move it to one of the panels on the right. The fold change calculation on the comparison will use the group in the top panel as the numerator, and the group in the bottom panel as the denominator. Click on Add comparison button to add a comparison to the comparisons table.
ANOVA advanced options
Click on the Configure to customize Advanced options (Figure 3).
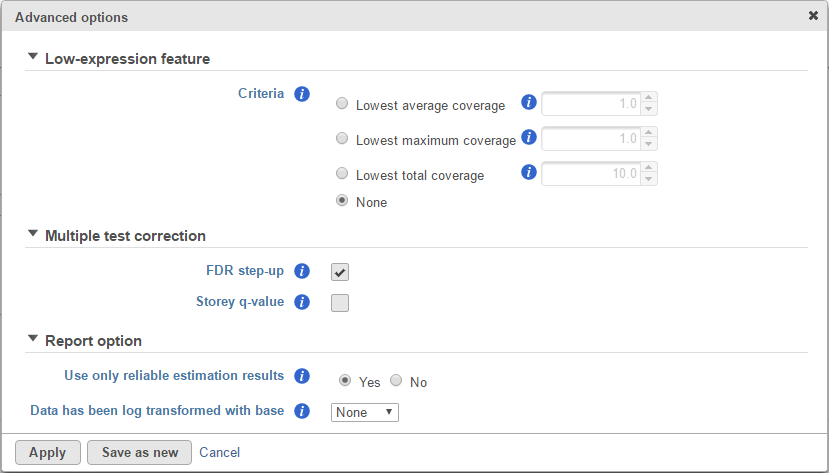 Figure 3. Configuring advanced options when running alt-splicing ANOVA
Low-expression feature and Multiple test correction sections are the same as the matching GSA advanced option, so see GSA advanced options discussion.
Figure 3. Configuring advanced options when running alt-splicing ANOVA
Low-expression feature and Multiple test correction sections are the same as the matching GSA advanced option, so see GSA advanced options discussion.
Report option
User only reliable estimation results: There are situations when a model estimation procedure does not fail outright, but still encounters some difficulties. In this case, it can even generate p-value and fold change on the comparisons, but they are not reliable, i.e. they can be misleading. Therefore, the default is set to Yes.
Data has been log transformed with base: showing the current scale of the input data on this task.
Alt-splicing ANOVA report
For this analysis, only genes with more than one transcript will be included in the calculation. The report format is the same as ANOVA report, each row represent a transcript, and besides statistics information on the specified comparisons, there is also alt-splicing information at the right end of the table. That information is represented by the p-value of interaction of transcript ID with alt-splicing factor. Note that the transcripts of the same gene should have the same p-value. Small p-value indicates significant alt-splicing event, hence the table is sorted based on that p-value by default (Figure 4).
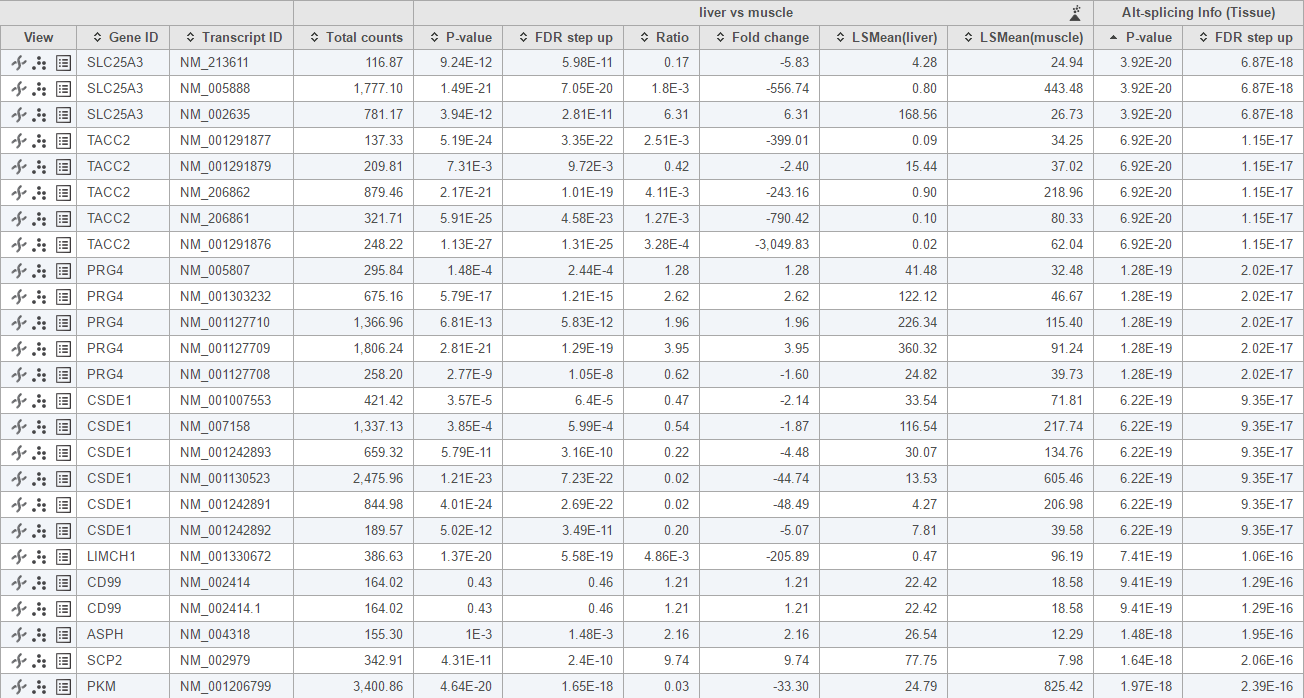 Figure 4. Alt-splicing report. Clicking on the column header sorts the table. Panel on the left filters the table
In the example above (Figure 4), the alt-splicing p-value of gene SLC25A3 is very small which indicates that this gene shows preferential transcript expression across tissues. There are 3 splicing variants of the gene: NM_213611, NM_005888 and NM_002635. Fold change clarifies that NM_005888 has higher expression in the muscle relative to the liver (negative fold change, liver as the reference category), while NM_002635 has higher expression in the liver.
Figure 4. Alt-splicing report. Clicking on the column header sorts the table. Panel on the left filters the table
In the example above (Figure 4), the alt-splicing p-value of gene SLC25A3 is very small which indicates that this gene shows preferential transcript expression across tissues. There are 3 splicing variants of the gene: NM_213611, NM_005888 and NM_002635. Fold change clarifies that NM_005888 has higher expression in the muscle relative to the liver (negative fold change, liver as the reference category), while NM_002635 has higher expression in the liver.
To visualize the difference, click on the Browse to location icon ( ) (Figure 5). The 3rd exon is differentially expressed between NM_005888 and NM_002635. Muscle primarily expresses NM_005888 while liver primarily uses NM_002635.
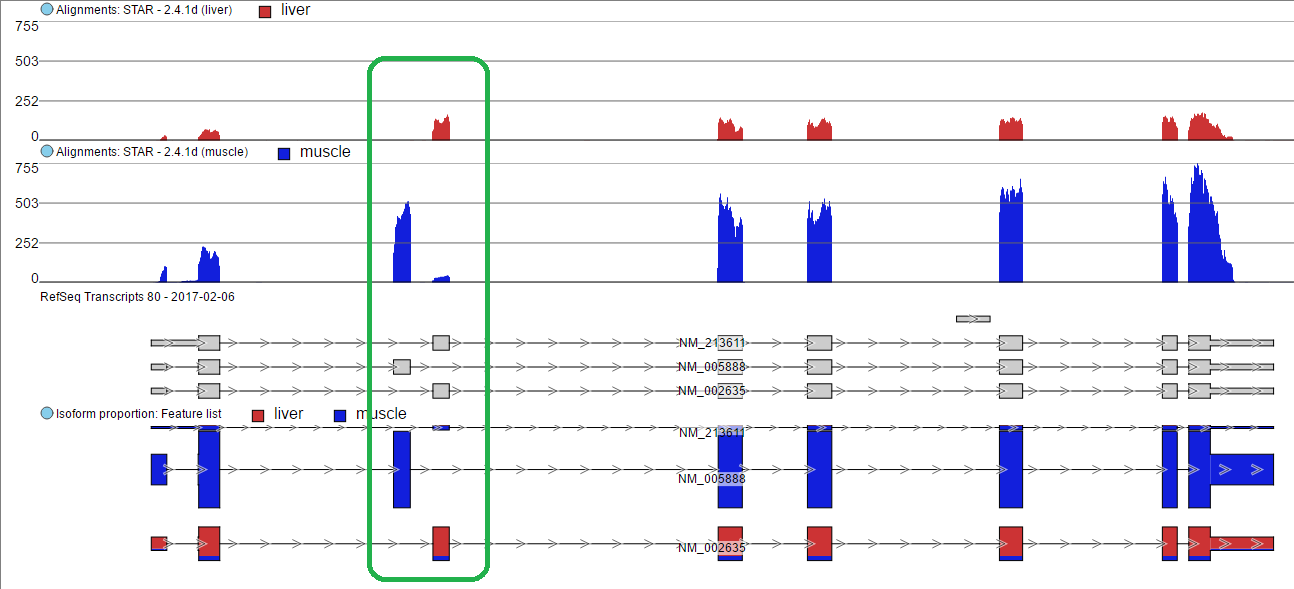 Figure 5. Isoform proportion track in chromosome view visualising alternative splicing. Differential usage of exon 3 is highlighted
Additional Assistance
If you need additional assistance, please visit our support page to submit a help ticket or find phone numbers for regional support.


| Your Rating: |
|
Results: |

|
40 | rates |
Overview
Content Tools