| Name
|
Size
|
Creator |
Creation Date
|
Last Modification Date
|
Labels |
Attached To |
|
PNG File image2018-12-20 11:24:15.png |
85 kB |
Paul Fullerton |
Dec 20, 2018 11:24 |
Dec 20, 2018 11:35 |
|
Page: Importing a GEO / ENA project
|
|
PNG File image2019-8-30_11-20-4.png |
85 kB |
Zhengbin Liu |
Jun 17, 2022 15:08 |
Jun 17, 2022 15:08 |
|
Page: Feature linkage analysis
|
|
PNG File image2019-8-30_11-20-4.png |
85 kB |
Paul Fullerton |
Aug 30, 2019 11:20 |
Aug 30, 2019 11:20 |
|
Page: Peak Callers (MACS2)
|
|
PNG File Screenshot 2023-08-09 at 14.48.57.png |
85 kB |
Matteo Luberti |
Aug 09, 2023 09:52 |
Aug 09, 2023 09:52 |
|
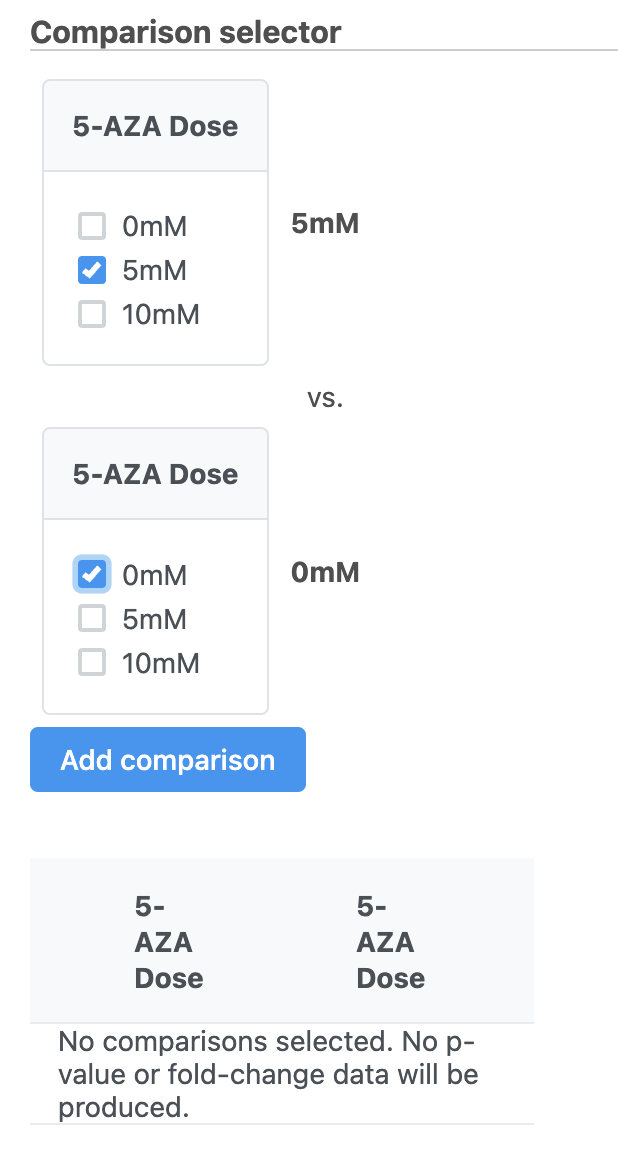
Page: Performing differential expression analysis with DESeq2
|
|
PNG File image2018-2-15 12:1:38.png |
85 kB |
Paul Fullerton |
Feb 15, 2018 12:01 |
Feb 15, 2018 12:01 |
|
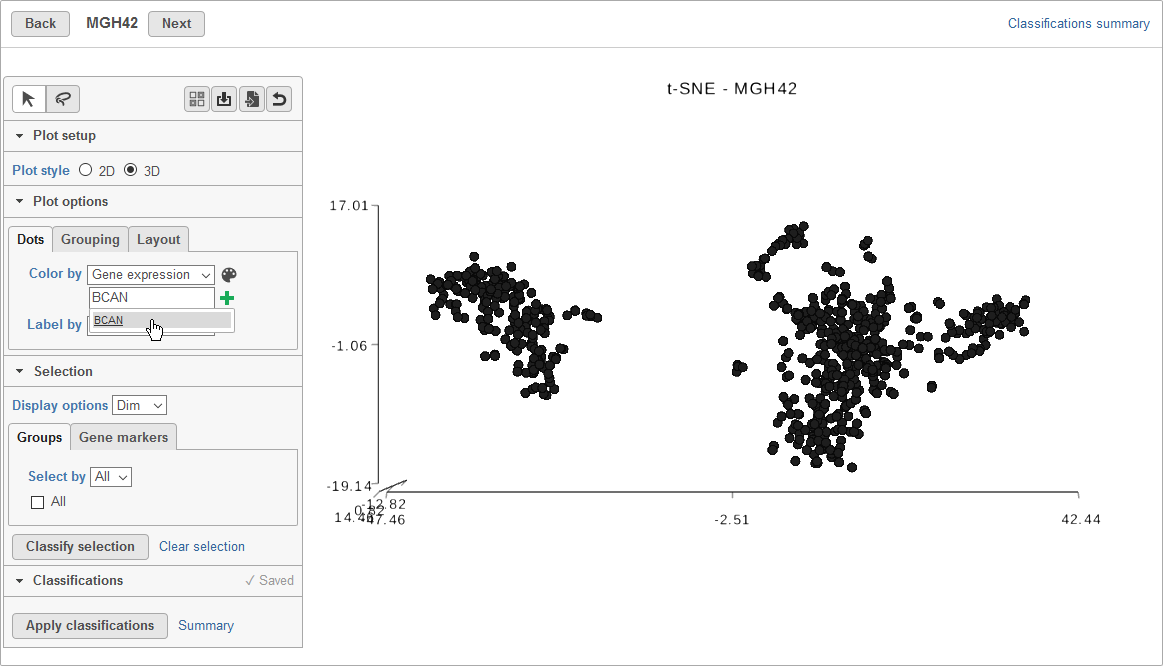
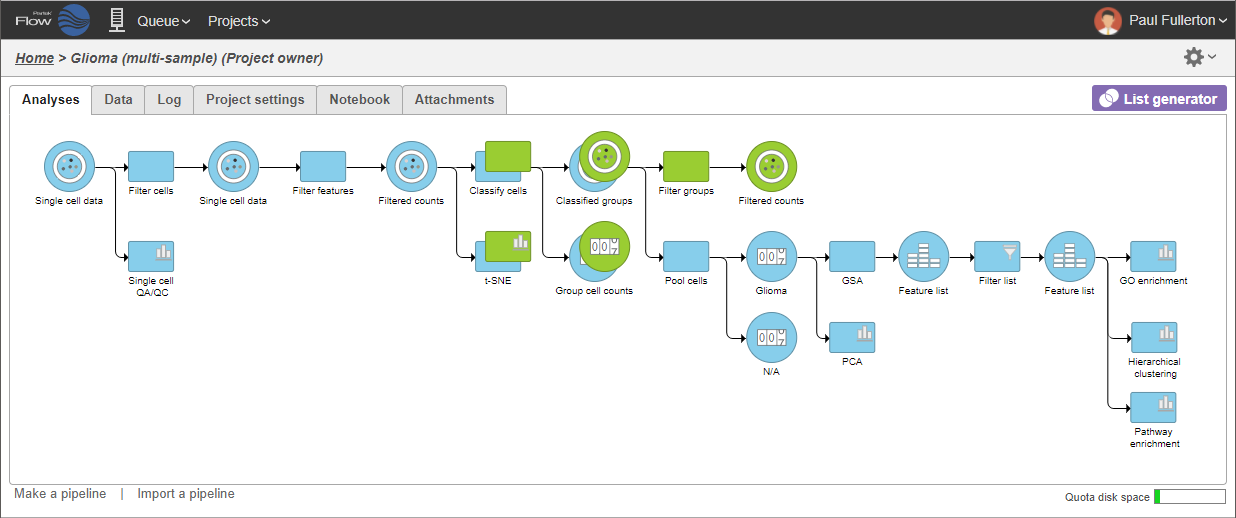
Page: Classify cells from multiple samples using t-SNE
|
|
PNG File image2018-2-15 12:1:38.png |
85 kB |
Alex Rutkovsky |
Jul 12, 2023 07:38 |
Jul 12, 2023 07:38 |
|
Page: Process Xenium data
|
|
PNG File image2018-2-15 12:1:38.png |
85 kB |
Alex Rutkovsky |
Jul 07, 2023 11:29 |
Jul 07, 2023 11:29 |
|
Page: Start with 10x Genomics Visium fastq files
|
|
PNG File image2018-3-21 14:7:49.png |
85 kB |
Alex Rutkovsky |
Jul 12, 2023 07:38 |
Jul 12, 2023 07:38 |
|
Page: Perform Exploratory analysis
|
|
PNG File image2018-3-21 14:7:49.png |
85 kB |
Alex Rutkovsky |
Jul 07, 2023 11:29 |
Jul 07, 2023 11:29 |
|
Page: View tissue images
|
|
PNG File gsa_advanced_options_lowest_average_coverage.png |
85 kB |
Cherry Ignacio |
Jan 12, 2018 13:47 |
Jan 12, 2018 14:07 |
|
Page: Single Cell Scaling
|
|
PNG File gsa_advanced_options_lowest_average_coverage.png |
85 kB |
Xiaowen Wang |
Dec 28, 2018 11:04 |
Dec 28, 2018 11:05 |
|
Page: Mapping error statistics
|
|
PNG File gsa_advanced_options_lowest_average_coverage.png |
85 kB |
admin |
Jun 09, 2016 10:18 |
Jul 19, 2016 14:26 |
|
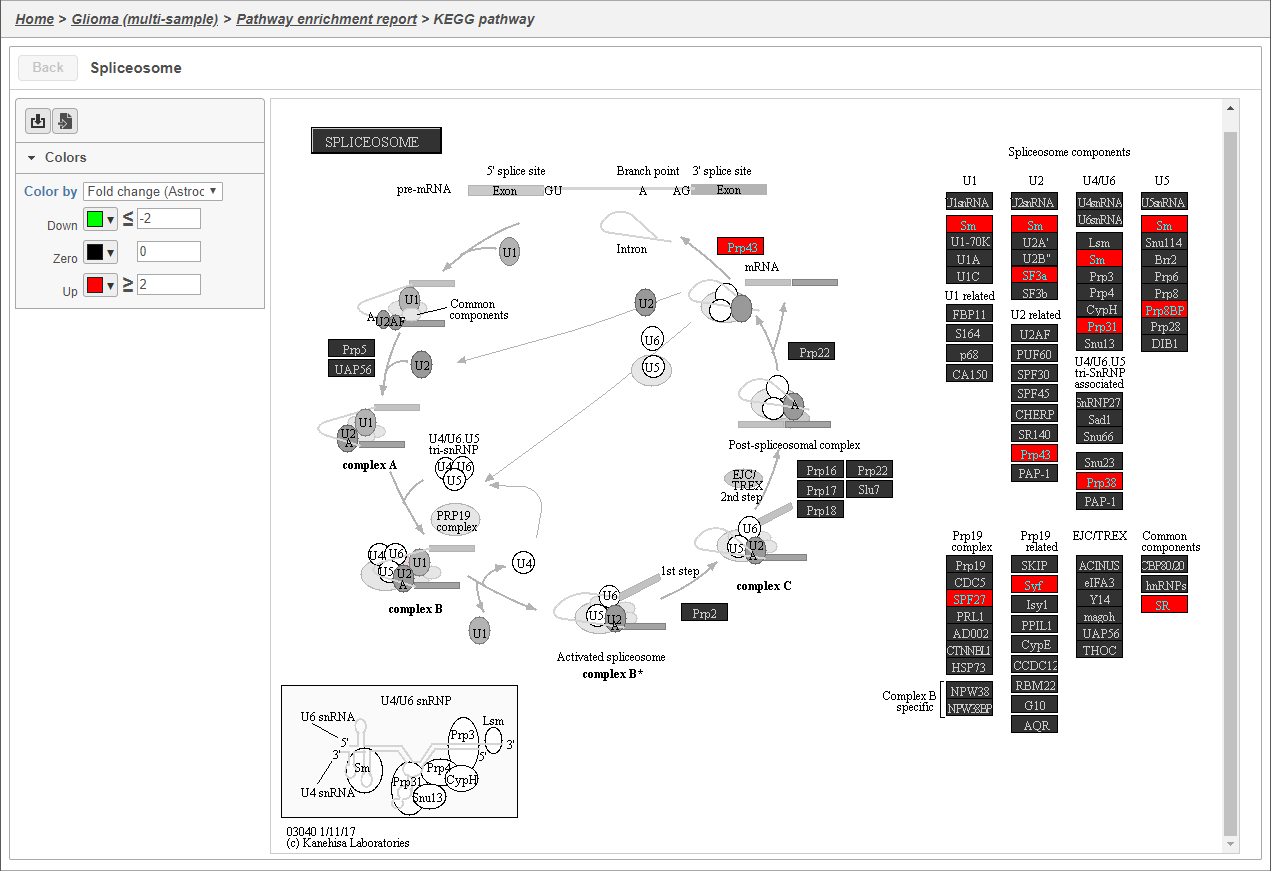
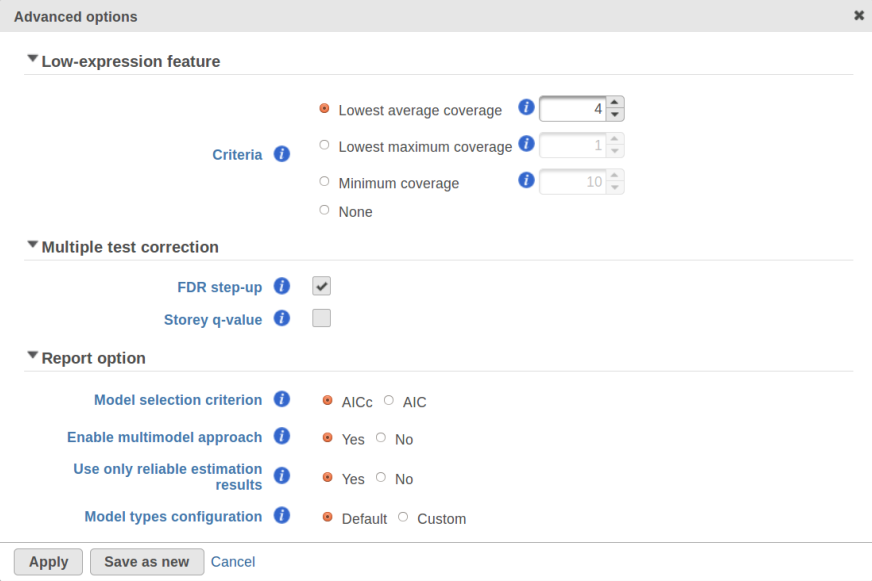
Page: Gene-specific Analysis
|
|
PNG File image2019-8-29_15-38-4.png |
85 kB |
Paul Fullerton |
Aug 29, 2019 15:38 |
Aug 29, 2019 15:38 |
|
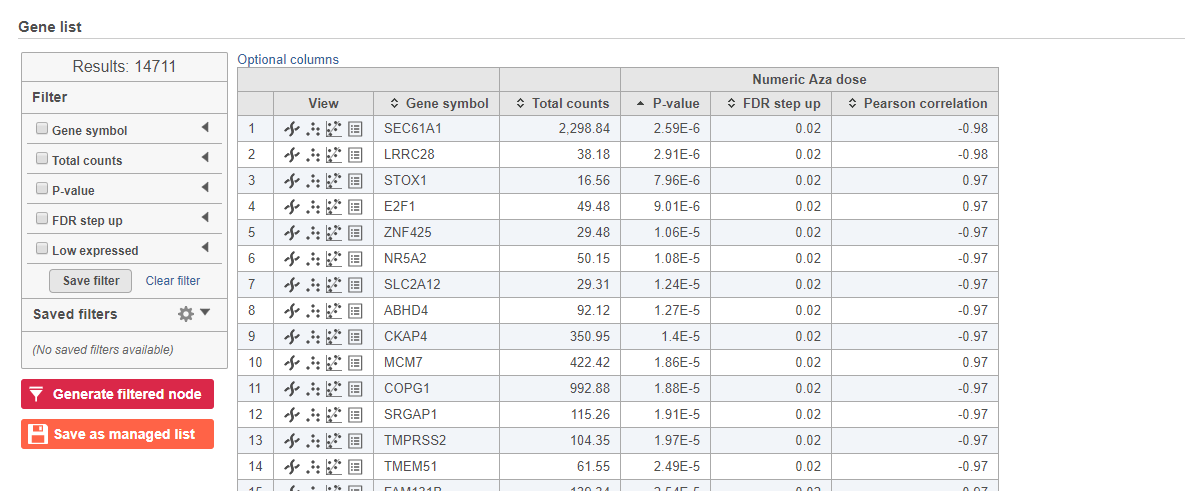
Page: Correlation analysis
|
|
PNG File Screenshot 2023-09-25 at 10.27.47.png |
85 kB |
Matteo Luberti |
Sep 25, 2023 04:27 |
Sep 25, 2023 04:27 |
|
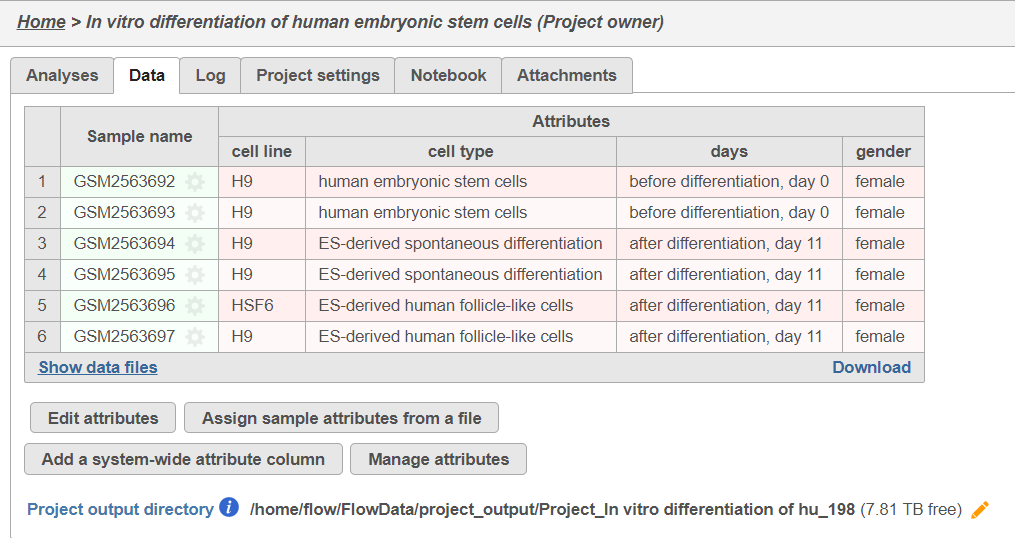
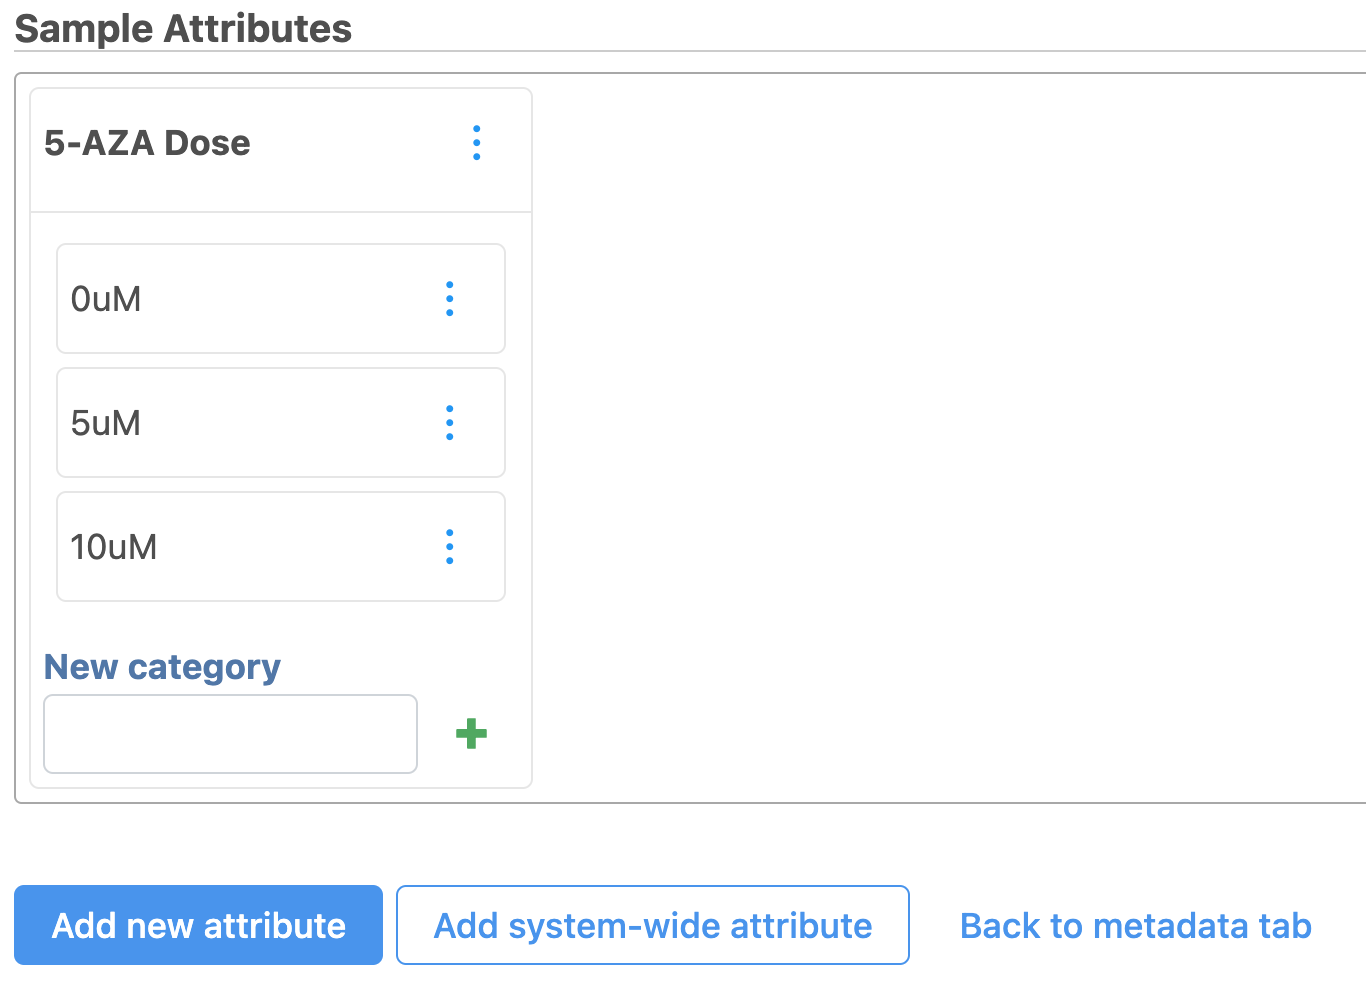
Page: Adding sample attributes
|
|
PNG File image2023-12-12_11-48-27.png |
85 kB |
Alex Rutkovsky |
Dec 12, 2023 10:48 |
Dec 12, 2023 10:48 |
|
Page: Spatial data analysis steps
|
|
PNG File image2018-3-21 14:19:1.png |
85 kB |
Paul Fullerton |
Mar 21, 2018 14:19 |
Mar 21, 2018 14:19 |
|
Page: Compare expression between cell types with multiple samples
|
|
PNG File image2018-3-21 14:19:1.png |
85 kB |
Alex Rutkovsky |
Jul 12, 2023 07:38 |
Jul 12, 2023 07:38 |
|
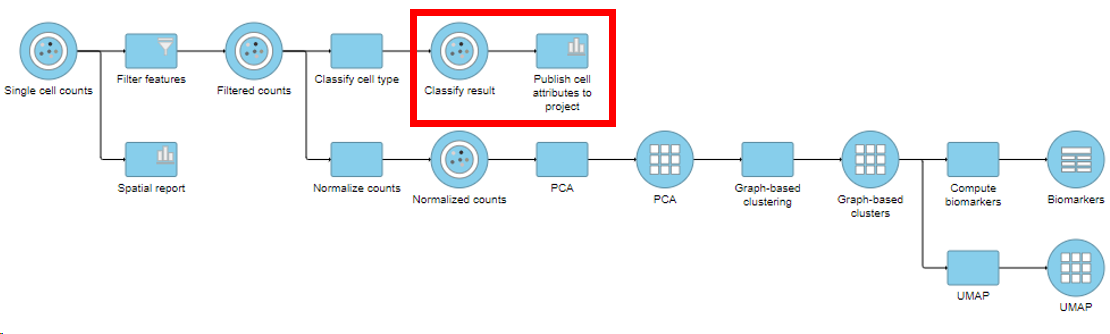
Page: Make comparisons using Compute biomarkers and Biological interpretation
|
|
PNG File image2018-3-21 14:19:1.png |
85 kB |
Alex Rutkovsky |
Jul 07, 2023 11:29 |
Jul 07, 2023 11:29 |
|
Page: Spatial data analysis steps
|
|
PNG File image2023-10-13_16-2-9.png |
85 kB |
Alex Rutkovsky |
Oct 13, 2023 15:02 |
Oct 13, 2023 15:02 |
|
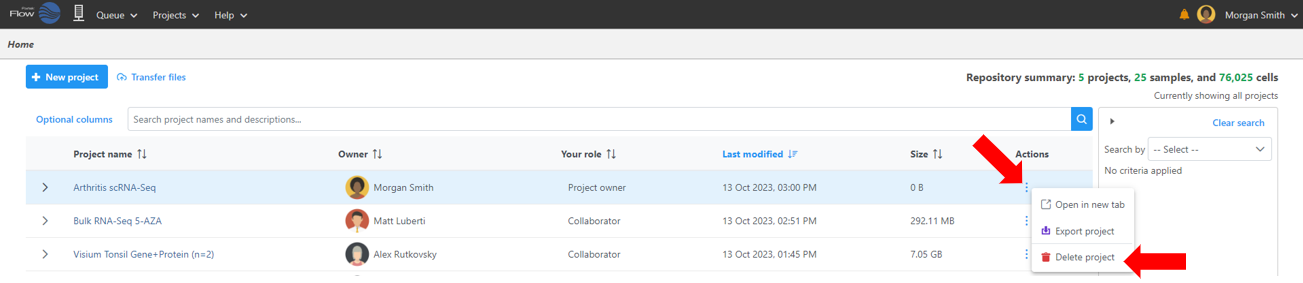
Page: Project Management
|
|
PNG File image2022-7-6_17-17-0.png |
85 kB |
Xiaowen Wang |
Jul 06, 2022 17:17 |
Jul 06, 2022 17:17 |
|
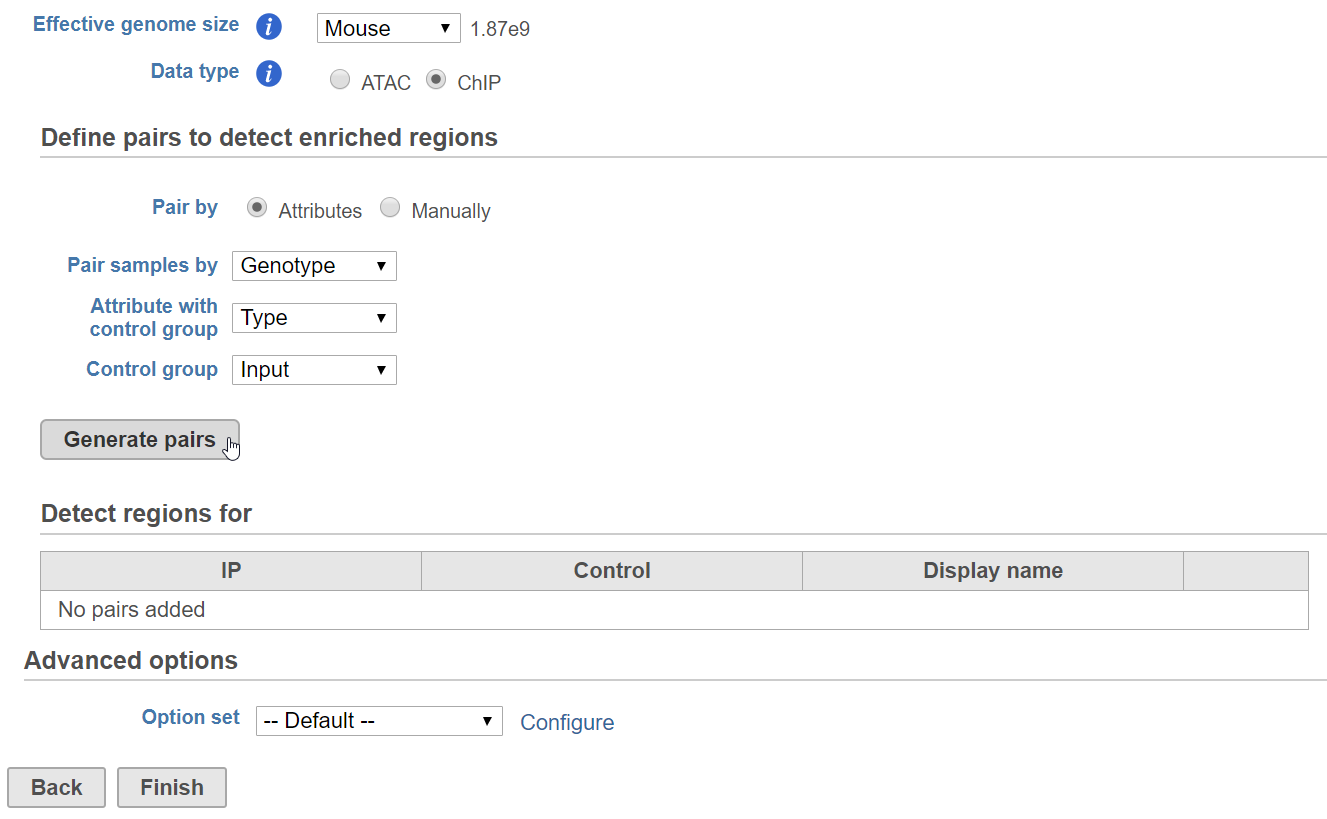
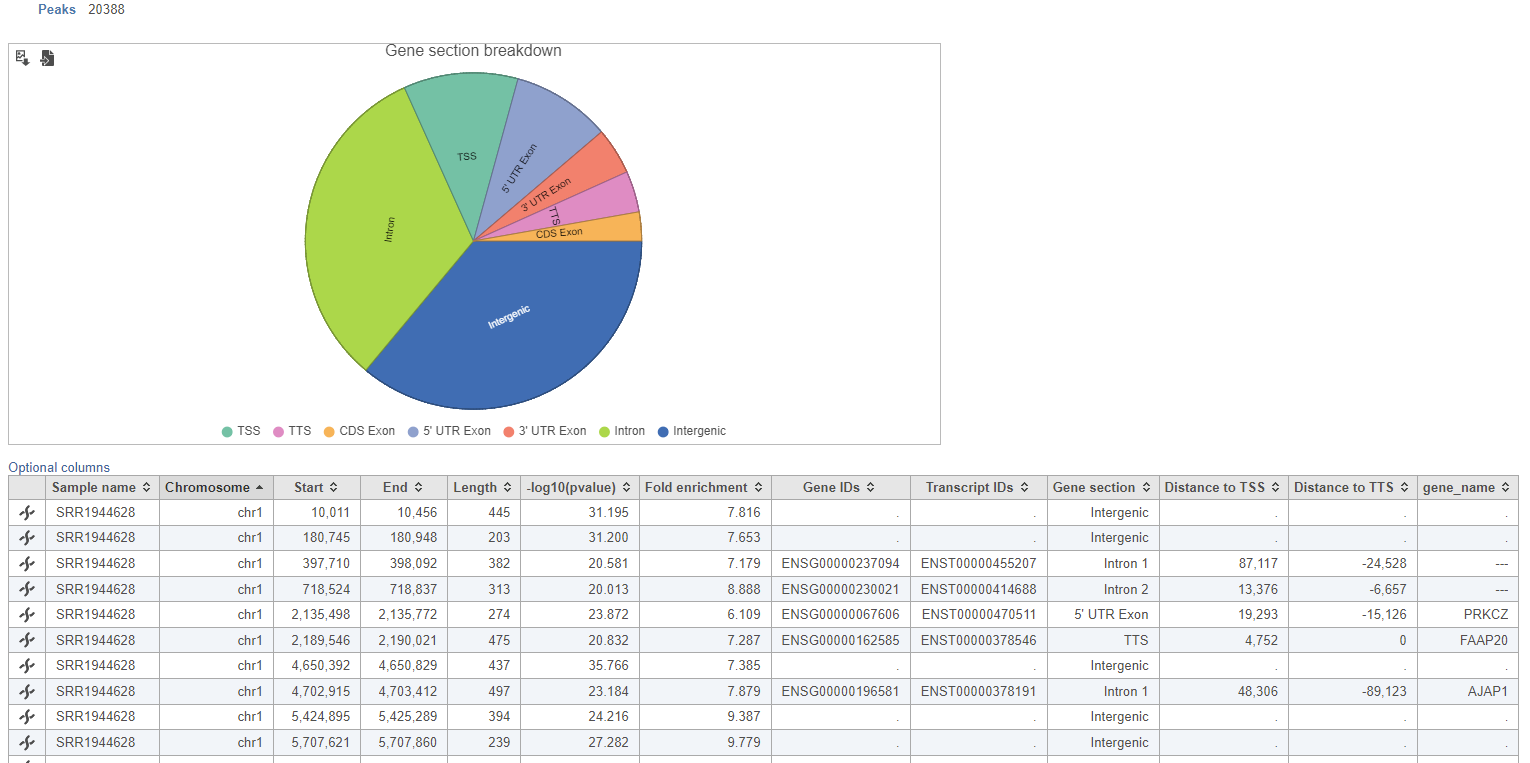
Page: Annotate Peaks
|