What is Correlation analysis?
Correlation analysis is a statistical test that lets you rank features by their correlation with numeric attributes using Pearson (linear), Spearman (rank), or Kendall (tau) correlation.
Running Correlation analysis
We recommend normalizing you data prior to running Correlation analysis, but it can be invoked on any counts data node.
- Click the counts data node
- Click the Statistics section in the toolbox
- Click Correlation
- Choose the method to use for correlation analysis (Figure 1)
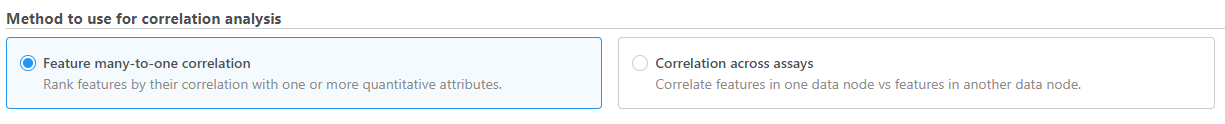 Figure 1. Choose the method to use for correlation analysis
Feature many-to-one correlation
When multiple numeric factors are added, the correlation analysis will perform each factor with a feature in the data node independently. If you are interested in particular features, use the Search features box to add one or more.
- Select the factors and interactions to include in the statistical test (Figure 2).
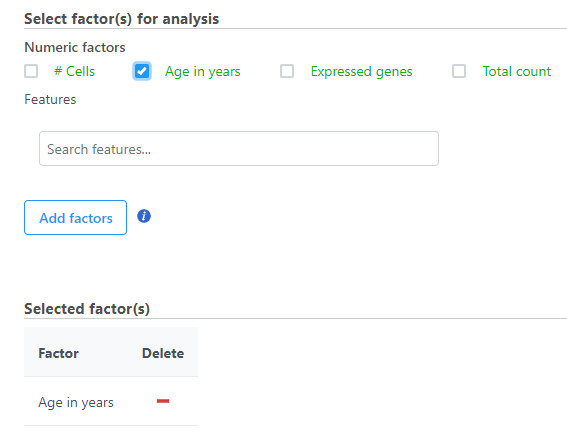 Figure 2. Select the factors and interactions to include
- Click Next
- It is optional to apply a lowest coverage filter or configure the advanced settings
- Click Finish to run
Correlation analysis produces a Correlation data node; double-click to open the task report (Figure 3) which is similar to the ANOVA/LIMMA-trend/LIMMA-voom and GSA task reports and includes a table with features on rows and statistical results on columns.
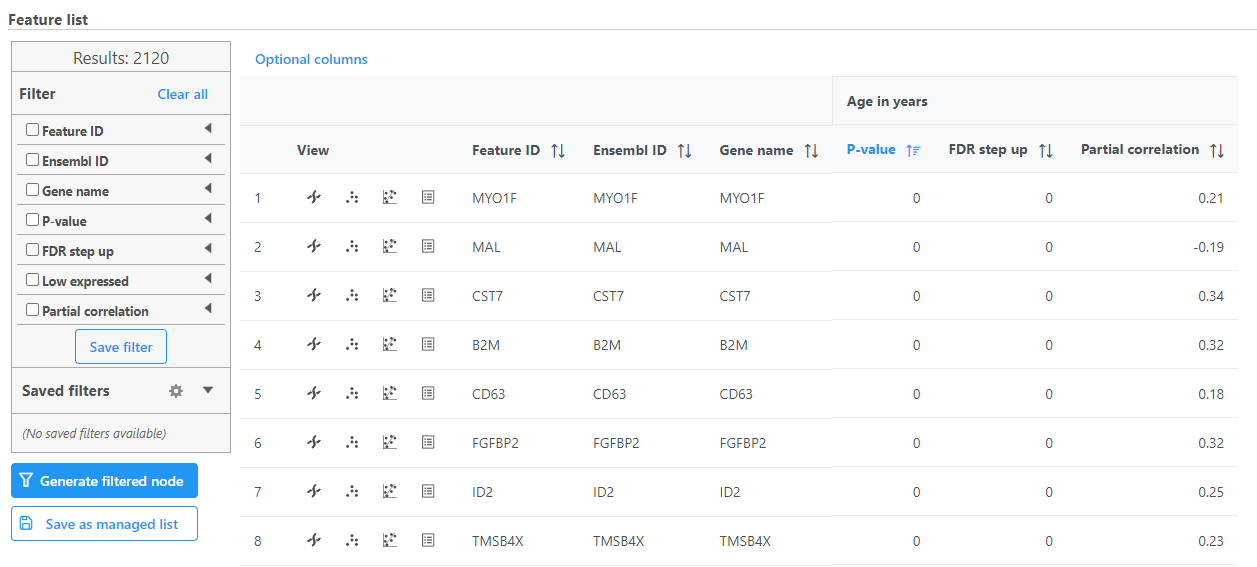 Figure 3. Correlation analysis task report
Each numeric attribute includes p-value, adjusted p-value columns (FDR step up and/or Storey q-value if included), and a partial correlation value. Each interaction will have p-value and adjusted p-value columns (FDR step up and/or Storey q-value if included).
Figure 3. Correlation analysis task report
Each numeric attribute includes p-value, adjusted p-value columns (FDR step up and/or Storey q-value if included), and a partial correlation value. Each interaction will have p-value and adjusted p-value columns (FDR step up and/or Storey q-value if included).
Each feature includes ![]() chromosome view,
chromosome view, ![]() dot plot,
dot plot, ![]() correlation plot, and extra details
correlation plot, and extra details ![]() buttons in the View column.
buttons in the View column.
Correlation analysis advanced options
Low value filter
Low-value filter allows you to specify criteria to exclude features that do not meet the requirements for the calculation. If there is a filter feature task performed in the upstream analysis, the default of this filter is set to None, otherwise, the default is Lowest average coverage is set to 1.
Lowest average coverage: the computation will exclude a feature if its geometric mean across all samples is below the specified value
Lowest maximum coverage: the computation will exclude a feature if its maximum across all samples is below the specified value
Minimum coverage: the computation will exclude a feature if its sum across all samples is below the specified value
None: include all features in the computation
Multiple test correction
Multiple test correction can be performed on the p-values of each comparison, with FDR step-up being the default. If you check the Storey q-value, an extra column with q-values will be added to the report.
Use only reliable estimation results
There are situations when a model estimation procedure does not fail outright but still encounters some difficulties. In this case, it can even generate p-value and fold change on the comparisons, but they are not reliable, i.e. they can be misleading. Therefore, the default of Use only reliable estimation results is set Yes.
Correlation type
Sets the type of correlation used to calculate the correlation coefficient and p-value. Options are Pearson (linear), Spearman (rank), Kendall (tau). Default is Pearson (linear).
Correlation across assays
Correlation across assays should be used to perform correlation analysis across different modalities (e.g. ATAC-Seq enriched regions vs. RNA-Seq expression) for multiomics data analysis.
- Select the data node to be compared to the node that the task has been invoked from using the Select data node button
- Modify any parameters (Figure 4)
- Click Finish
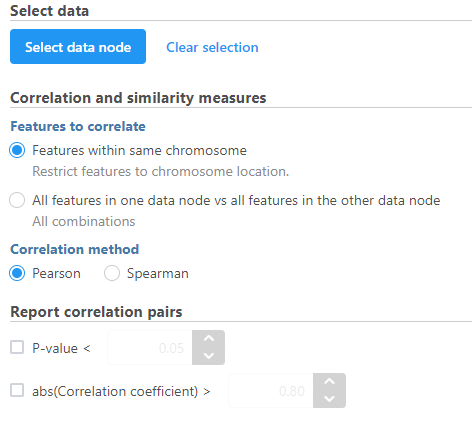 Figure 4. Correlation across assays can be performed with multiomic data
Correlation across assays analysis options
Correlation and similarity measures
Features within same chromosome: this option will restrict feature comparison to the chromosome location
All features in one data node vs all features in the other data node: this option will perform the comparison using all combinations without location constraint
Pearson: linear correlation: 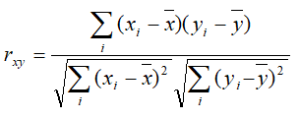
Spearman: rank correlation: 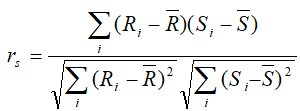
Report correlation pairs
P-value: select a cut-off value for significance and only those pairs that meet the criteria will be reported
abs(Correlation coefficient): select a cutoff for reporting the absolute value of the correlation coefficient (represented by the symbol r) where a perfect relationship is 1 and no relationship is 0
Correlation across assays produces a Correlation pair list data node; double-click to open the table (Figure 5). The table can be sorted and filtered using the column titles.
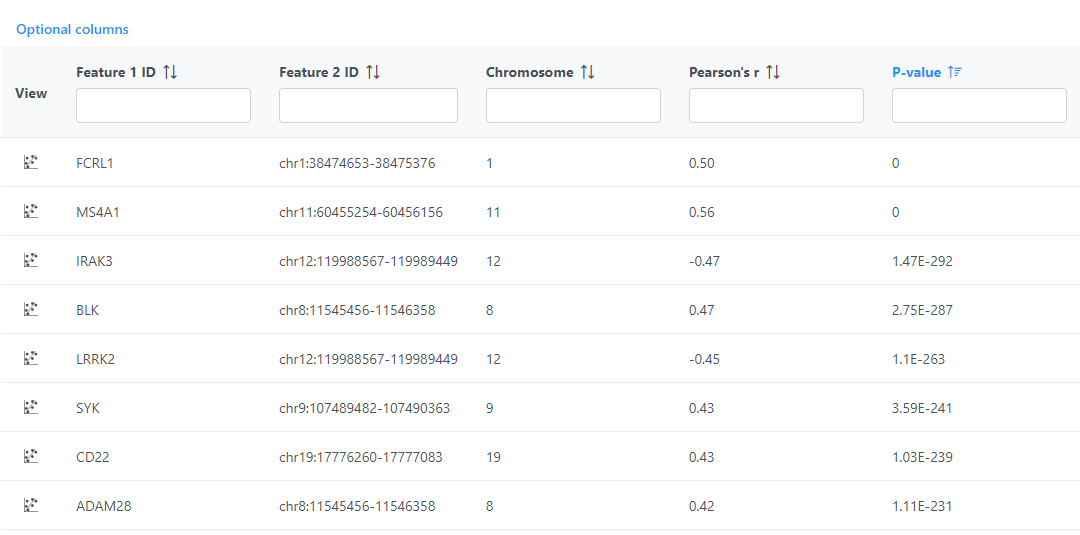 Figure 5. Correlation across assays table
Click
Figure 5. Correlation across assays table
Click ![]() View correlation plot to open the correlation plot for each comparison. Scroll to the bottom of the table to
View correlation plot to open the correlation plot for each comparison. Scroll to the bottom of the table to  download the full table report.
Additional Assistance
If you need additional assistance, please visit our support page to submit a help ticket or find phone numbers for regional support.


| Your Rating: |
|
Results: |

|
13 | rates |
Overview
Content Tools