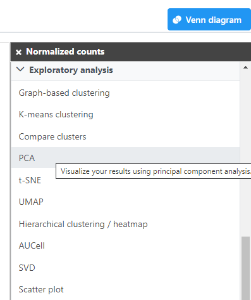
Use Principle Components Analysis (PCA) to reduce dimensions
- Click the Normalized counts data node
- Expand the Exploratory analysis section of the task menu
- Click PCA
In this tutorial we will modify the PCA task parameters, to not split by sample, to keep the cells from both samples on the PCA output.
- Uncheck (de-select) the Split by sample checkbox under Grouping
- Click Finish
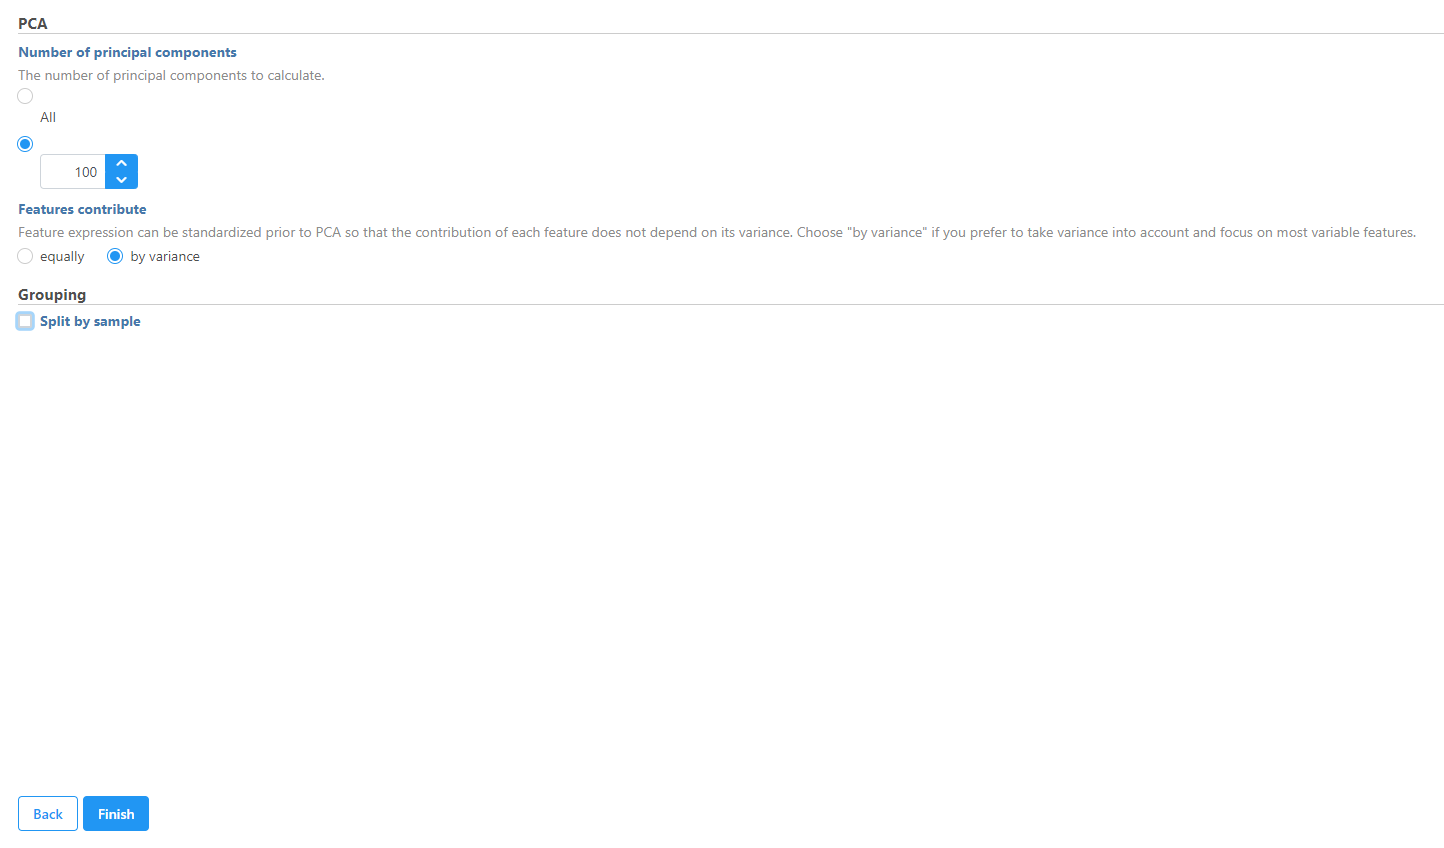
- Double-click the circular PCA node to view the results
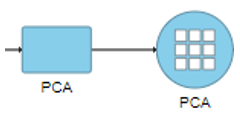
From this PCA node, further exploratory tasks can be performed (e.g. t-SNE, UMAP, and Graph-based clustering).
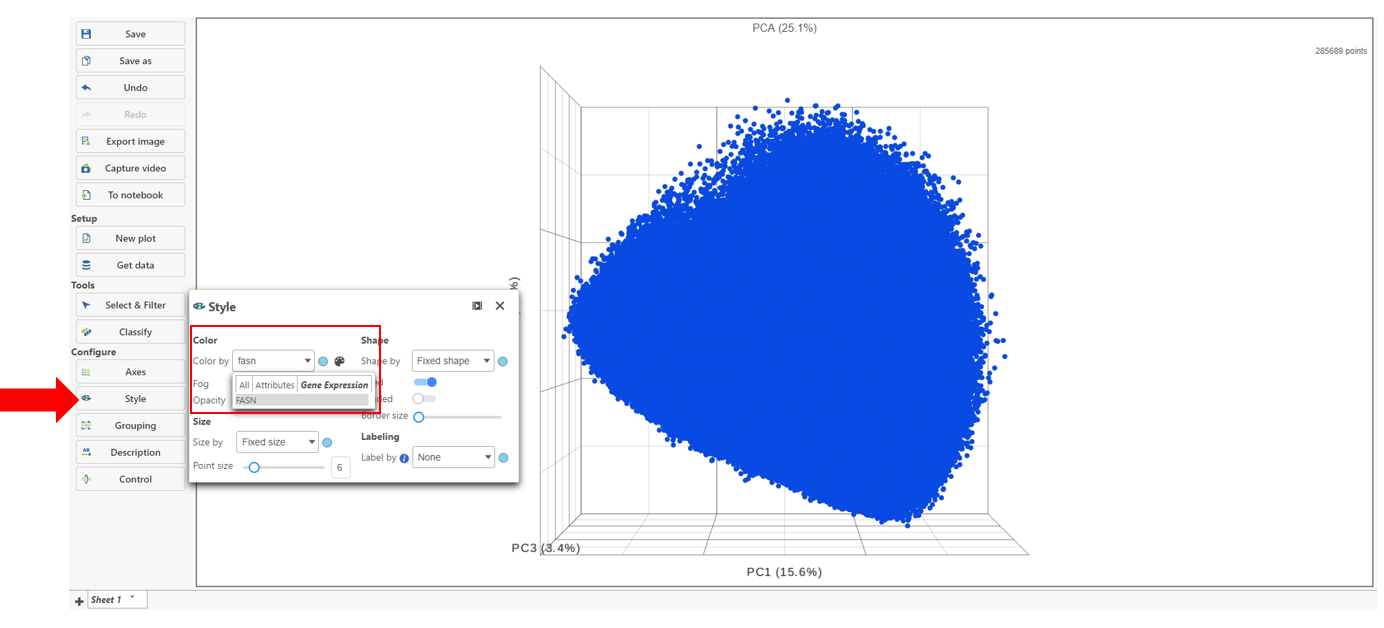
Classify cells based on a marker for expression
- Choose Style under Configure
- Color by and search for fasn by typing the name
- Select FASN from the drop-down
The colors can be customized by selecting the color palette then using the color drop-downs as shown below.
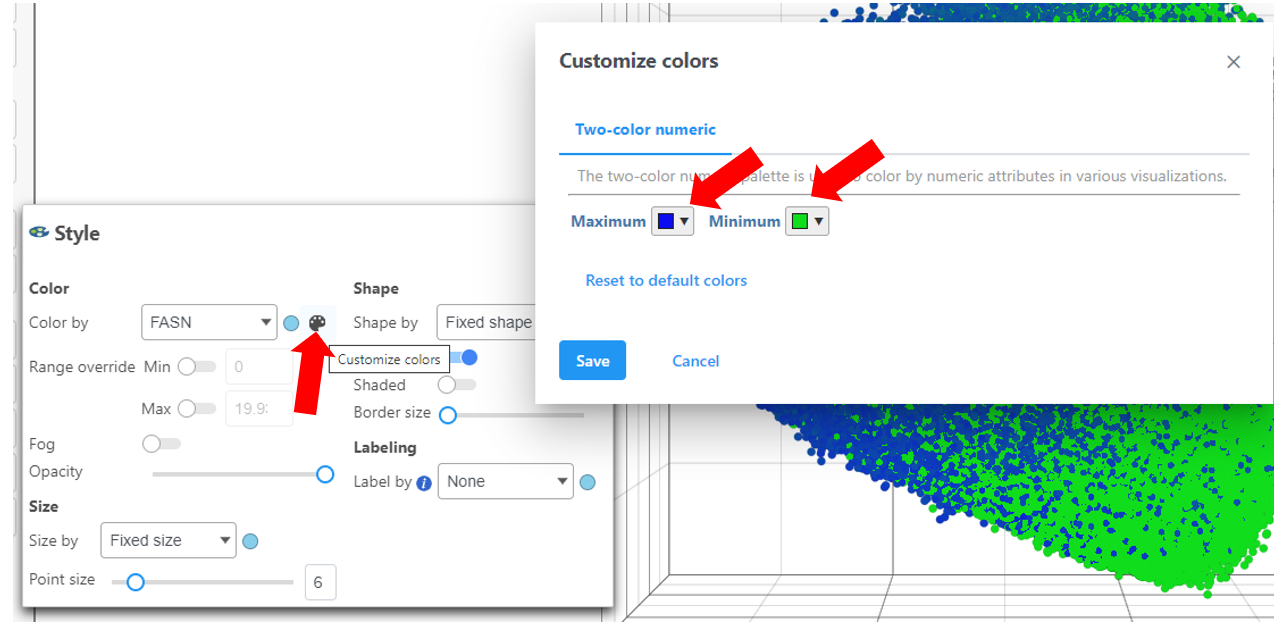
Ensure the colors are distinguishable such as in the image above using a blue and green scale for Maximum and Minimum, respectively.
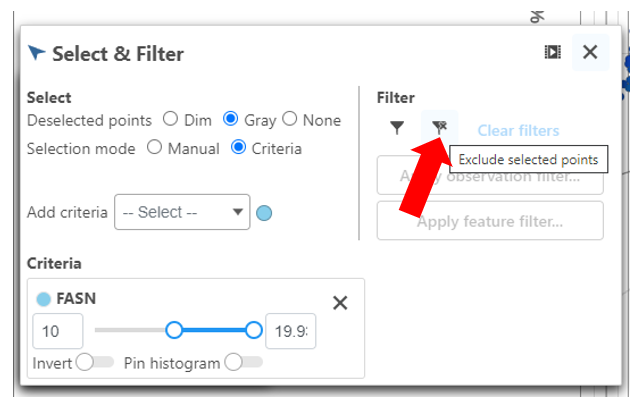
- Click FASN in the legend to make it draggable (pale green background) and continue to drag and drop FASN to Add criteria within the Select & Filter Tool
- Hover over the slider to see the distribution of FASN expression
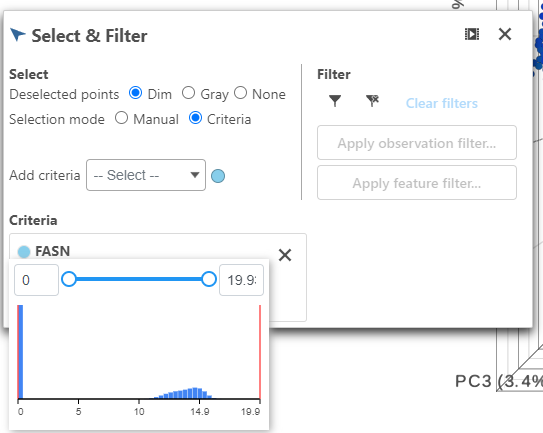
Multiple gene thresholds can be used in this type of classification by performing this step with multiple markers.
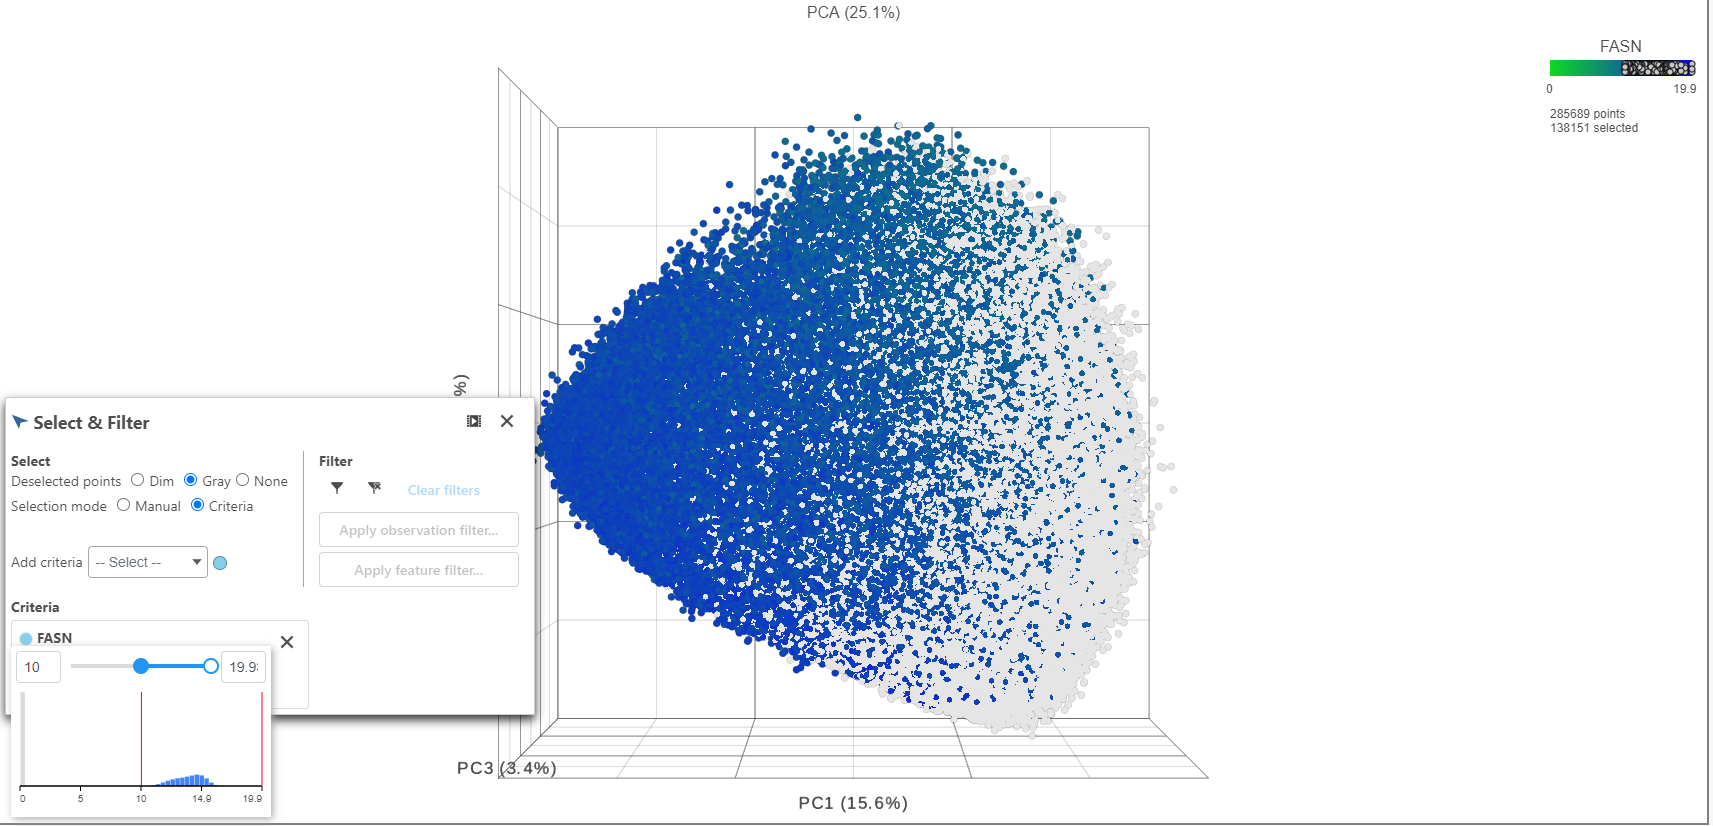
- Drag the slider to select the population of cells expressing high FASN (the cutoff here is 10 or the middle of the distribution).
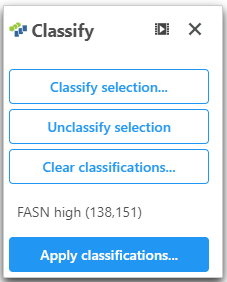
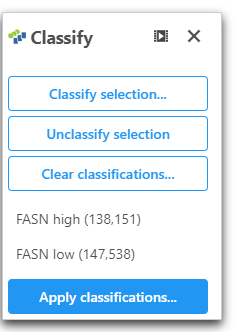
- Click Classify under Tools
- Click Classify selection
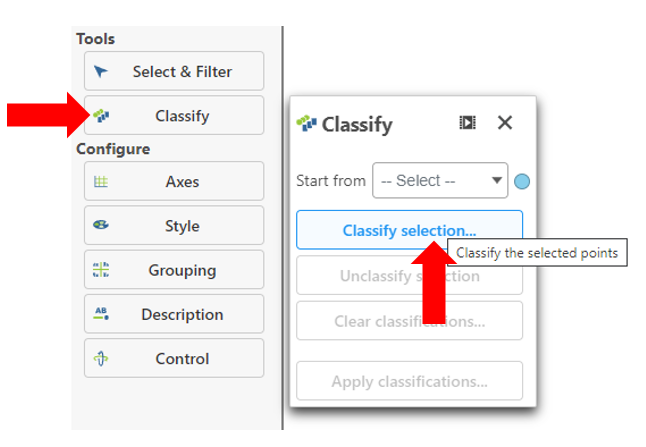
- Give the classification a name "FASN high"
- Under the Select & Filter tool, choose Filter to exclude the selected cells
Exit all Tools and Configure options
- Click the "X" in the right corner
- Use the rectangle selection mode on the PCA to select all of the points on the image
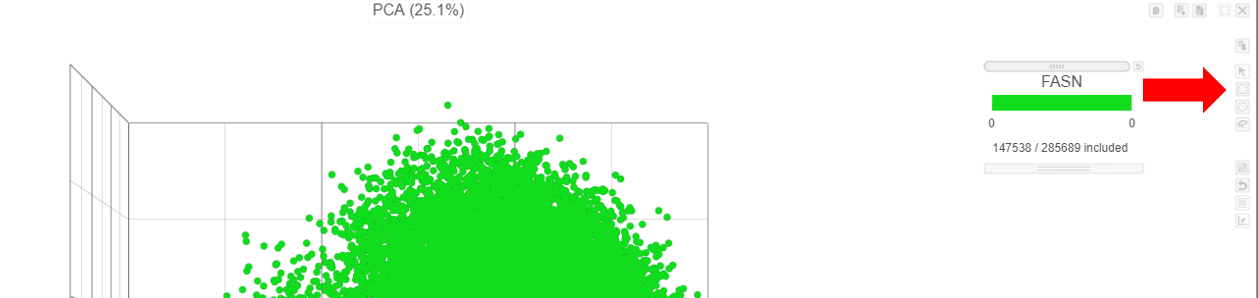
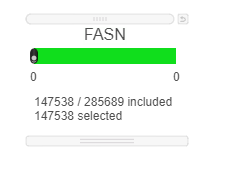
This results in 147538 cells selected.
- Open Classify
- Click Classify selection and name this population of cells "FASN low"
- Click Apply classifications and give the classification a name "FASN expression"
Now we will be able to use this classification in downstream applications (e.g. differential analysis).
Additional Assistance
If you need additional assistance, please visit our support page to submit a help ticket or find phone numbers for regional support.


| Your Rating: |
|
Results: |

|
1 | rates |
Overview
Content Tools