The fastq files are not pre-processed. The steps covered here will show you how to import and pre-process of the Visium Spatial Gene Expression data with brightfield and fluorescence microscope images.
Add files to the project
The sample used for this tutorial can be found in the 10x Genomics Datasets. We will use the Control, replicate 1 mouse brain sample.
- Choose the 10x Genomics Visium fastq import format
- Click Next

If you have not transferred files to the server already, click here for more details and choose to Transfer files to the server.
- Select the fastq files in the upload folder used for file transfer (select all sample files at one time; including R1 and R2 for each sample)
- Click Finish

The prefix used for R1 and R2 fastq files should match; one sample is shown in this example.
The fastq files will be imported into the project as an Unaligned reads node.

Pre-processing the unaligned fastq files with Space Ranger
The unaligned reads must be preprocessed before proceeding with the analysis steps covered here: Spatial data analysis.
- From the unaligned reads node, select Space Ranger from the 10x Genomics drop-down in the toolbox.
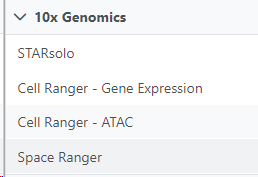
For more information about Space Ranger click here.
- Specify the type of 10x Visium assay; this tutorial uses the Visium CytAssist gene expression library as the assay type
- If you have not done so already, a Cell Ranger reference should be created
- Specify the Reference assembly
- Select the Image and Probe set files that have already been transferred to the server for all samples
- Choose visium-2-large as the Slide parameter because this Visium CystAssist sample used a 11 x 11 slide capture area
- Click Finish
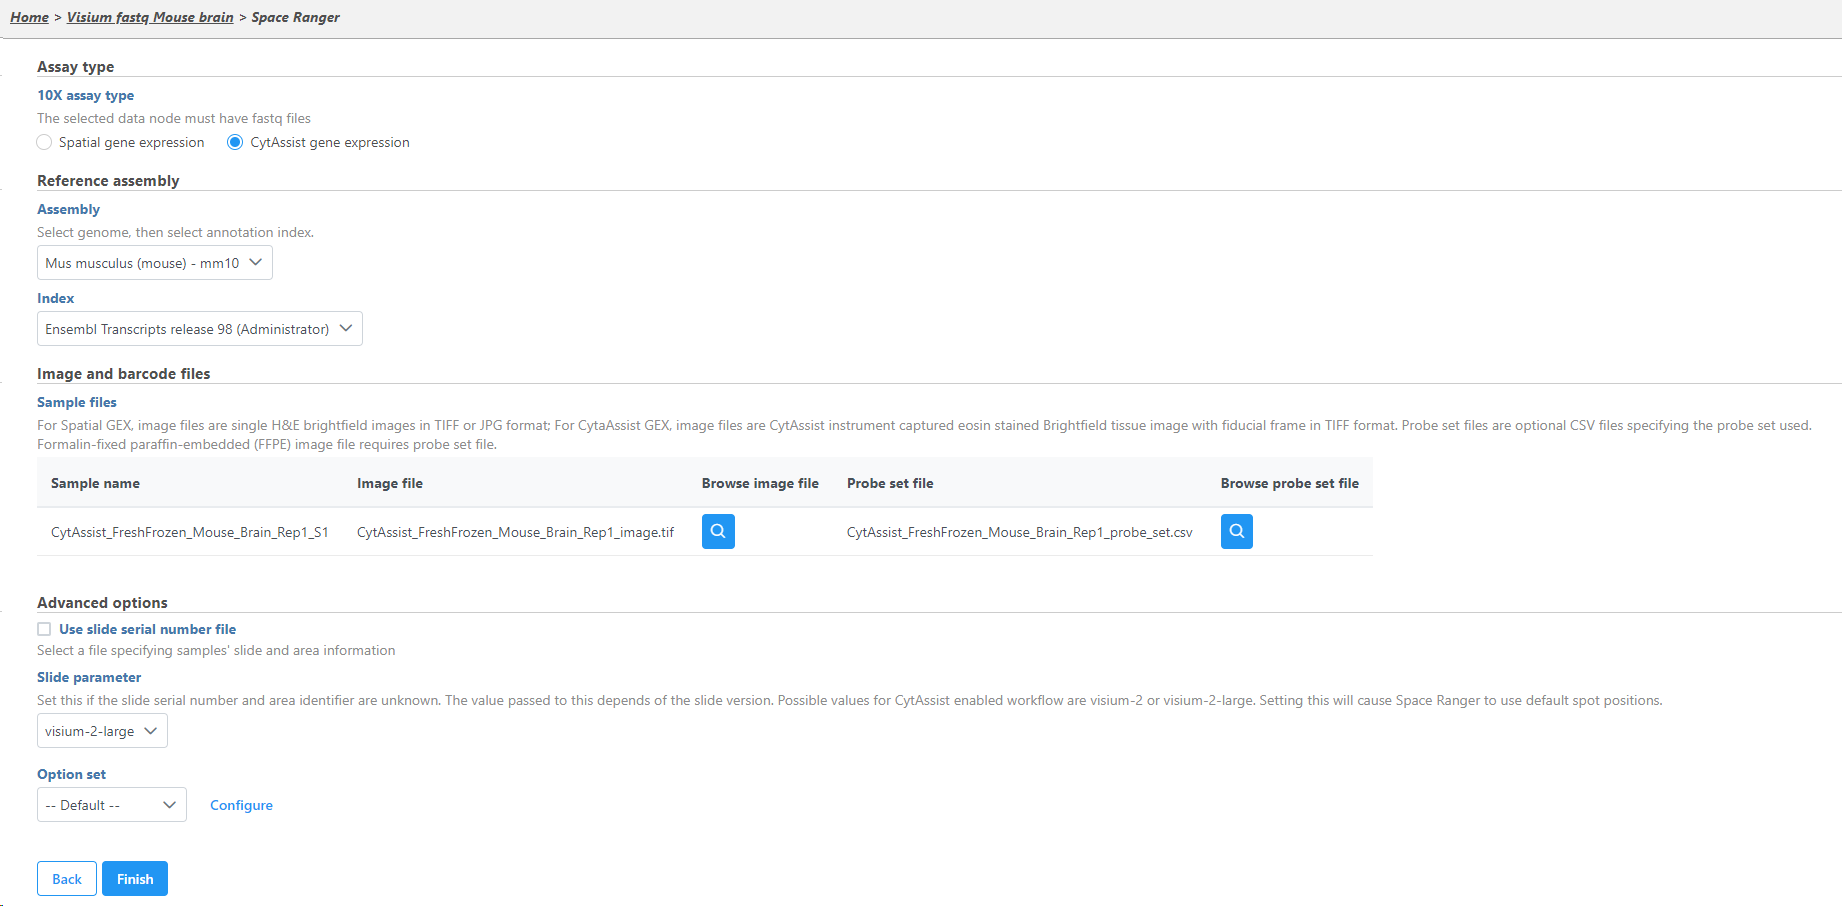
The Space Ranger task output results in a Single cell counts node.

Annotate Visium image
The tissue image must be annotated to associate the microscopy image with the expression data.
- Click the newly created Single cell counts data node
- Click the Annotation/Metadata section in the toolbox
- Click Annotate Visium image
- Click on the Browse button to open the file browser and point to the file <project-name>_spatial.zip, created by the Space Ranger task
- Click Finish

Select the zipped image folder for each sample. The image zip file should contains 6 files including image files and tissue position text file with a scale factor json file. The setup page shows the sample table (one sample per row).
You can find the location of the <project-name>_spatial.zip file using the following steps. Select the Space Ranger task node (i.e. the rectangle) and then click on the Task Details (toolbox). Click on the Output files link to open the page with the list of files created by the Space Ranger task. Mouse over any of the files to see the directory in which the file is located. The figure below shows the path to the .zip file which is required for Annotate Visium image.
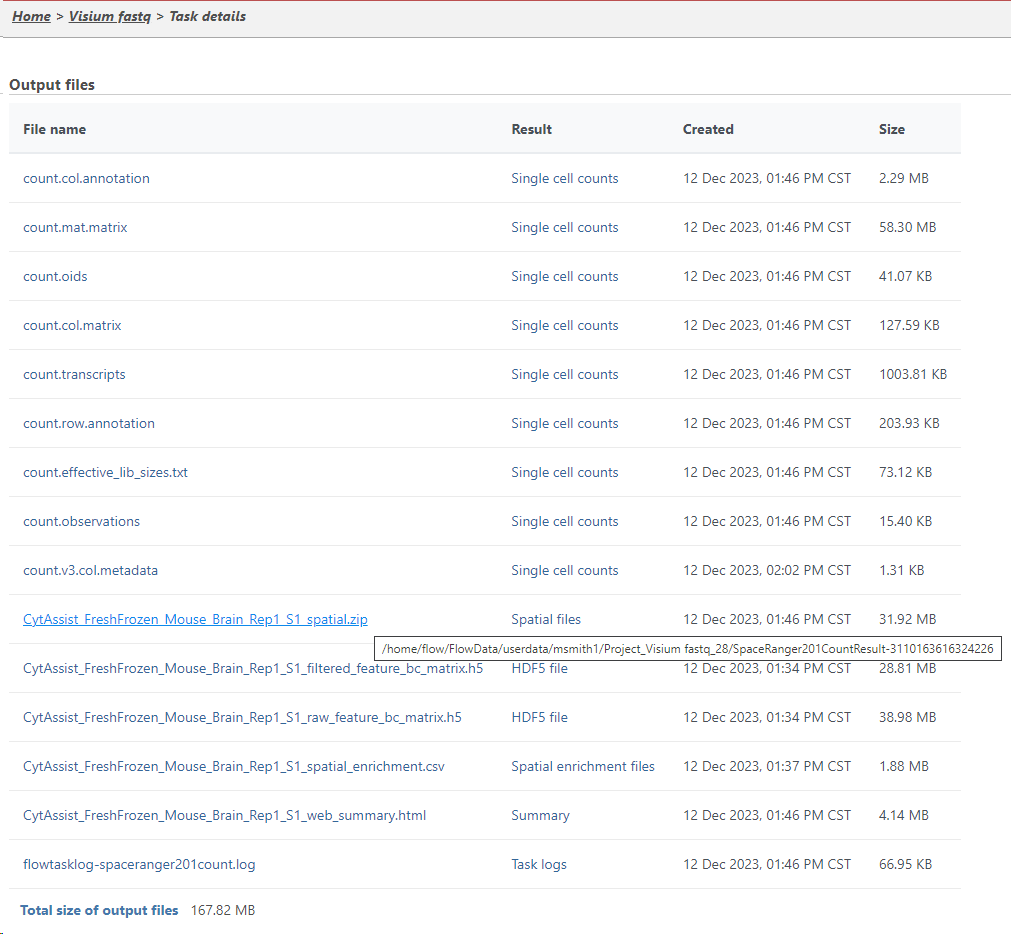
Mousing over a file on the Output files page shows a balloon with the file location.
A new data node, Annotated counts, will be generated.

The Annotated counts node is Split by sample. This means that any tasks performed from this node will also be split by sample. Invoke tasks from the Single cell counts node to combine samples for analyses.
Annotate Visium image task creates a new node, Annotated counts. Double click on the Annotated counts node to invoke the Data Viewer showing data points overlaid on top of the microscopy image.

Data Viewer session as a result of opening an Annotated counts data node. Each data point is a tissue spot.
Proceed with analysis from the Single cell counts node. Click here to learn about viewing the multiple tissue images in the Data Viewer.
Additional Assistance
If you need additional assistance, please visit our support page to submit a help ticket or find phone numbers for regional support.


| Your Rating: |
|
Results: |

|
0 | rates |
Overview
Content Tools