Introduction
When visualizing high throughput data, for example via a 2D or 3D scatter plot, to display the distance of the observations on NGS observations where each observation has thousands of measurements, dimension reduction techniques need to be used. One can apply Principle Component Analysis, t-Distributed Stochastic Neighbor Embedding etc. Those techniques convert data from high dimensional space to lower dimensional space conveying similar information. When information represented in lower dimensional space is not exactly the same as the one from higher dimensional space data, error is generated. In the advanced option settings of dialogs like PCA, t-SNE, there is Generate mapping error statistics option, checking this button will output the mapping error on the plot.
Sammon's mapping error
The distance between the ith and jth data points in the original space is denoted by d*ij, and the distance between the projections in lower dimensional space is denoted by dij. Sammon's mapping error (1) is calculated as the follows:

To avoid emphasizing small distance, quadratic mapping error is also generated according to the formula:
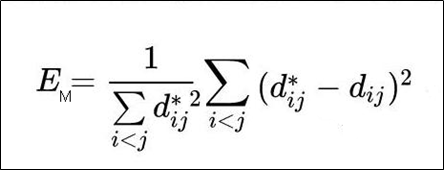
Both error measures range from zero to plus infinity.
References
[1] Sammon JW, 1969, A nonlinear mapping for data structure analysis
Additional Assistance
If you need additional assistance, please visit our support page to submit a help ticket or find phone numbers for regional support.


| Your Rating: |
|
Results: |

|
26 | rates |
Overview
Content Tools