| Name
|
Size
|
Creator |
Creation Date
|
Last Modification Date
|
Labels |
Attached To |
|
PNG File 2017-09-01 16_36_10-RNA-Seq Tutorial - Partek Flow… |
61 kB |
Paul Fullerton |
Sep 01, 2017 16:36 |
Sep 01, 2017 16:36 |
|
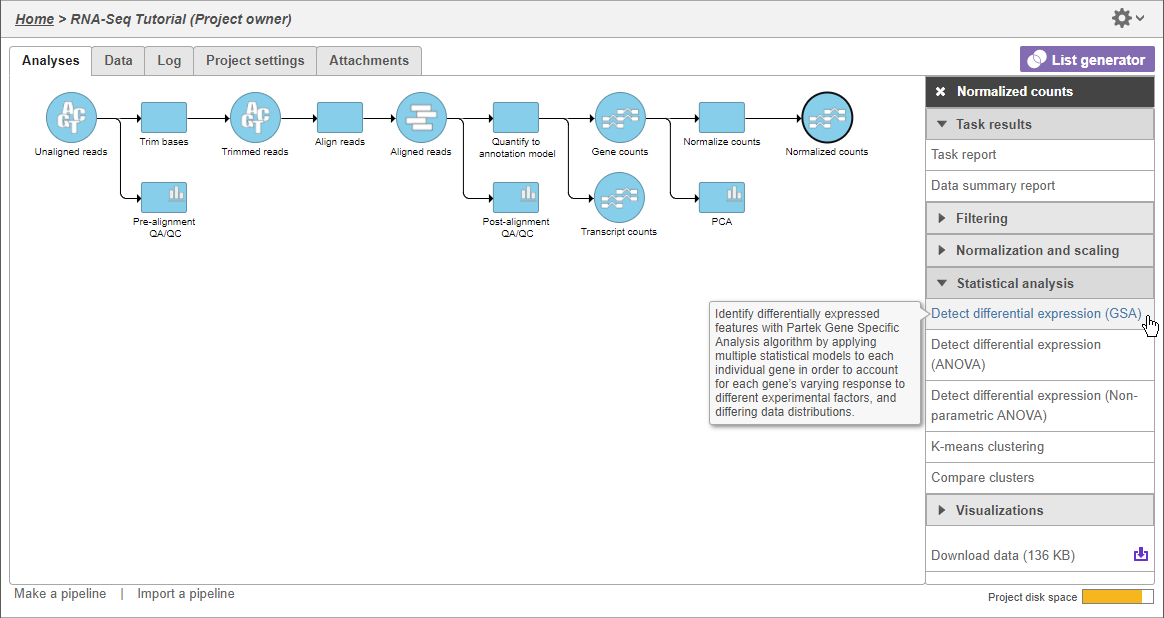
Page: Performing differential expression analysis with DESeq2
|
|
PNG File image2018-4-4 9:30:2.png |
61 kB |
Paul Fullerton |
Apr 04, 2018 09:30 |
Apr 04, 2018 10:19 |
|
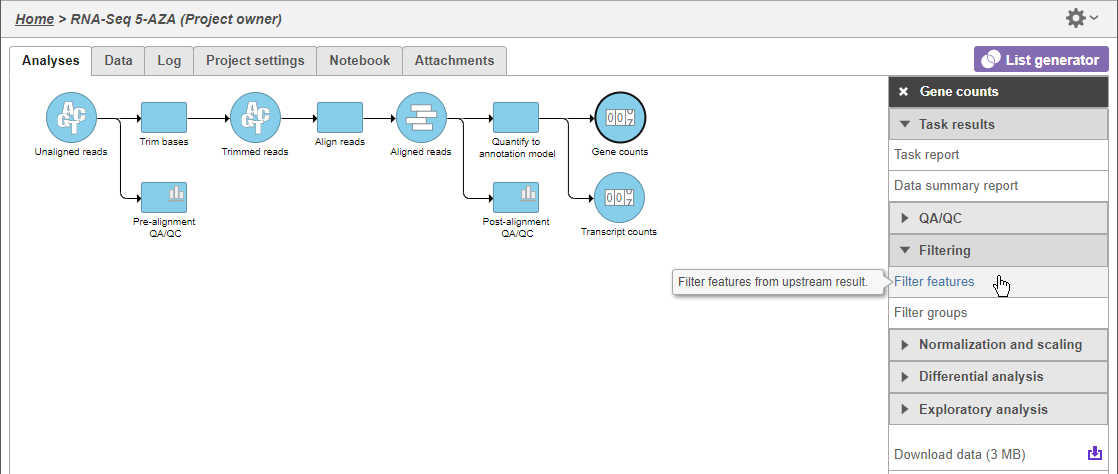
Page: Filtering features
|
|
PNG File image2018-4-4 9:30:5.png |
61 kB |
Paul Fullerton |
Apr 04, 2018 09:30 |
Apr 04, 2018 10:19 |
|
Page: Filtering features
|
|
PNG File unaligned_to_aligned_nodes_delete.png |
60 kB |
admin |
Jun 10, 2016 11:37 |
Jul 18, 2016 16:36 |
|
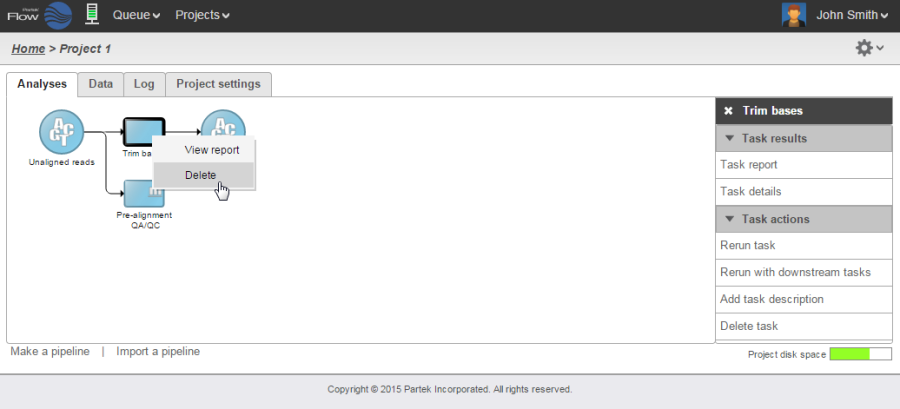
Page: The Analyses Tab
|
|
PNG File datatab_blank_project_nosamples.png |
60 kB |
Melissa del Rosario |
Sep 26, 2016 18:24 |
Sep 28, 2016 10:59 |
|
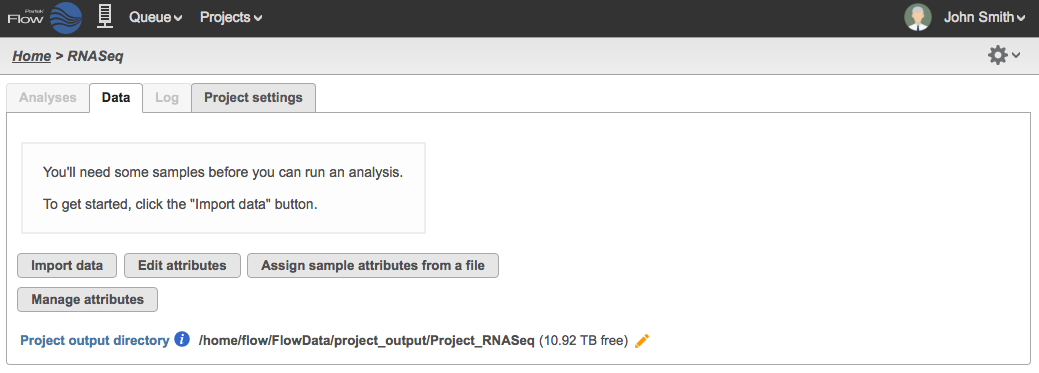
Page: Sample Table from a Text File
|
|
PNG File image2017-12-29 14:59:26.png |
60 kB |
Alex Rutkovsky |
Jul 12, 2023 07:38 |
Jul 12, 2023 07:38 |
|
Page: Perform Exploratory analysis
|
|
PNG File image2017-12-29 14:59:26.png |
60 kB |
Alex Rutkovsky |
Jul 07, 2023 11:29 |
Jul 07, 2023 11:29 |
|
Page: View tissue images
|
|
PNG File image2018-4-4 12:5:47.png |
60 kB |
Paul Fullerton |
Apr 04, 2018 12:05 |
Apr 04, 2018 12:05 |
|
Page: Performing biological interpretation
|
|
PNG File image2023-7-21_18-31-4.png |
60 kB |
Alex Rutkovsky |
Jul 21, 2023 17:31 |
Jul 21, 2023 17:31 |
|
Page: Perform Exploratory analysis
|
|
PNG File image2023-7-19_16-26-5.png |
60 kB |
Alex Rutkovsky |
Jul 19, 2023 15:26 |
Jul 19, 2023 15:26 |
|
Page: Import 10x Genomics Xenium Analyzer output
|
|
PNG File image2018-2-15 17:30:11.png |
60 kB |
Alex Rutkovsky |
Jul 12, 2023 07:38 |
Jul 12, 2023 07:38 |
|
Page: Perform Exploratory analysis
|
|
PNG File image2018-2-15 17:30:11.png |
60 kB |
Alex Rutkovsky |
Jul 07, 2023 11:29 |
Jul 07, 2023 11:29 |
|
Page: View tissue images
|
|
PNG File dot_plot_chart_connected.png |
60 kB |
Uchenna Emechebe |
Mar 06, 2021 10:04 |
Mar 06, 2021 10:04 |
|
Page: Histograms
|
|
PNG File dot_plot_chart_connected.png |
60 kB |
admin |
May 27, 2016 16:01 |
Jul 18, 2016 16:53 |
|
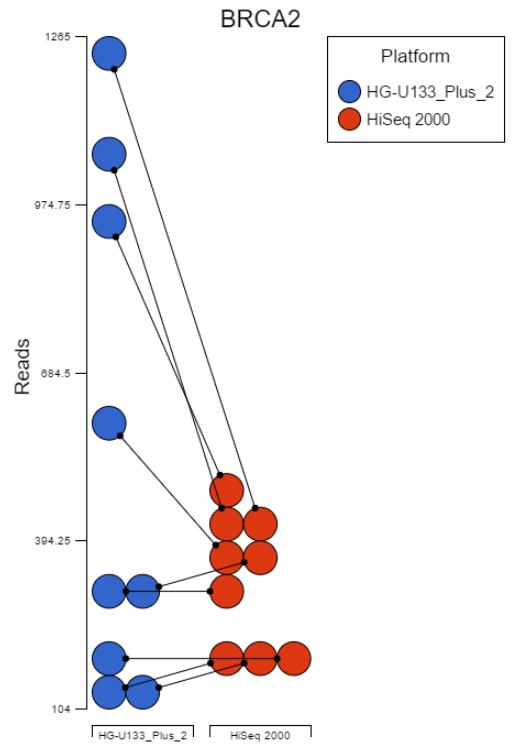
Page: Dot Plot
|
|
PNG File dot_plot_chart_connected.png |
60 kB |
Xiaowen Wang |
Jan 05, 2021 13:13 |
Jan 05, 2021 13:13 |
|
Page: Pie Chart
|
|
PNG File dot_plot_chart_connected.png |
60 kB |
Xiaowen Wang |
Jan 21, 2019 15:22 |
Jan 21, 2019 15:22 |
|
Page: Sources of variation plot
|
|
PNG File image2018-11-8 15:24:19.png |
60 kB |
Paul Fullerton |
Nov 08, 2018 15:24 |
Nov 08, 2018 15:24 |
|
Page: Analyzing Single Cell RNA-Seq Data
|
|
PNG File system_resources.png |
60 kB |
admin |
Jun 09, 2016 09:33 |
Jul 19, 2016 13:05 |
|
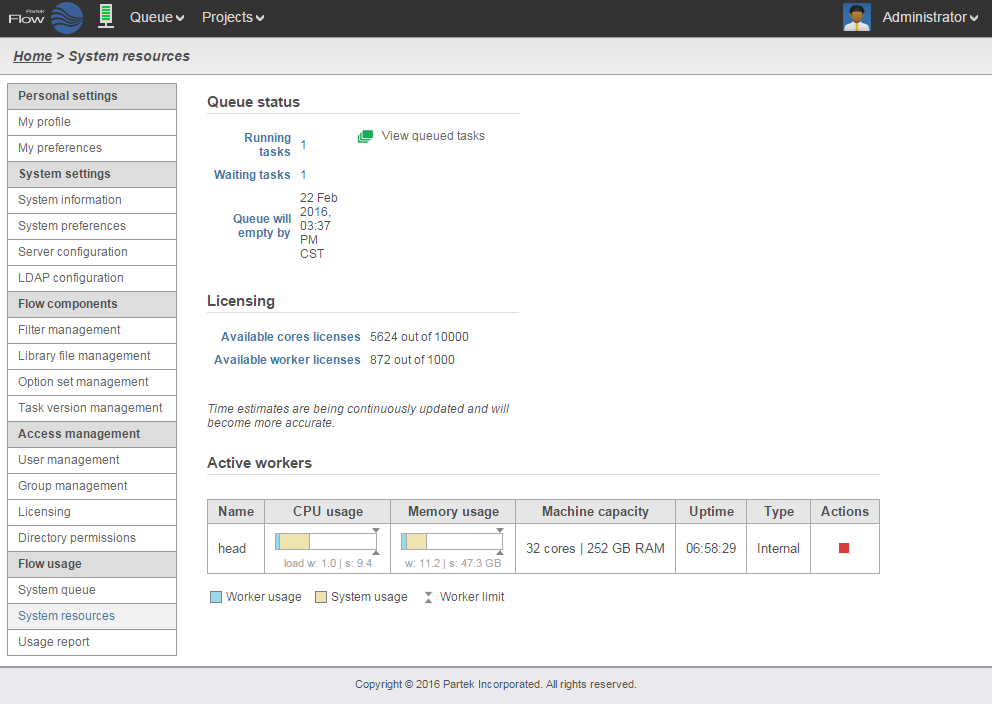
Page: System Resources
|
|
PNG File image2018-2-15 10:57:59.png |
60 kB |
Paul Fullerton |
Feb 15, 2018 10:57 |
Feb 15, 2018 10:57 |
|
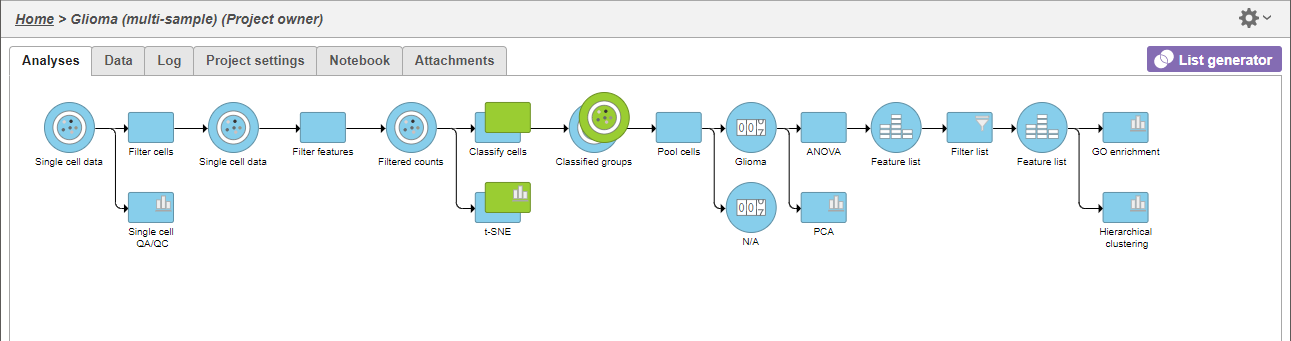
Page: Classify cells from multiple samples using t-SNE
|
|
PNG File image2018-2-15 10:57:59.png |
60 kB |
Alex Rutkovsky |
Jul 12, 2023 07:38 |
Jul 12, 2023 07:38 |
|
Page: Process Xenium data
|