To learn more about the biology underlying gene expression changes, we can use gene ontology (GO) or pathway enrichment analysis. Enrichment analysis identifies over-represented GO terms or pathways in a filtered list of genes.
Enrichment analysis
- Click the filtered Filtered feature list data node
- Click Biological interpretation in the task menu
- Click Gene set enrichment then select Gene set database to perform GO enrichment analysis (Figure 1)
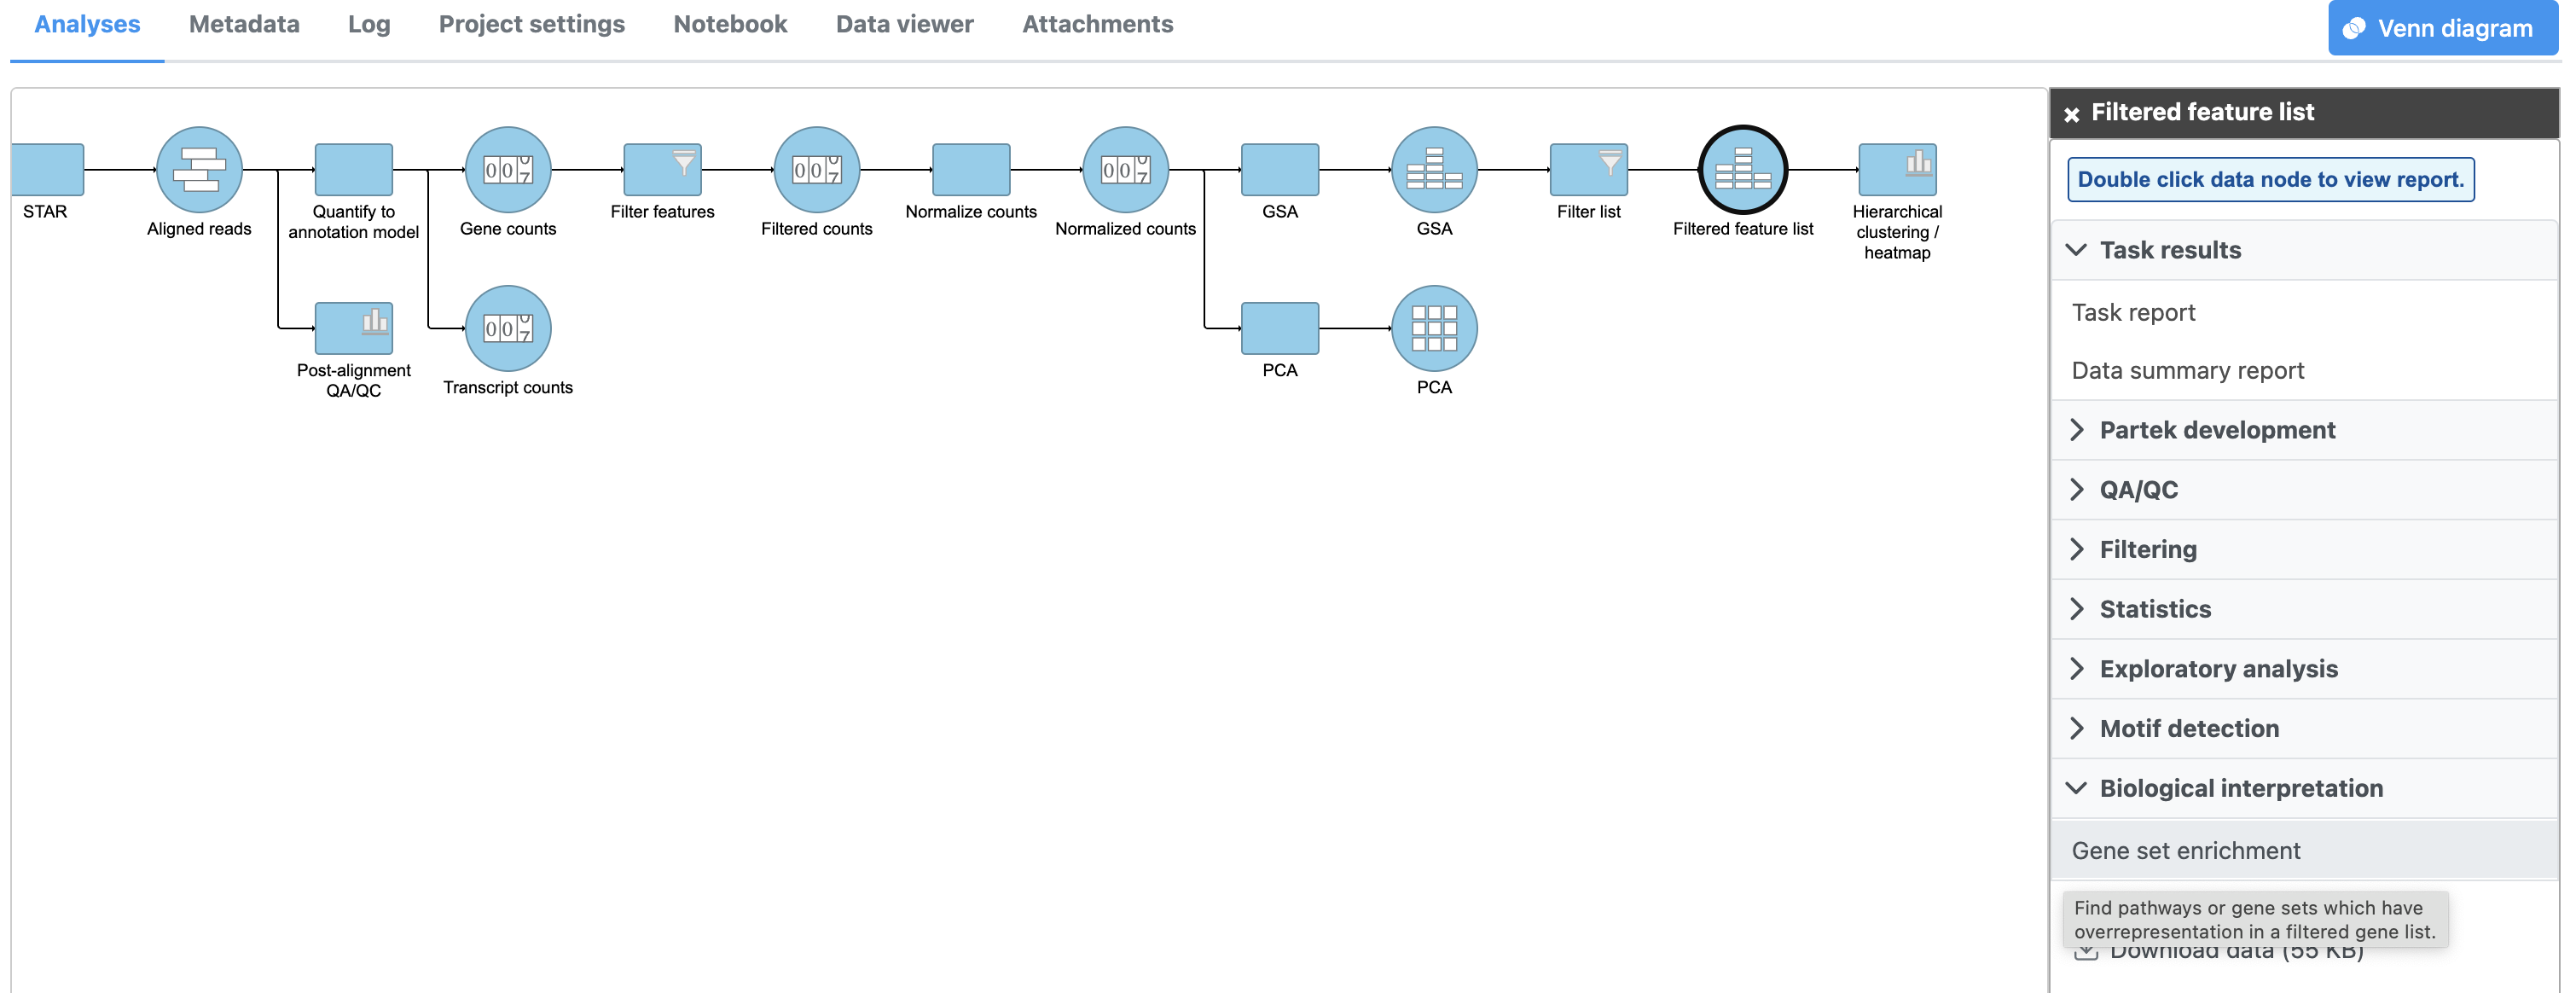
Figure 1. Invoking Enrichment analysis
- Select the latest gene set from geneontology.org from the Gene set database drop-down menu
- Click Finish
A GO enrichment task node will be added to the pipeline (Figure 2).
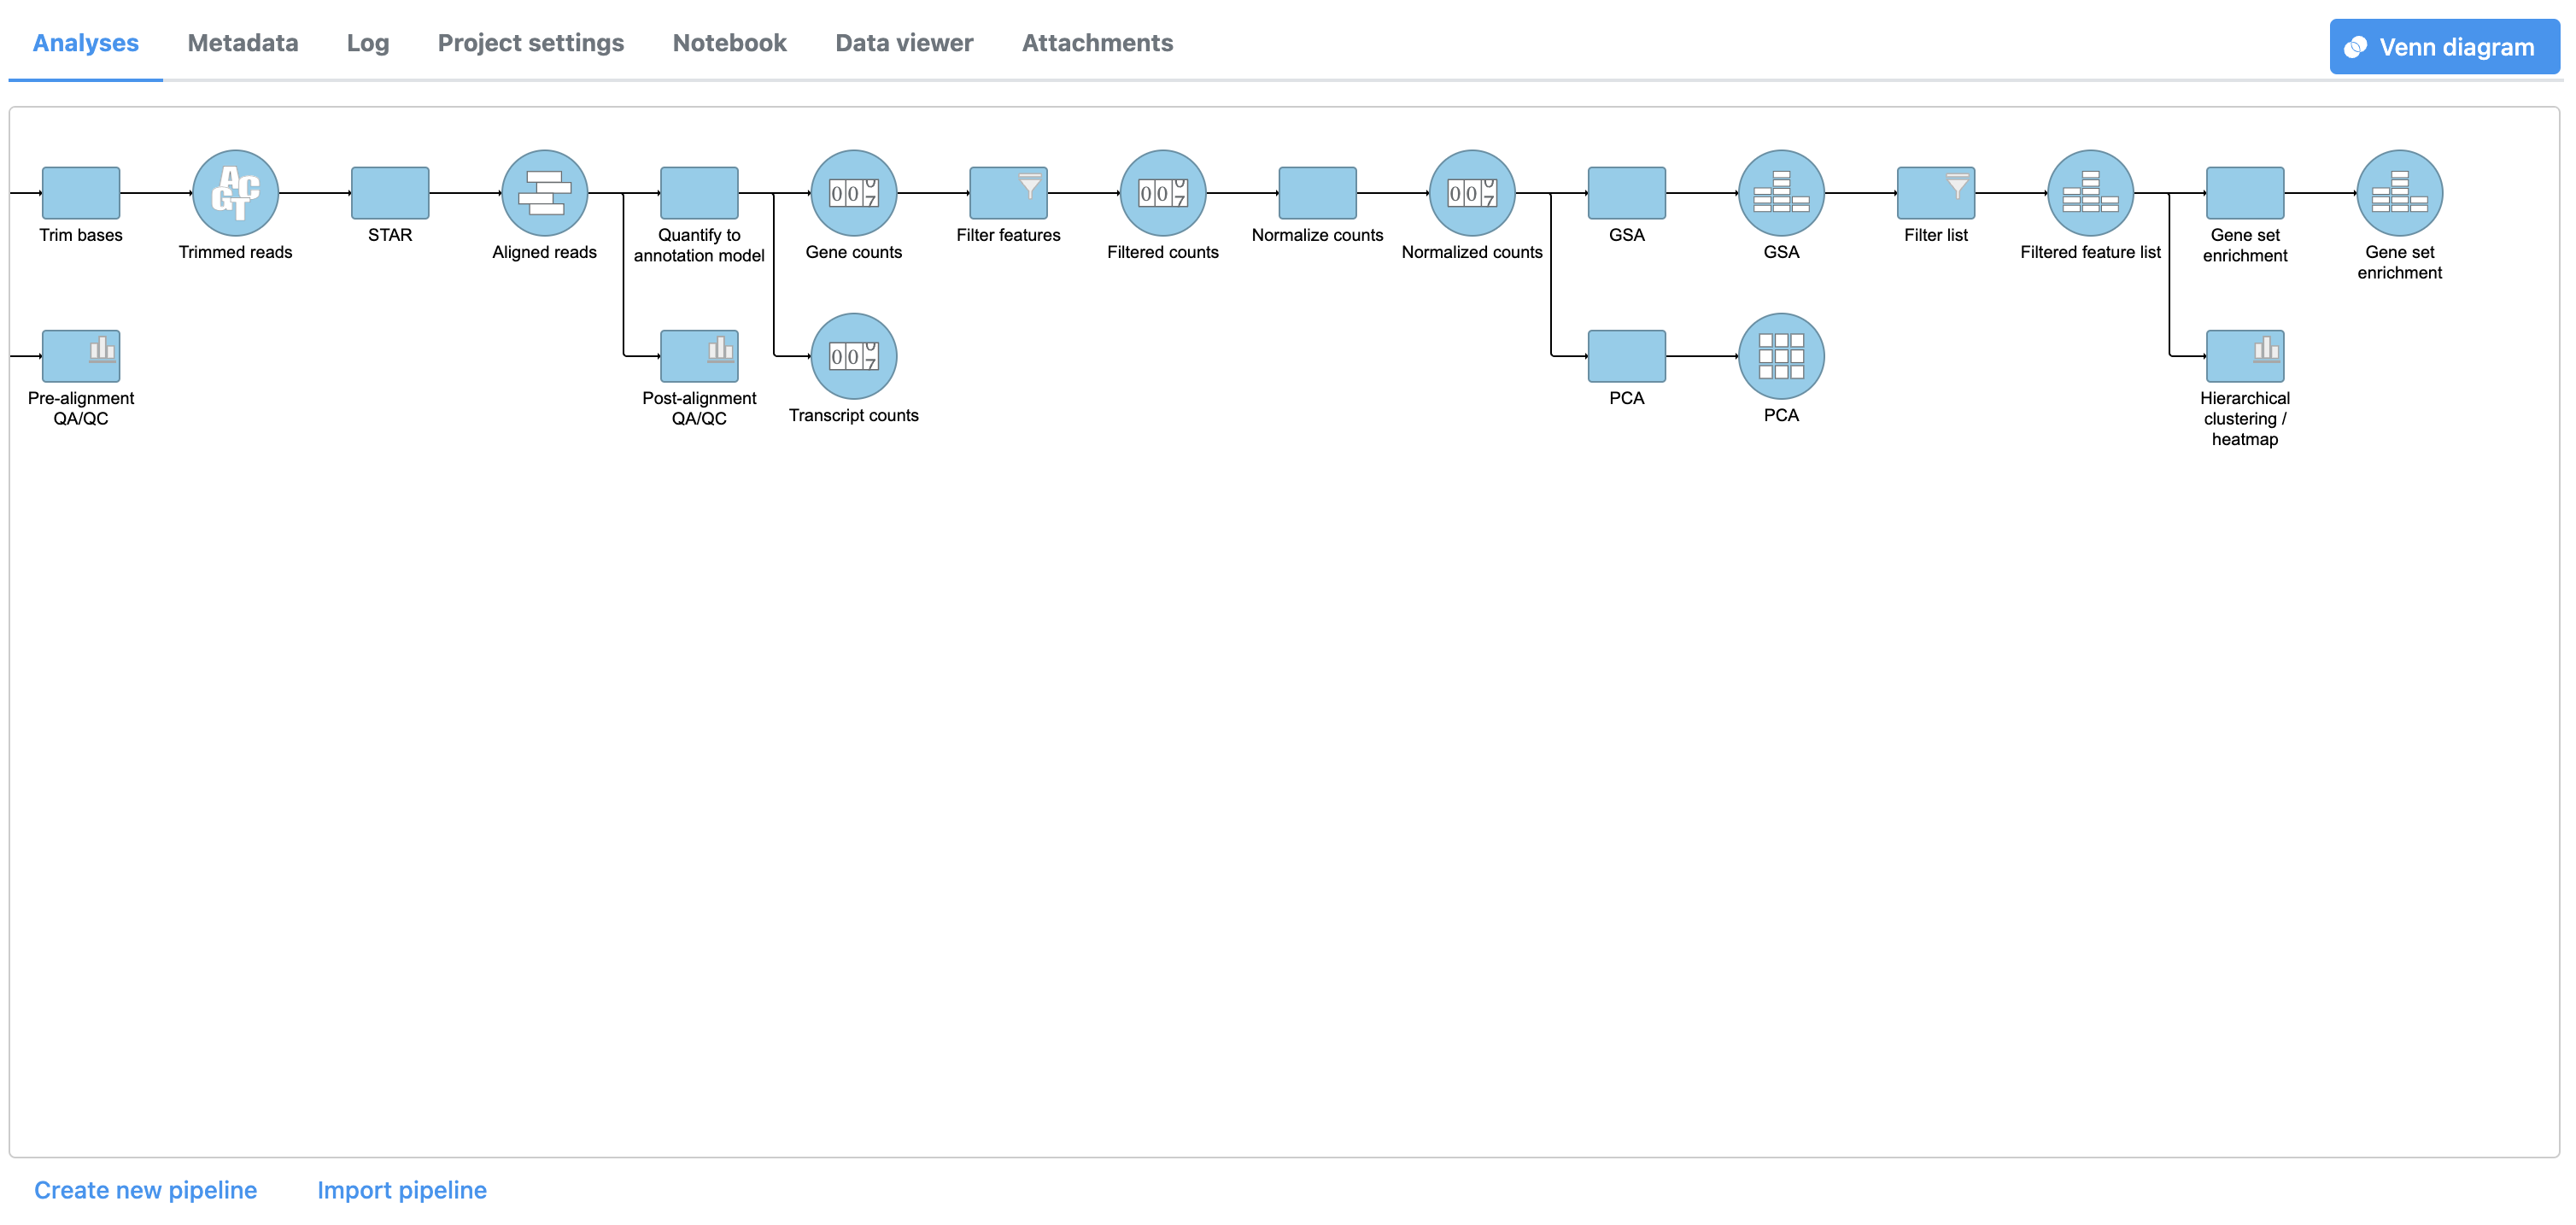
Figure 2. Enrichment task node
- Double-click the Gene set enrichment task node to open the task report (Figure 3)
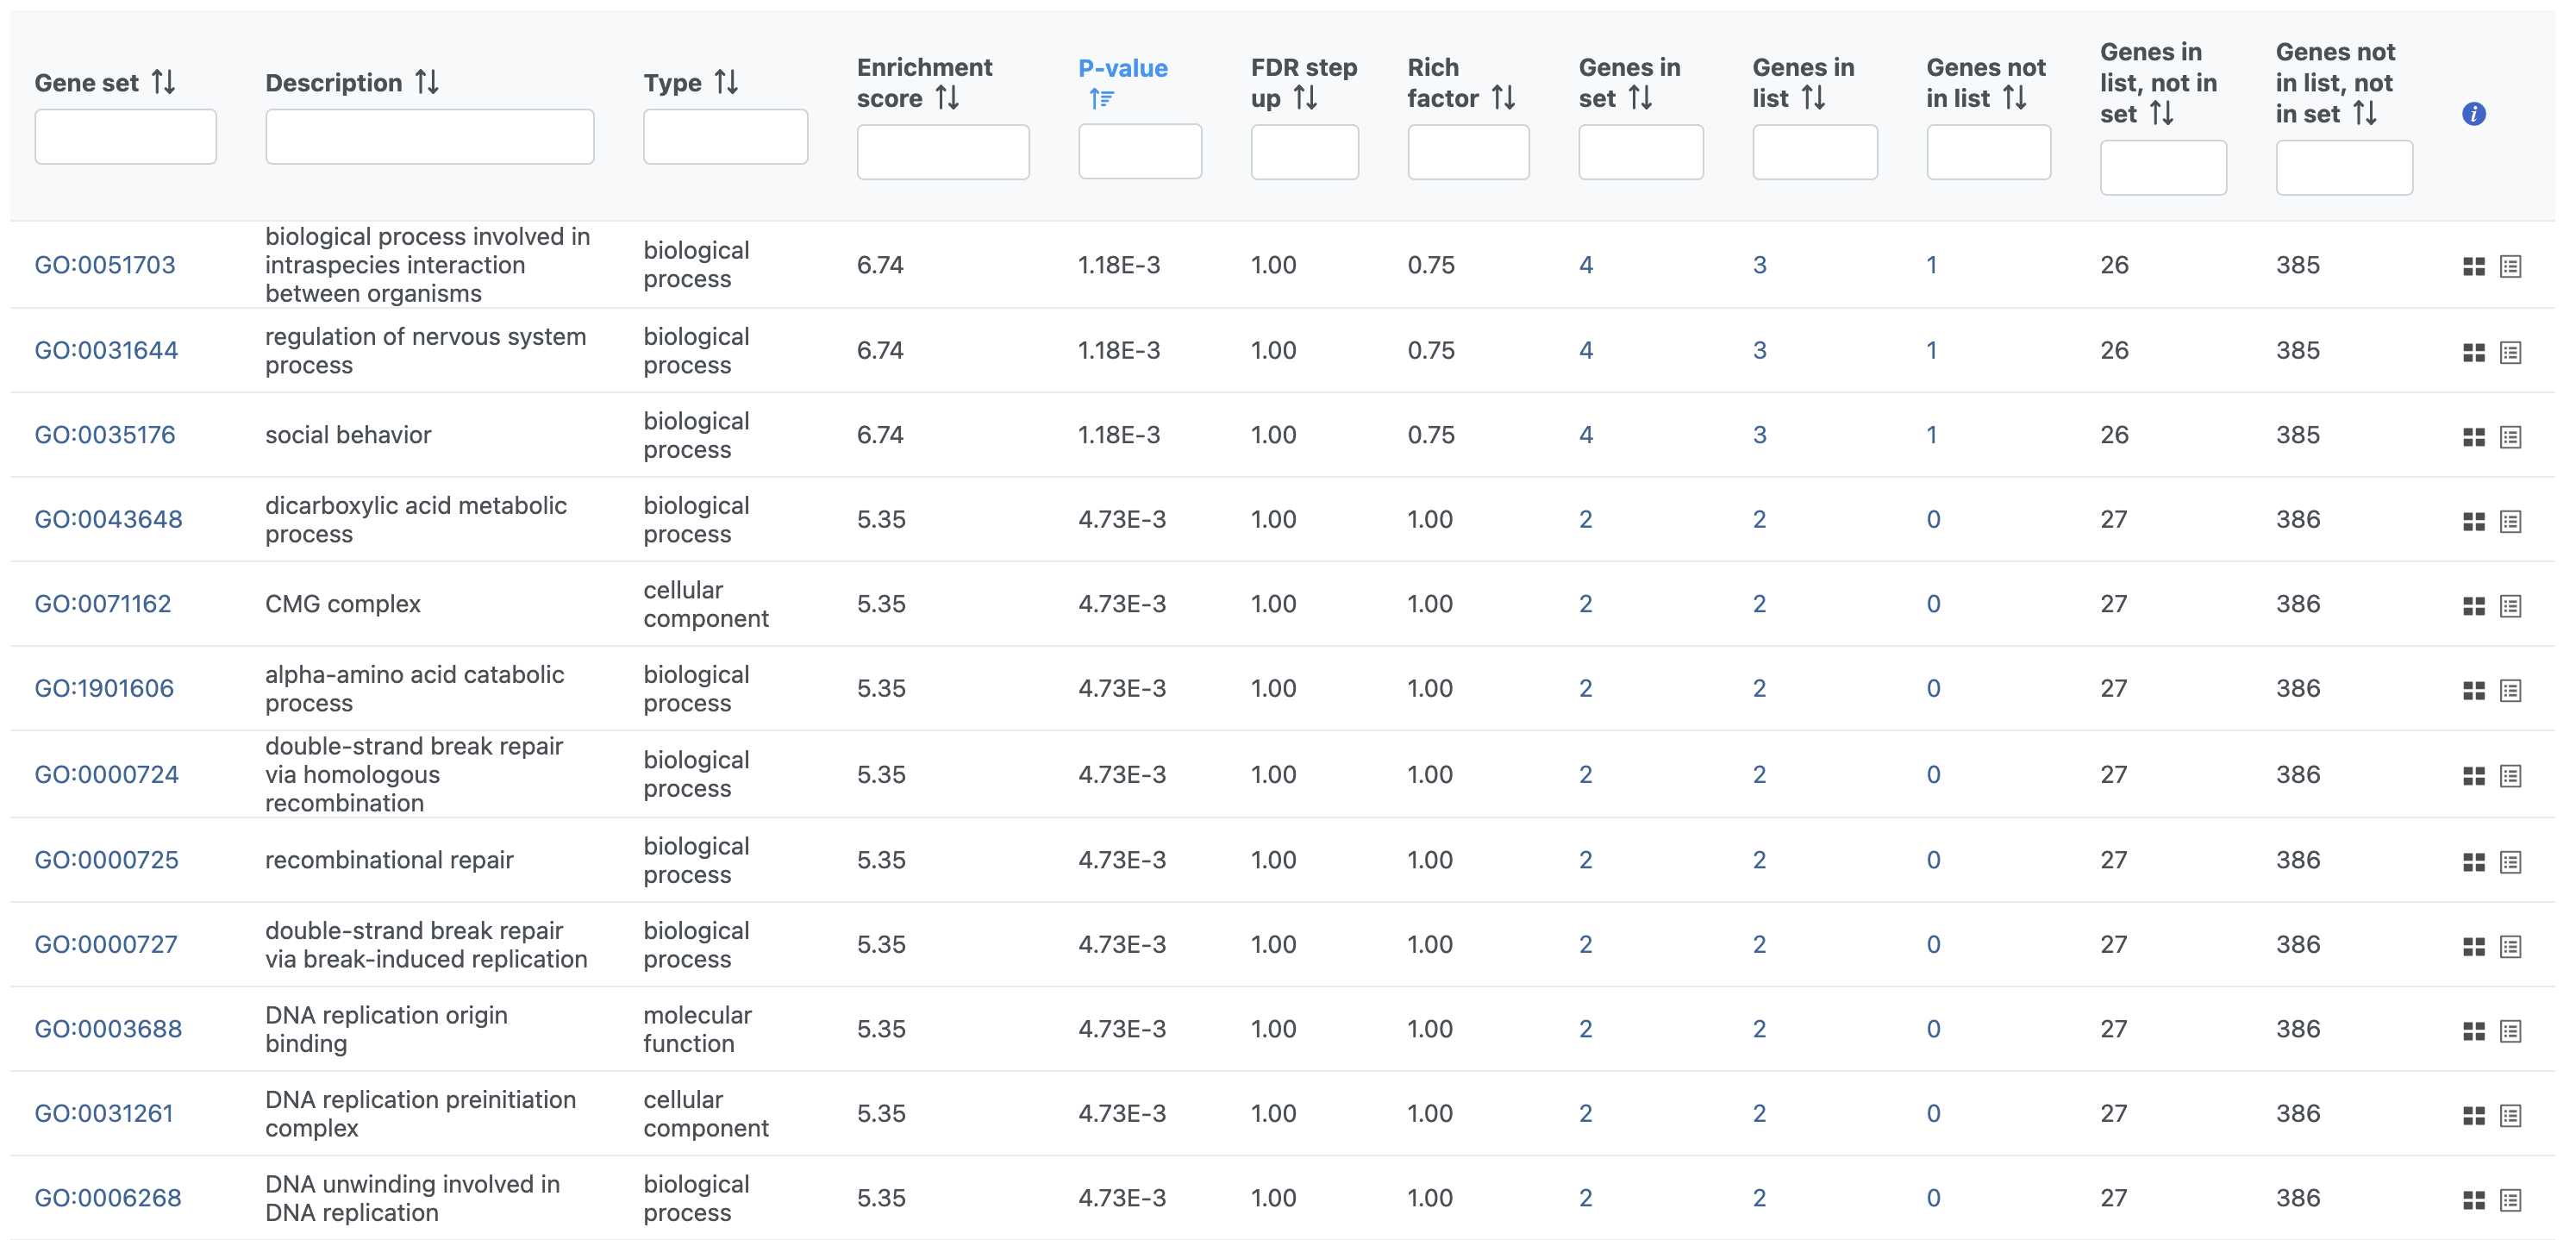
Figure 3. Viewing the GO enrichment task report
The GO enrichment task report spreadsheet lists GO terms by ascending p-value with the most significant GO term at the top of the list. Also included are the enrichment score, the number of genes from that GO term in the list, and the number of genes from that GO term that are not in the list.
To view the genes associated with each GO term, select  to open the extra details page. To view additional information about a GO term, click the blue gene set ID to open the linked geneontology.org entry in a new tab.
For more information about GO enrichment analysis, please see the Gene Set Enrichment user guide.
KEGG enrichment analysis
KEGG enrichment analysis identifies pathways that are over-represented in a gene list data node.
- Click the filtered Filtered feature list data node
- Click Biological interpretation in the task menu
- Click Gene set enrichment then select KEGG database
- Click Finish in the configuration dialog to run KEGG analysis with the Homo sapiens KEGG database
A Pathway enrichment task node will be added to the pipeline (Figure 4).
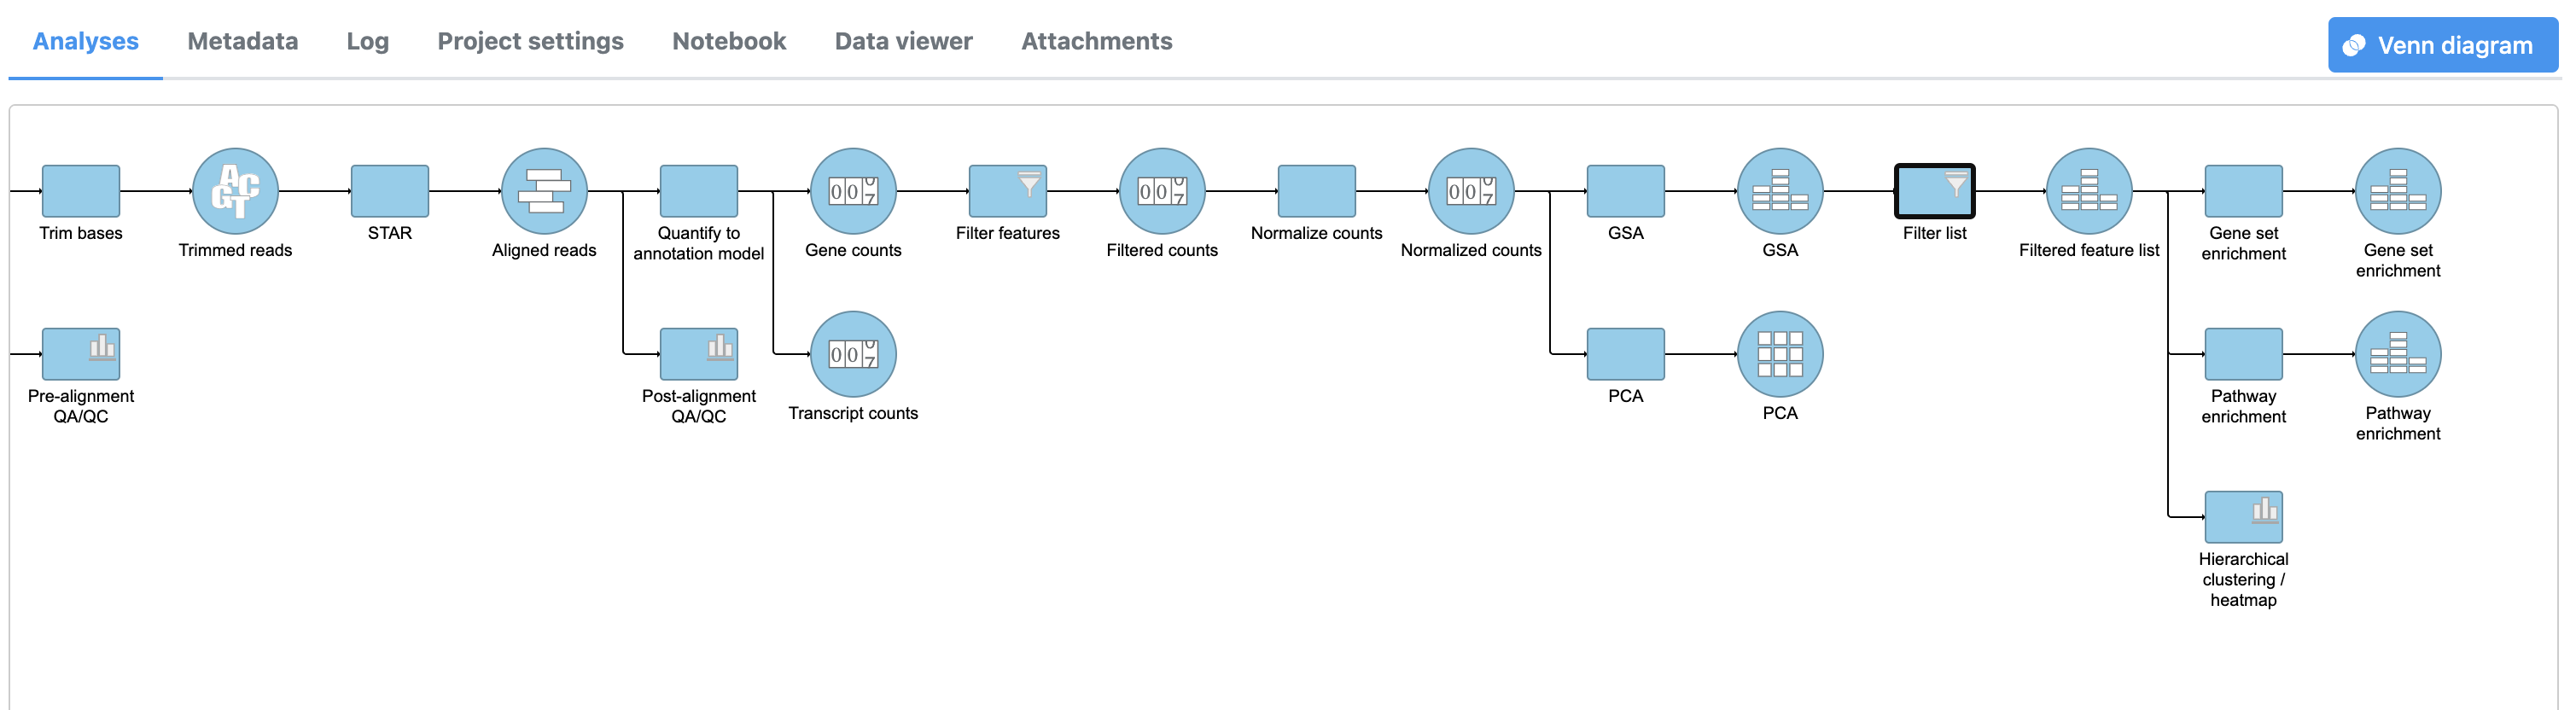
Figure 4. Pathway enrichment task node
- Double-click the Pathway enrichment task node to open the task report
The Pathway enrichment task report is similar to the Enrichment analysis task report (Figure 5).
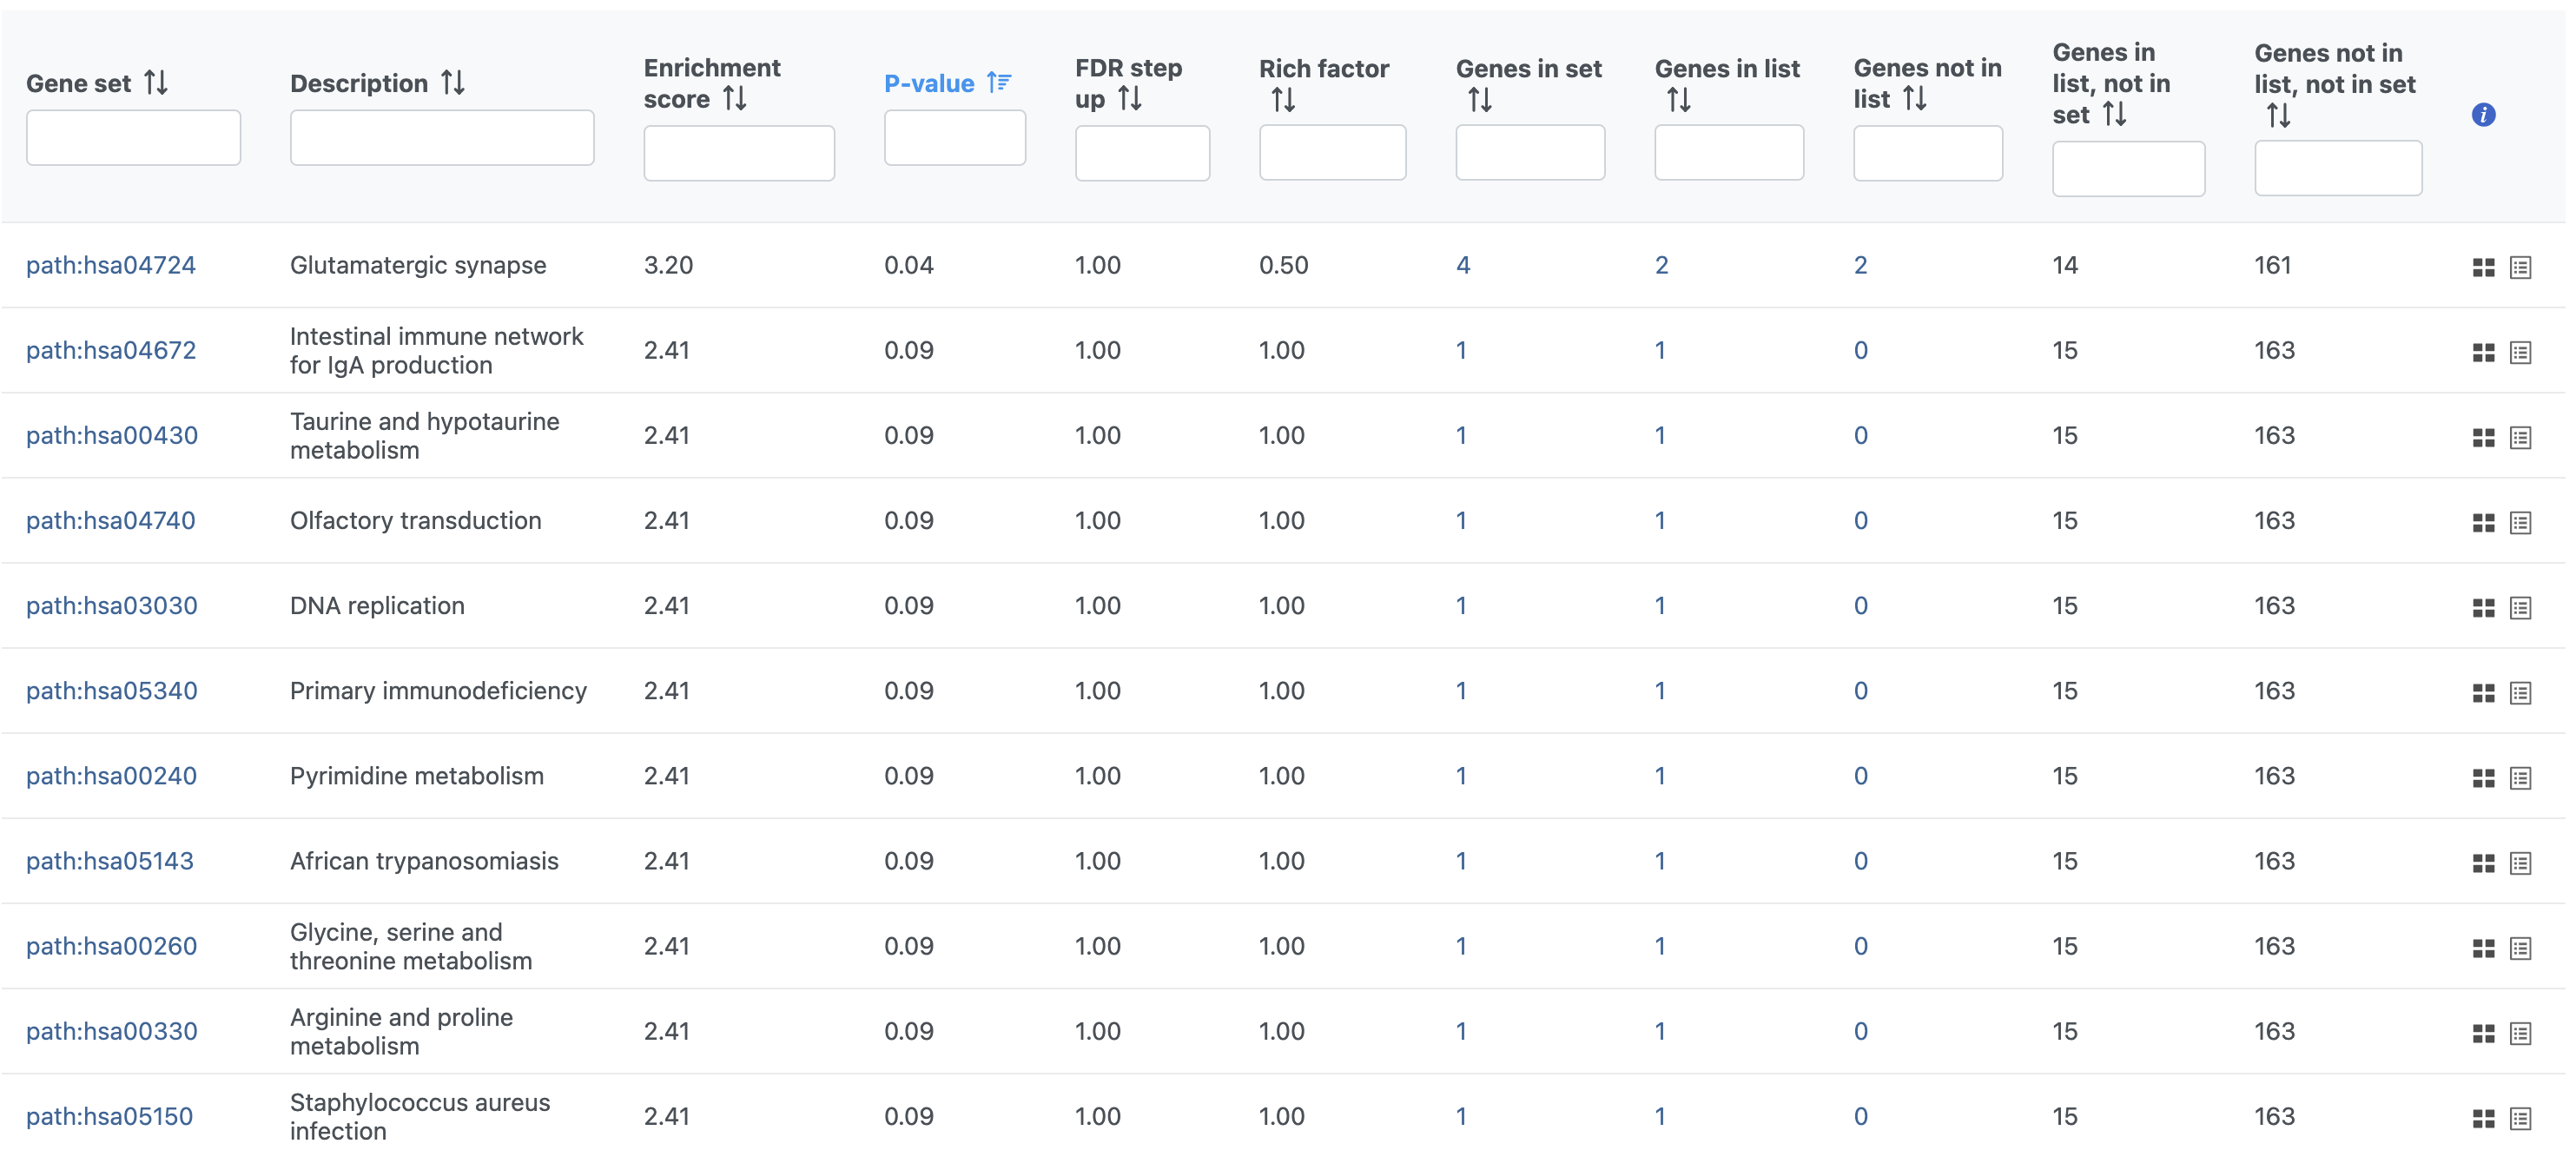
Figure 5. Pathway enrichment task report
To view an interactive KEGG pathway map, click the pathway ID (Gene set column).
Additional Assistance
If you need additional assistance, please visit our support page to submit a help ticket or find phone numbers for regional support.


| Your Rating: |
|
Results: |

|
30 | rates |
Overview
Content Tools