| Name
|
Size
|
Creator |
Creation Date
|
Last Modification Date
|
Labels |
Attached To |
|
PNG File 2017-08-07 10_11_51-Properties of Column 1 in Spre… |
5 kB |
Paul Fullerton |
Aug 07, 2017 10:12 |
Aug 07, 2017 10:12 |
|
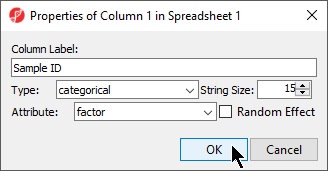
Page: Adding sample attributes
|
|
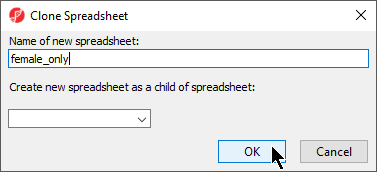
PNG File 2017-07-05 12_09_43-Clone Spreadsheet.png |
5 kB |
Paul Fullerton |
Jul 05, 2017 14:53 |
Jul 05, 2017 14:53 |
|
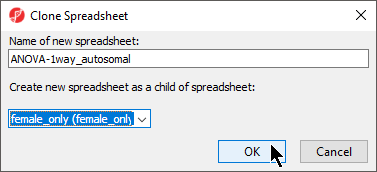
Page: Filter loci with the interactive filter
|
|
PNG File image2017-6-26 11:23:54.png |
5 kB |
Paul Fullerton |
Jun 26, 2017 11:23 |
Jun 26, 2017 12:09 |
|
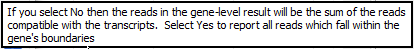
Page: RNA-Seq mRNA quantification
|
|
PNG File 2017-09-26 13_22_04-Filter Columns of Spreadsheet … |
5 kB |
Paul Fullerton |
Sep 26, 2017 13:23 |
Sep 26, 2017 13:23 |
|
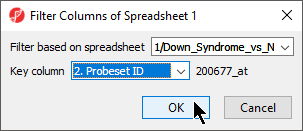
Page: Violin Plot
|
|
PNG File image2017-8-15 11:49:25.png |
5 kB |
Paul Fullerton |
Aug 15, 2017 11:49 |
Aug 15, 2017 11:49 |
|
Page: Visualizations
|
|
PNG File 2017-07-05 11_59_05-Clone Spreadsheet.png |
4 kB |
Paul Fullerton |
Jul 05, 2017 14:49 |
Jul 05, 2017 14:49 |
|
Page: Annotate samples
|
|
PNG File mac_flow_verification.png |
4 kB |
admin |
Aug 28, 2017 10:59 |
Aug 28, 2017 10:59 |
|
Page: Windows Installation
|
|
PNG File pathway.png |
3 kB |
admin |
Aug 25, 2017 10:06 |
Aug 25, 2017 10:06 |
|
Home page: Partek Genomics Suite Documentation
|
|
PNG File methylation.png |
3 kB |
admin |
Aug 25, 2017 10:19 |
Aug 25, 2017 10:19 |
|
Home page: Partek Genomics Suite Documentation
|
|
PNG File tutorial.png |
3 kB |
admin |
Aug 25, 2017 08:34 |
Aug 25, 2017 08:34 |
|
Home page: Partek Genomics Suite Documentation
|
|
PNG File version-update.png |
3 kB |
admin |
Oct 17, 2017 15:52 |
Oct 17, 2017 15:52 |
|
Home page: Partek Genomics Suite Documentation
|
|
PNG File image2017-8-15 11:47:44.png |
3 kB |
Paul Fullerton |
Aug 15, 2017 11:47 |
Aug 15, 2017 11:47 |
|
Page: Visualizations
|
|
PNG File image2017-8-16 15:3:21.png |
2 kB |
Paul Fullerton |
Aug 16, 2017 15:03 |
Aug 16, 2017 15:21 |
|
Page: Sort Rows by Prototype
|
|
PNG File image2017-6-16 16:11:51.png |
2 kB |
Paul Fullerton |
Jun 20, 2017 15:57 |
Jun 20, 2017 16:11 |
|
Page: Identifying differentially expressed genes using ANOVA
|
|
PNG File image2017-6-16 16:11:51.png |
2 kB |
Paul Fullerton |
Jul 21, 2017 09:18 |
Jul 21, 2017 09:18 |
|
Page: Creating gene lists from ANOVA results
|
|
PNG File image2017-7-31 11:47:59.png |
2 kB |
Paul Fullerton |
Jul 31, 2017 11:47 |
Jul 31, 2017 11:47 |
|
Page: Visualizing reads and enriched regions
|
|
PNG File 2017-07-31 11_48_23-Partek Genomics Suite - 1 (ChI… |
2 kB |
Paul Fullerton |
Jul 31, 2017 11:48 |
Jul 31, 2017 11:48 |
|
Page: Visualizing reads and enriched regions
|
|
PNG File recompute.png |
2 kB |
Ivan Lukic |
May 17, 2017 03:23 |
May 17, 2017 03:23 |
|
Page: Perform data quality analysis and quality control
|
|
PNG File image2017-8-15 16:4:32.png |
1 kB |
Paul Fullerton |
Aug 15, 2017 16:04 |
Aug 15, 2017 16:32 |
|
Page: XY Plot / Bar Chart
|
|
PNG File image2017-8-21 16:8:56.png |
1 kB |
Paul Fullerton |
Aug 21, 2017 16:08 |
Aug 21, 2017 16:55 |
|
Page: Analyzing pathway enrichment in Partek Pathway
|