We can visualize the reads and enriched regions using the Partek Genome Viewer.
- Select ChIP-Seq from the spreadsheet tree
- Select Chromosome View from the Visualization section of the ChIP-Seq workflow
The Chromosome View tab will open. The default tracks are the transcript tracks, the sequence visualization tracks, and the cytoband track (Figure 1).
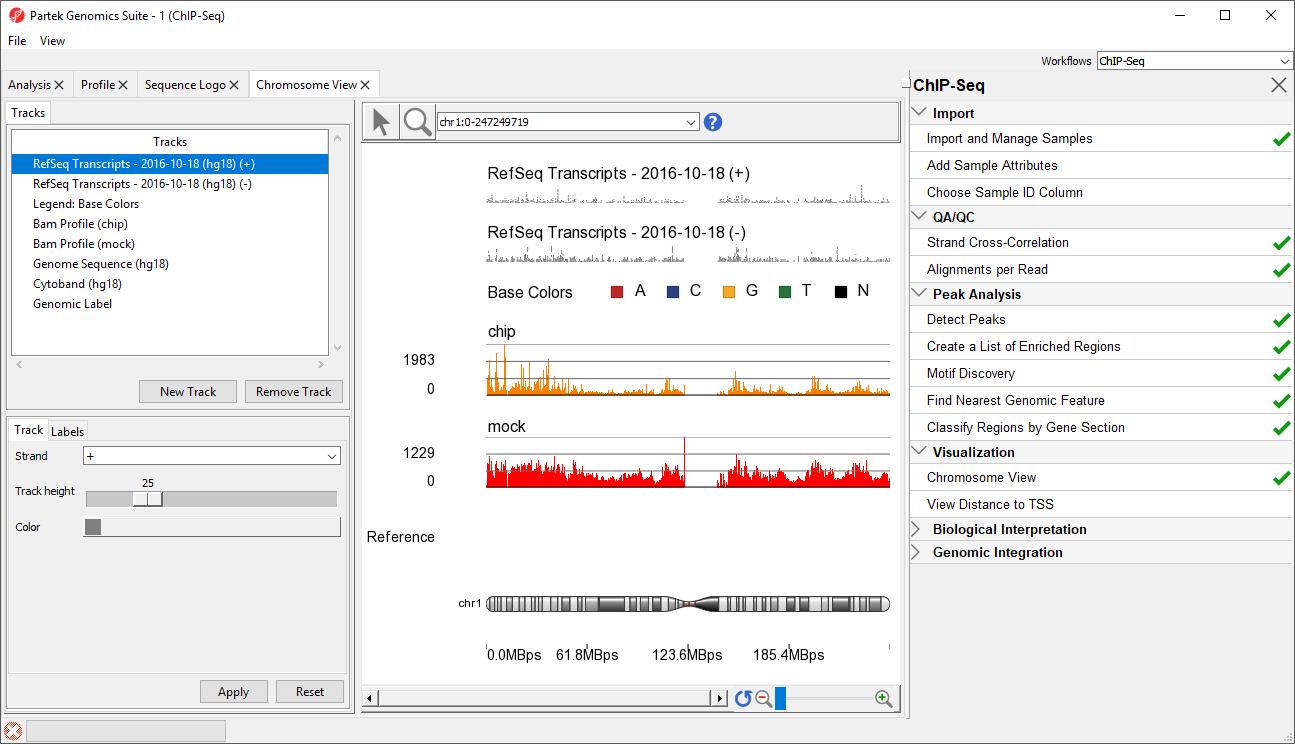
Figure 1. Viewing ChIP-Seq data in Chromosome View
We can add additional tracks to view the results of our analysis.
- Select New Track from the left-hand side of the Tracks tab
- Select Add tracks from a list of spreadsheets
- Select Next >
- Select the p-value_filtered.txt and Motifs_instances.txt tracks on the Tracks panel
- De-select Aligned Reads
- Select Create (Figure 2)
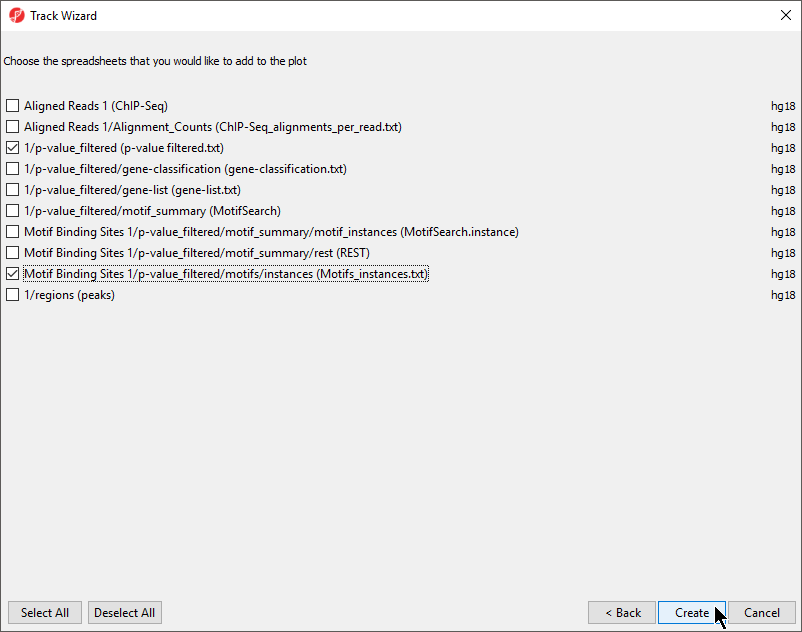
Figure 2. Adding spreadsheet tracks to Genome Viewer
This will display the enriched regions found in the samples and the locations of the motif instances from the de novo motif discovery (Figure 3).
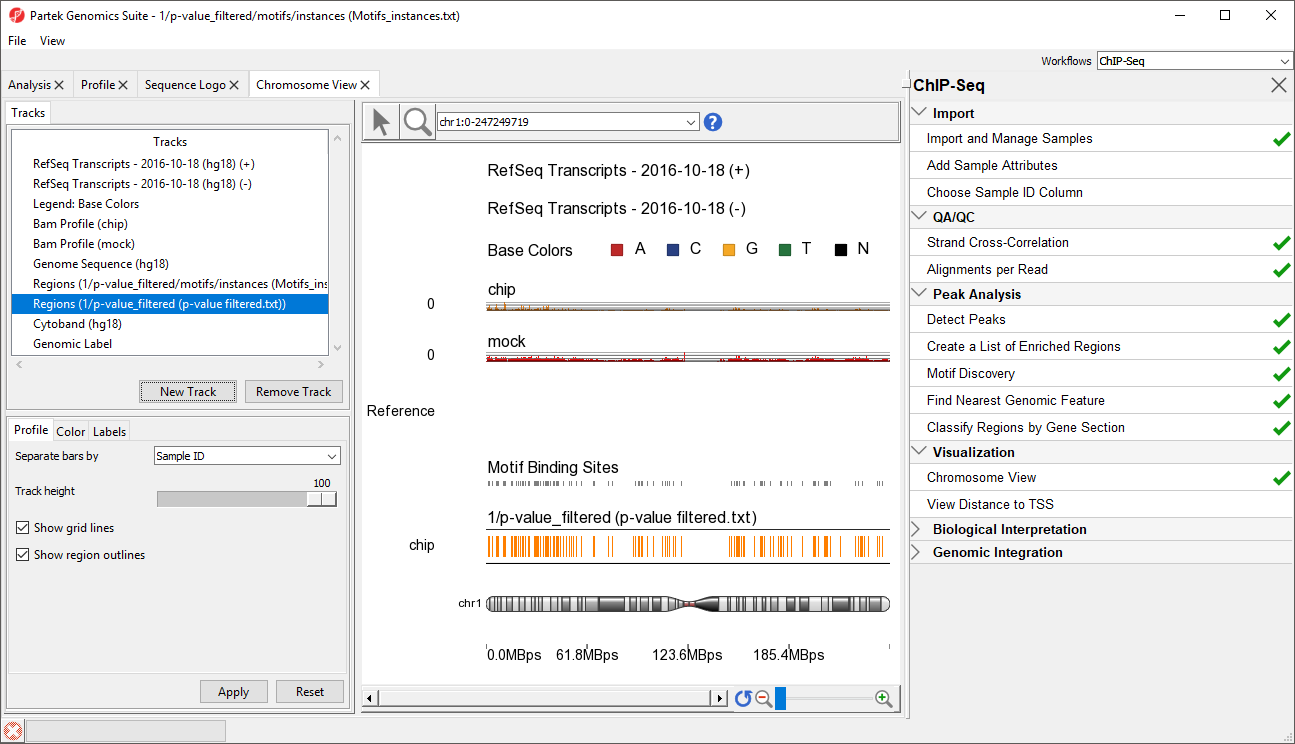
Figure 3. Adding p-value and motif binding tracks
The two track display the detected regions at each location on the chromosome for the NRSF-enriched sample, chip, and aligned them to the de novo discovered motif binding sites. If you have not gone through the steps for peak detection and motif discovery, these tracks will not be available.
To facilitate analysis, we will consolidate the tracks. To select a track, either left-click it in the Tracks panel or activate Selection Mode by selecting the (![]() ) icon and left-click the track in the viewer. Selecting a track opens its configuration options in the track properties panel below the Tracks panel.
) icon and left-click the track in the viewer. Selecting a track opens its configuration options in the track properties panel below the Tracks panel.
- Select RefSeq Transcripts - 2016-10-18 (hg18) (+) on the Tracks panel
- Set Strand to Both using the drop-down menu in the Track section of the track properties panel
- Select Apply
The RefSeq Transcripts track now shows transcripts from both strands. We can remove the dedicated (-) strand track.
- Select RefSeq Transcripts - 2016-10-18 (hg18) (-) on the Tracks panel
- Select Remove Track
Several other tracks will not be used in our analysis; we can remove them as well.
- Select Legend: Base Colors, Genome Sequences (hg18), and Cytoband (hg18) on the Tracks panel by left clicking on each while holding the Ctrl key on your keyboard
- Select Remove Track
The height of many tracks can be adjusted by changing the Track height setting in the Profile tab.
- Select Regions (1/p-value_filtered (p-value filtered.txt)) on the Tracks panel
- Set Track height to 25 using the slider
- Select Apply
- Repeat for Regions (1/p-value_filtered/motifs/instances (Motifs_instances.txt))
This view clearly shows the Bam Profile tracks for chip and mock samples alongside smaller track indicating motif binding sites, significant peaks, and RefSeq transcripts (Figure 4).
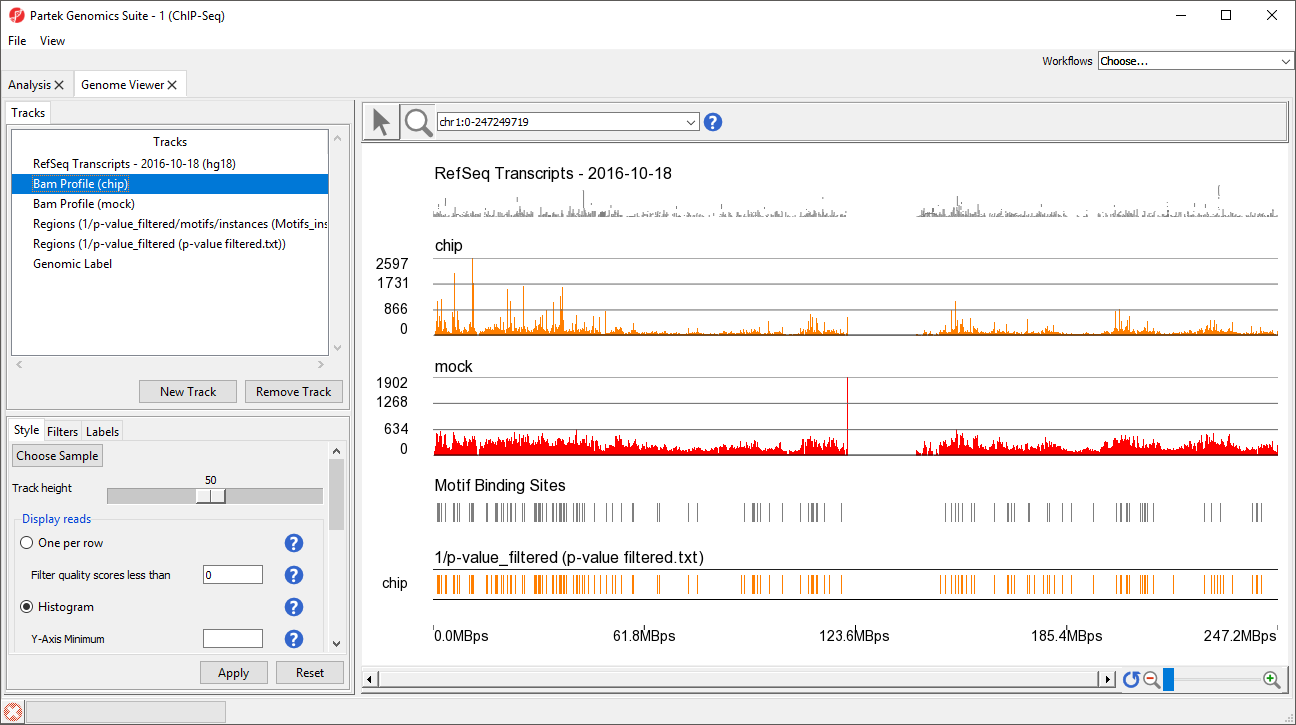
Figure 4. Genome Viewer tracks can be modified to facilitate data exploration and analysis
We can also see strand-specific information by color-coding forward and reverse strand read information on the Bam Profile (chip) track.
- Select Bam Profile (chip) on the Tracks panel
- Select Alignments in the Display Color Options section of the Style tab
- Select Strands under Color by
- Select Apply
A legend track will be added at the bottom of the viewer showing that forward strand reads are colored green and reverse strand reads are colored red. We can move this track to below Bam Profile (chip).
- Left-click Legend: strands in the Tracks panel and drag it up the list to below Bam Profile (chip) (Figure 5)
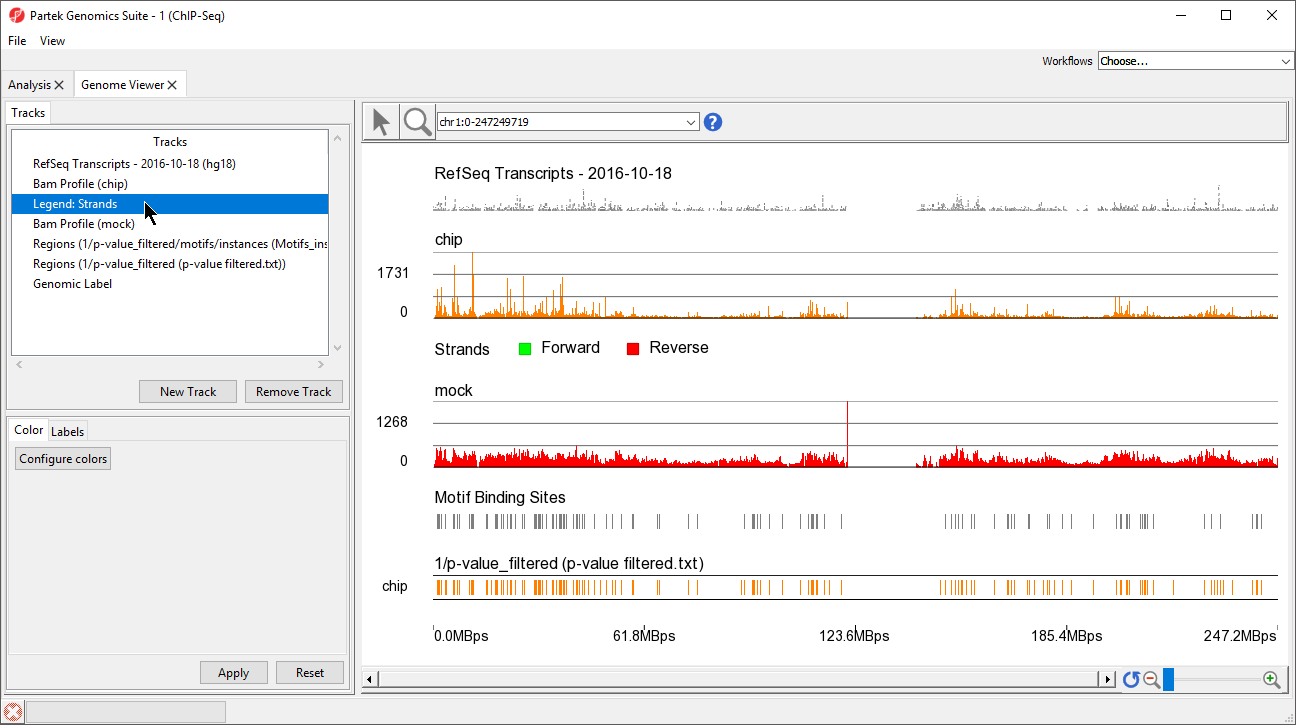
Figure 5. Move tracks by left-clicking and dragging them in the Tracks panel
Chromosome View opens to a whole-chromosome view of chromosome 1. To analyze the data we can zoom in on the data (Figure 6).
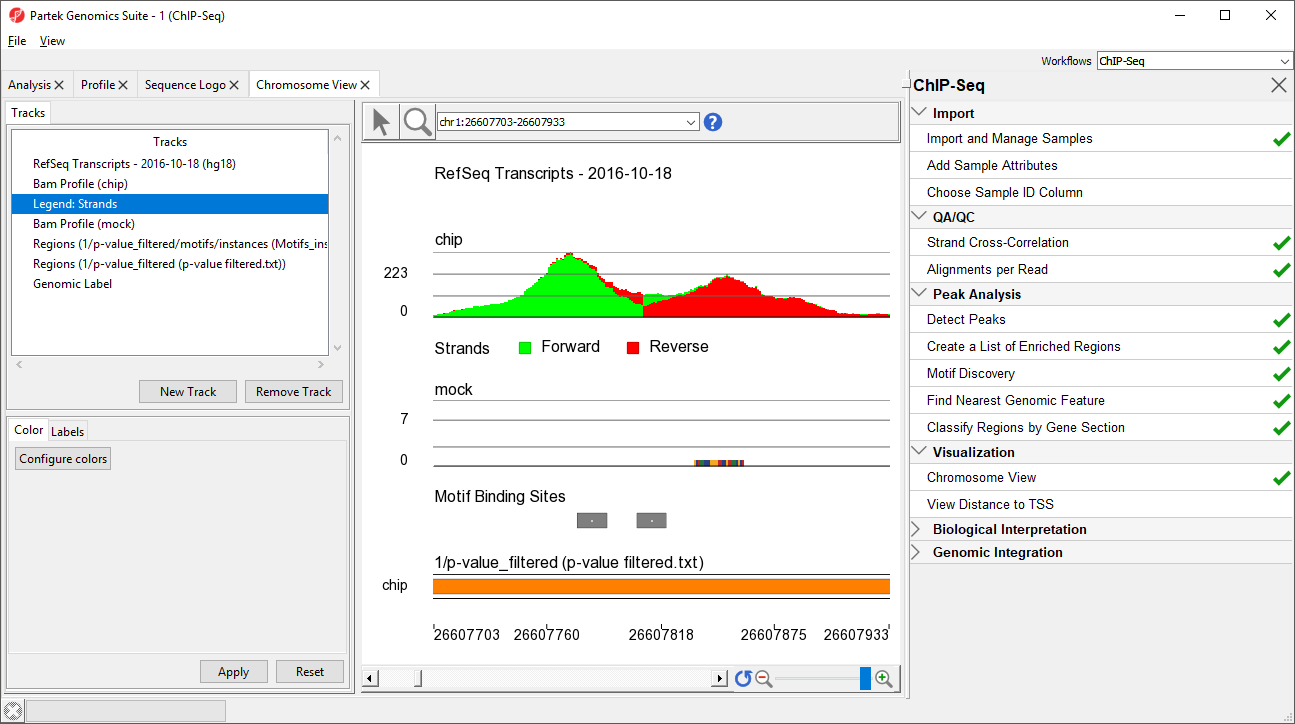
Figure 6. Viewing the zoomed-in view of an enriched region showing two possible binding sites at the location
There are four methods for zooming in and out in Chromosome View. (1) Select (![]() ) to activate Zoom/Navigate Mode. With this mode selected, left-clicking and drawing a box on a track will zoom to the region in the box. (2) Use the mouse scroll wheel (3) Select the zoom in (
) to activate Zoom/Navigate Mode. With this mode selected, left-clicking and drawing a box on a track will zoom to the region in the box. (2) Use the mouse scroll wheel (3) Select the zoom in (![]() ) and zoom out (
) and zoom out (![]() ) on the zoom controls (
) on the zoom controls ( ). Selecting (
![]() ) resets the zoom to whole chromosome. (4) Use the slider on the zoom controls (). (5) Zoom to a location or gene by typing the coordinates or gene name in the Navigation bar (
) resets the zoom to whole chromosome. (4) Use the slider on the zoom controls (). (5) Zoom to a location or gene by typing the coordinates or gene name in the Navigation bar ( ) and pressing Enter on your keyboard. (5) Starting on a spreadsheet, right-click a row with region information, and select Browse to Location.
We can practice this using a gene highlighted in the paper describing this data set, NEUROD1.
- Type NEUROD1 in the navigation bar
- Select Enter on your keyboard to navigate to NEUROD1 (Figure 7)
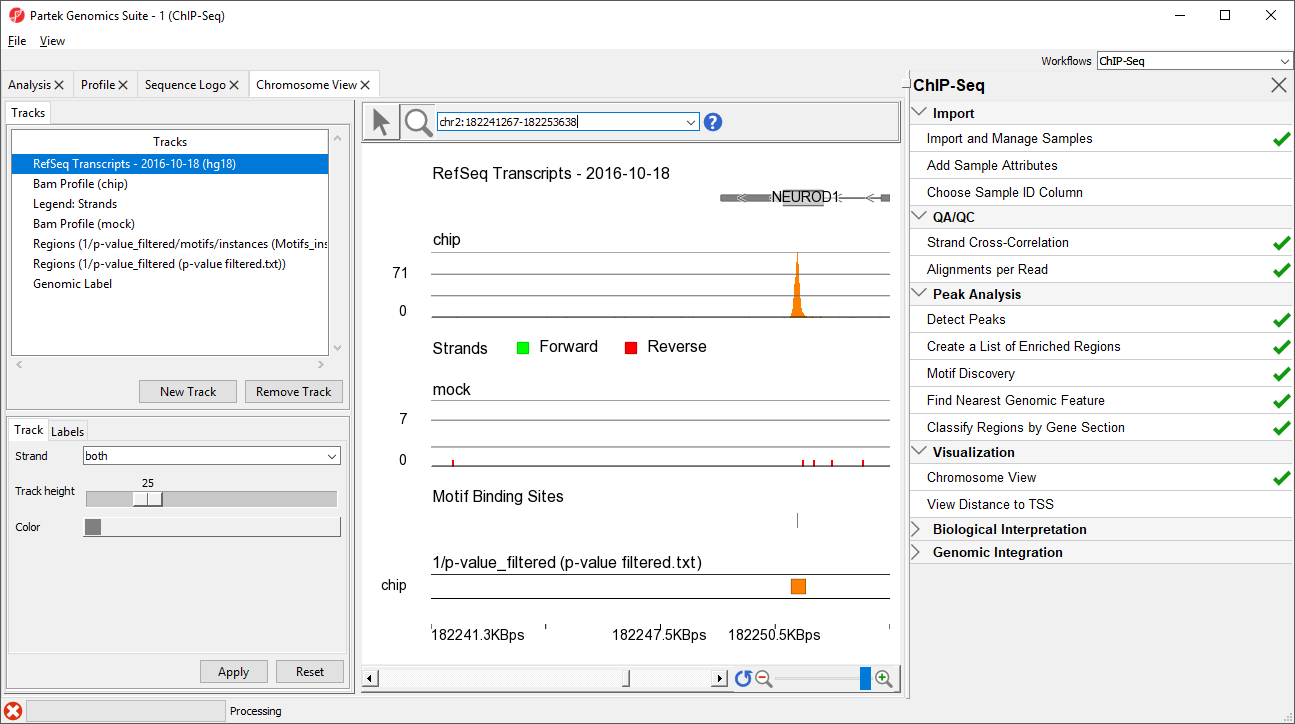
Figure 7. Zooming to the NEUROD1 gene
NEUROD1 contains a binding site for the NRSF motif. Notice that the enriched region for the NRSF transcription factor is within the NEUROD1 gene. As discussed in the Johnson et al. paper, NRSF is implicated in the repression of NEUROD1, but it was unknown exactly where the NRSF binding occurred. This data indicates that the binding site is within the NEUROD1 gene itself, as shown by the orange box in the Regions track. We can zoom in further to view the forward and reverse strand read histogram.
- Select (
 )
) - Left-click and drag to draw a box around the predicted binding site (Figure 8)
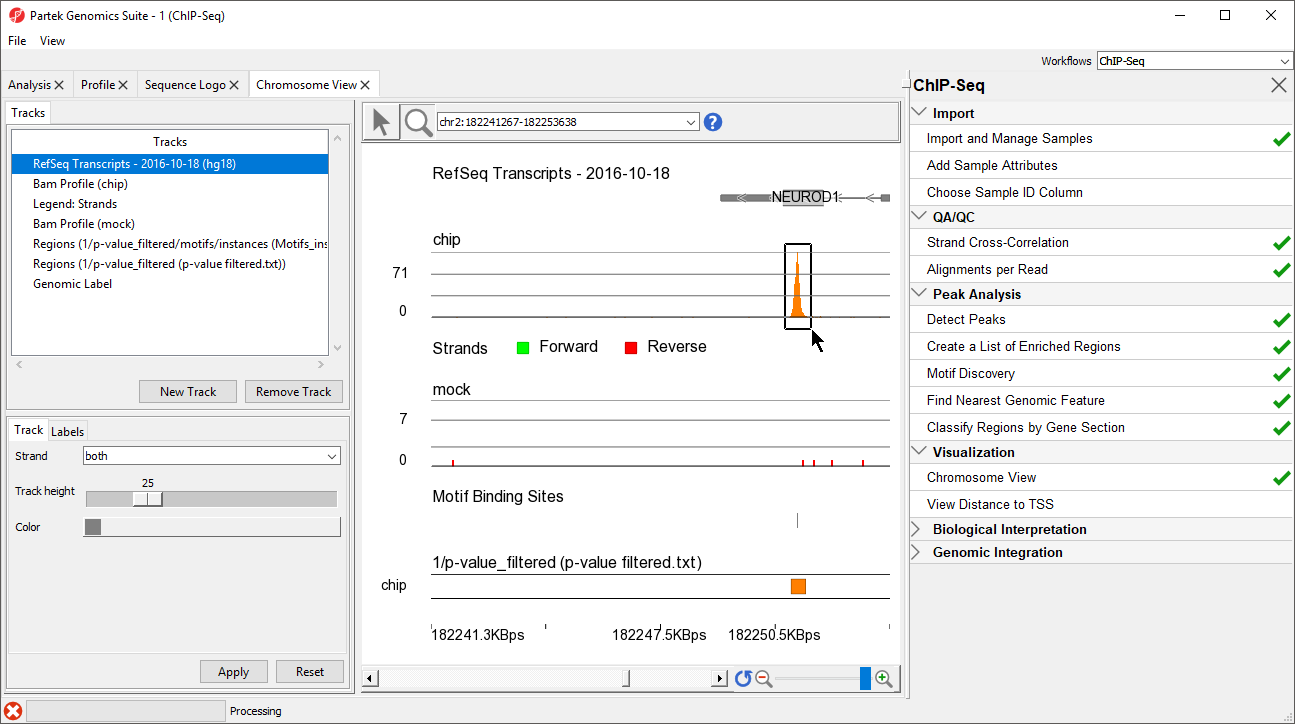
Figure 8. Using Zoom/Navigate Mode. Drawing a box around a region on any track will zoom all tracks to that region
Zoomed-in further, we can see the intersecting peaks from forward and reverse strand reads (Figure 9).
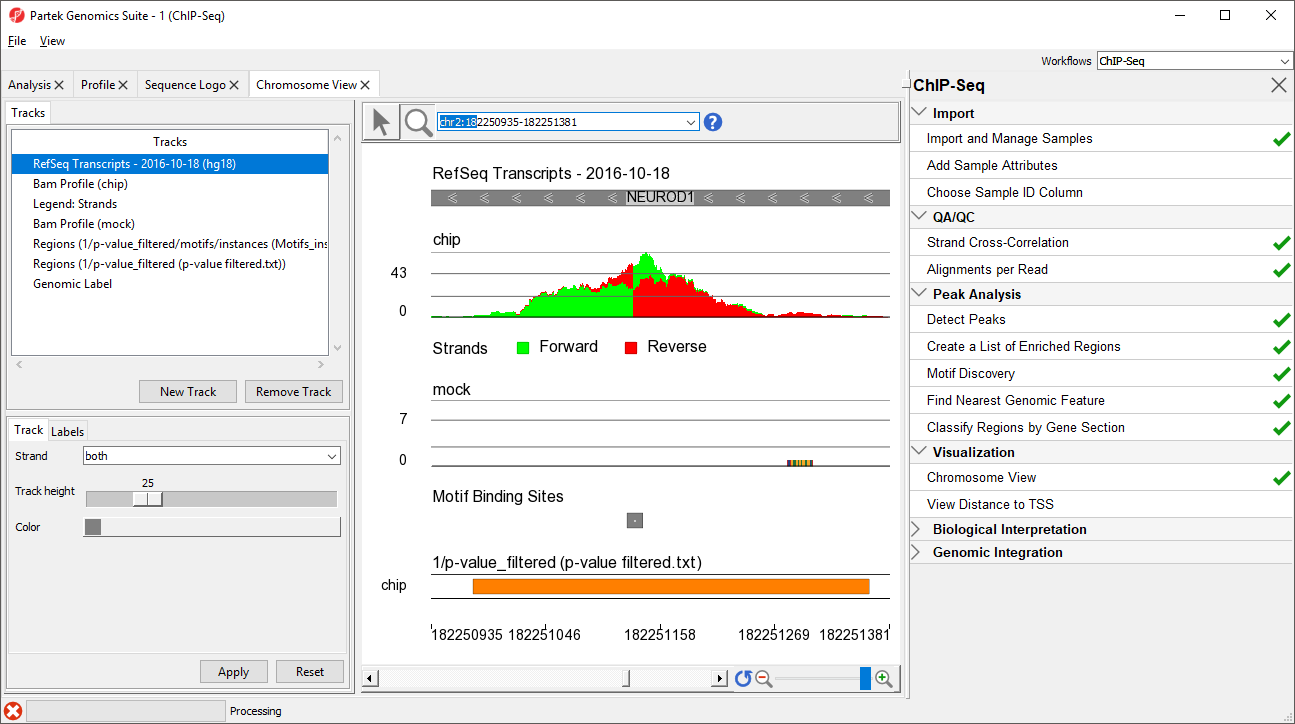
Figure 9. Zoomed-in view of NEUROD1 binding site for NRSF
You can save the reads shown in the visible genome browser window by selecting (![]() ), right-clicking in the peak area on the Bam Profile track, and selecting Dump Displayed Reads to Spreadsheet from the pop-up menu.
), right-clicking in the peak area on the Bam Profile track, and selecting Dump Displayed Reads to Spreadsheet from the pop-up menu.
Additional Assistance
If you need additional assistance, please visit our support page to submit a help ticket or find phone numbers for regional support.


| Your Rating: |
|
Results: |

|
37 | rates |
Overview
Content Tools