Creating a gene list with the ANOVA Streamlined list manager
Now that you have obtained statistical results from the microarray experiment, you can create new spreadsheets containing just those genes that pass certain criteria. This will streamline data management by focusing on just those genes with the most significant differential expression or substantial fold change. The List Manager can be used to specify numerous conditions for selecting genes of interest. In this tutorial, we are going to create a gene list of gene with a fold change between -1.3 to 1.3 that has an unadjusted p-value of < 0.0005.
- Invoke the List Manager dialog by selecting Create Gene List in the Analysis section of the Gene Expression workflow
- Ensure that the 1/ANOVA-3way (ANOVAResults) spreadsheet is selected as this is the spreadsheet we will be using to create our new gene list as shown (Figure 1)
- Select the ANOVA Streamlined tab.
- Set Contrast: find genes that change between two categories panel, to Down Syndrome vs. Normal and select Have Any Change from the Setting drop-down menu
This will find genes with different expression levels in the different types of samples.
- In the Configuration for “Down Syndrome vs Normal” panel, check that Include size of the change is selected and enter 1.3 into Change > and -1.3 in OR Change <
- Select Include significance of the change, choose unadjusted p-value from the dropdown menu, and < 0.001 for the cutoff
The number of genes that pass your cutoff criteria will be shown next to the # Pass field. In this example, 30 genes pass the criteria.
- Set Save the list as A
- Select Create to generate the new list A
- Select Close to view the new gene list spreadsheet
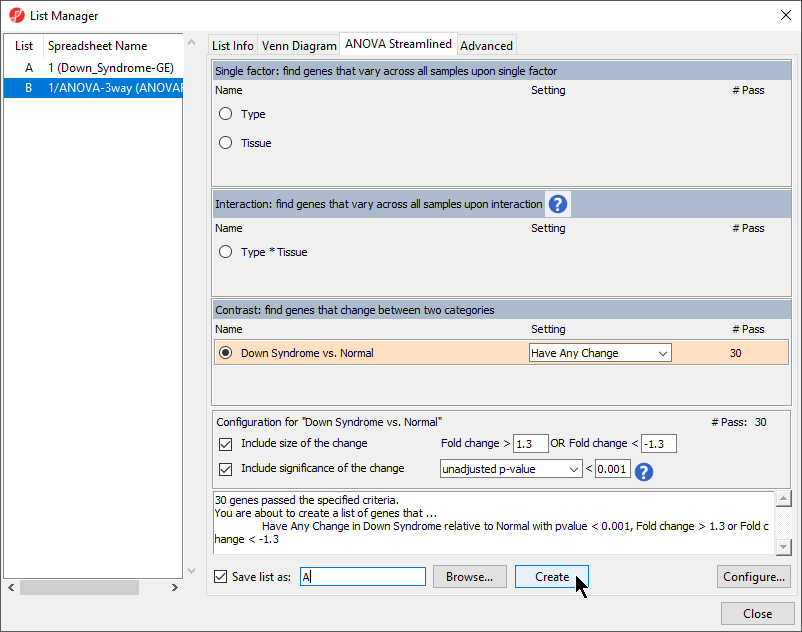
Figure 1. Creating a gene list from ANOVA results
The spreadsheet Down_Syndrome_vs_Normal (A) will be created as a child spreadsheet under the Down_Syndrome-GE spreadsheet.
This gene list spreadsheet can now be used for further analysis such as hierarchical clustering, gene ontology, integration of copy number data, or be exported into other data analysis tools such as pathway analysis.
You can practice creating new gene list criteria of your own to become familiar with the List Manager tool. For more information, you can always click on the (![]() ) buttons.
) buttons.
Creating a gene list from a volcano plot
Next, we will generate a list of genes that passed a p-value threshold of 0.05 and fold-changes greater than 1.3 using a volcano plot.
- Select the 1/ANOVA-3way (ANOVAResults) spreadsheet in the Analysis tab. This is the spreadsheet our gene list will be drawn from
- Select View > Volcano Plot from the Partek Genomics Suite main menu (Figure 2)
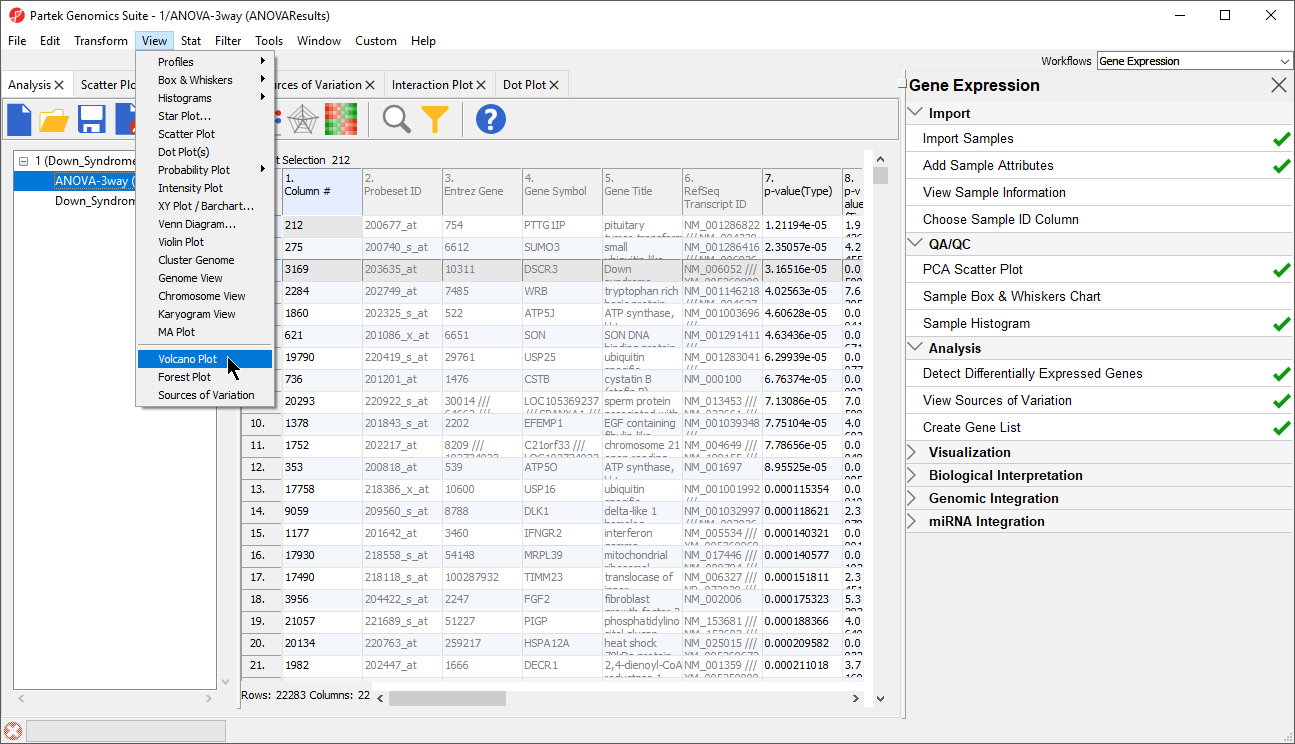
Figure 2. Generating a Volcano Plot from ANOVA results
- Set X Axis (Fold-Change) to 12. Fold-Change(Down Syndrome vs. Normal), and the Y axis (p-value) to be 10. p-value(Down Syndrome vs. Normal)
- Select OK to generate a Volcano Plot tab for genes in the ANOVA spreadsheet (Figure 3)
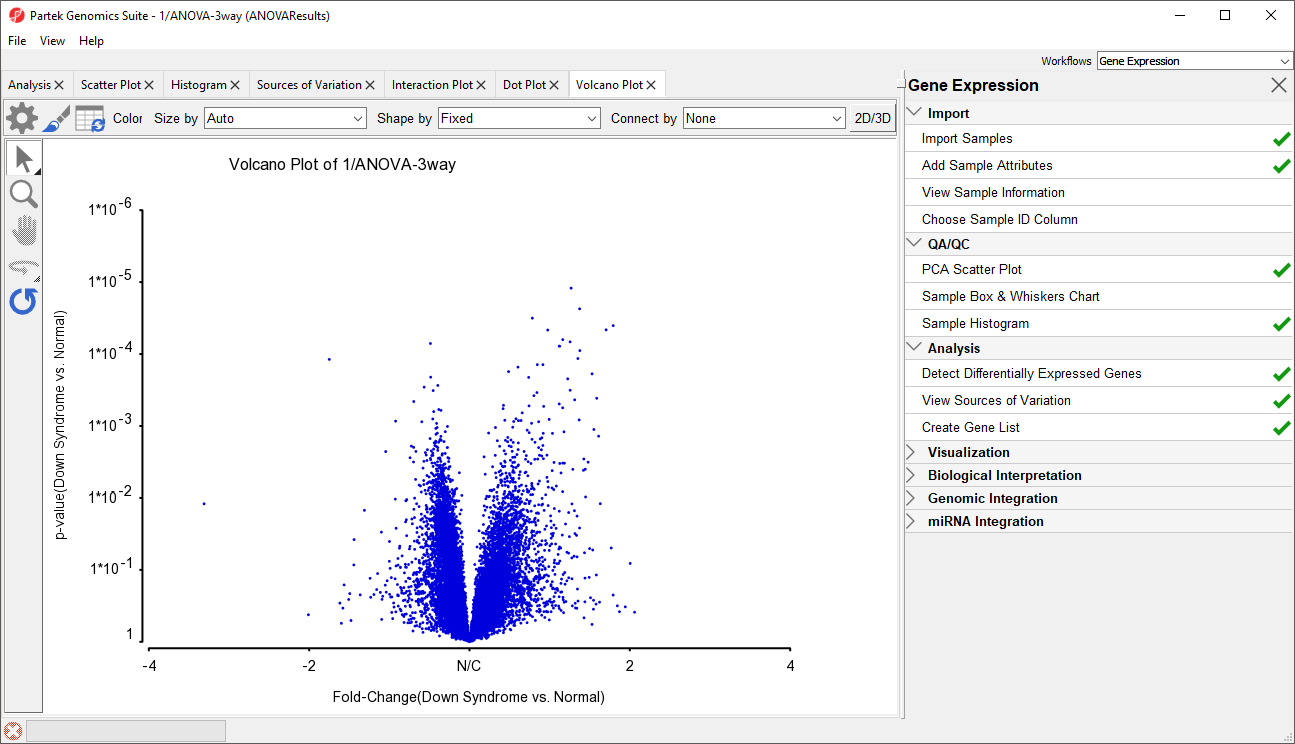
Figure 3. Volcano plot generated from ANOVA spreadsheet
In the plot, each dot represents a gene. The X-axis represents the fold change of the contrast (Down syndrome vs. Normal), and the Y-axis represents the range of p-values. The genes with increased expression in Down syndrome samples are on the right side of the N/C (no change) line; genes with reduced expression in Down syndrome samples are on the left. The genes become more statistically significant with increasing Y-axis position. The genes that have larger and more significant changes between the Down syndrome and normal groups are on the upper right and upper left corner.
In order to select the genes by fold-change and p-value, we will draw a horizontal line to represent the p-value 0.05 and two vertical lines indicating the –1.3 and 1.3-fold changes (cutoff lines).
- Select Rendering Properties (
 )
) - Choose the Axes tab
- Check Select all points in a section to allow Partek Genomics Suite to automatically select all the points in any given section
- Select the Set Cutoff Lines button and configure the Set Cutoff Lines dialog as shown (Figure 4)
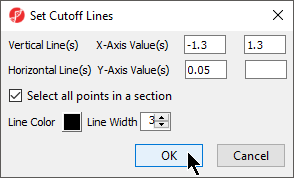
Figure 4. Setting cutoff lines for -1.3 to 1.3 fold changes and a p-value of 0.05
- Select OK to draw the cutoff lines
- Select OK in the Plot Rendering Properties dialog to close the dialog and view the plot
The plot will be divided into six sections. By clicking on the upper-right section, all genes in that section will be selected.
- Right-click on the selected region in the plot and choose Create List to create a list including the genes from the section selected (Figure 5). Note that these p-values are uncorrected
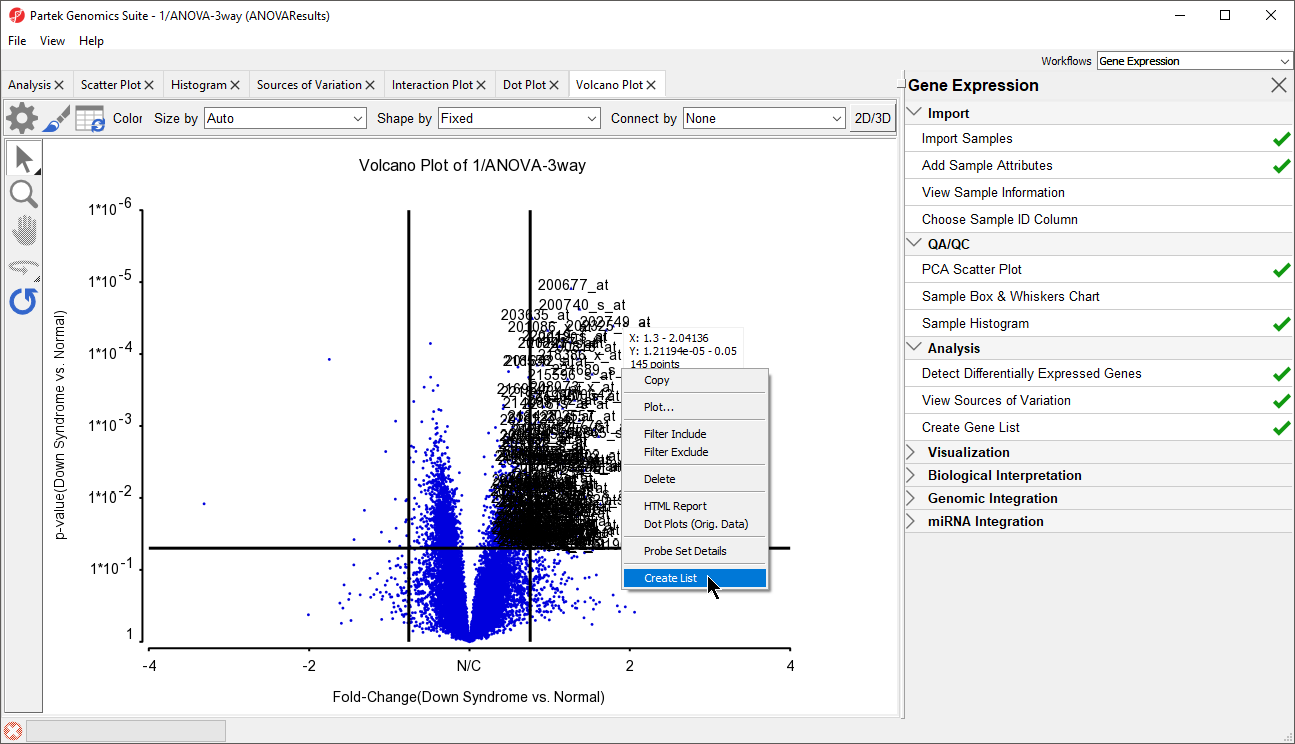
Figure 5. Creating a gene list from a volcano plot
Note: If no column is selected in the parent (ANOVA) spreadsheet, all of the columns will be included in the gene list; if some columns are selected, only the selected columns will be included in the list.
- Specify a name for the gene list (example: volcano plot list) and write a brief description about the list.
The description is shown when you right-click on the spreadsheet > Info > Comments. Here, I have named the list "volcano plot list" and described it as "Genes with >1.3 fold change and p-value <0.05" (Figure 6). The list can be saved as a text file (File > Save As Text File) for use in reports or by downstream analysis software.
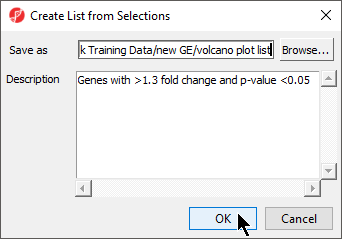
Figure 6. Saving a list created from a volcano plot
Additional Assistance
If you need additional assistance, please visit our support page to submit a help ticket or find phone numbers for regional support.


| Your Rating: |
|
Results: |

|
37 | rates |
Overview
Content Tools