| Name
|
Size
|
Creator |
Creation Date
|
Last Modification Date
|
Labels |
Attached To |
|
PNG File appendix1.png |
102 kB |
Paul Fullerton |
Jun 30, 2017 15:20 |
Jun 30, 2017 16:03 |
|
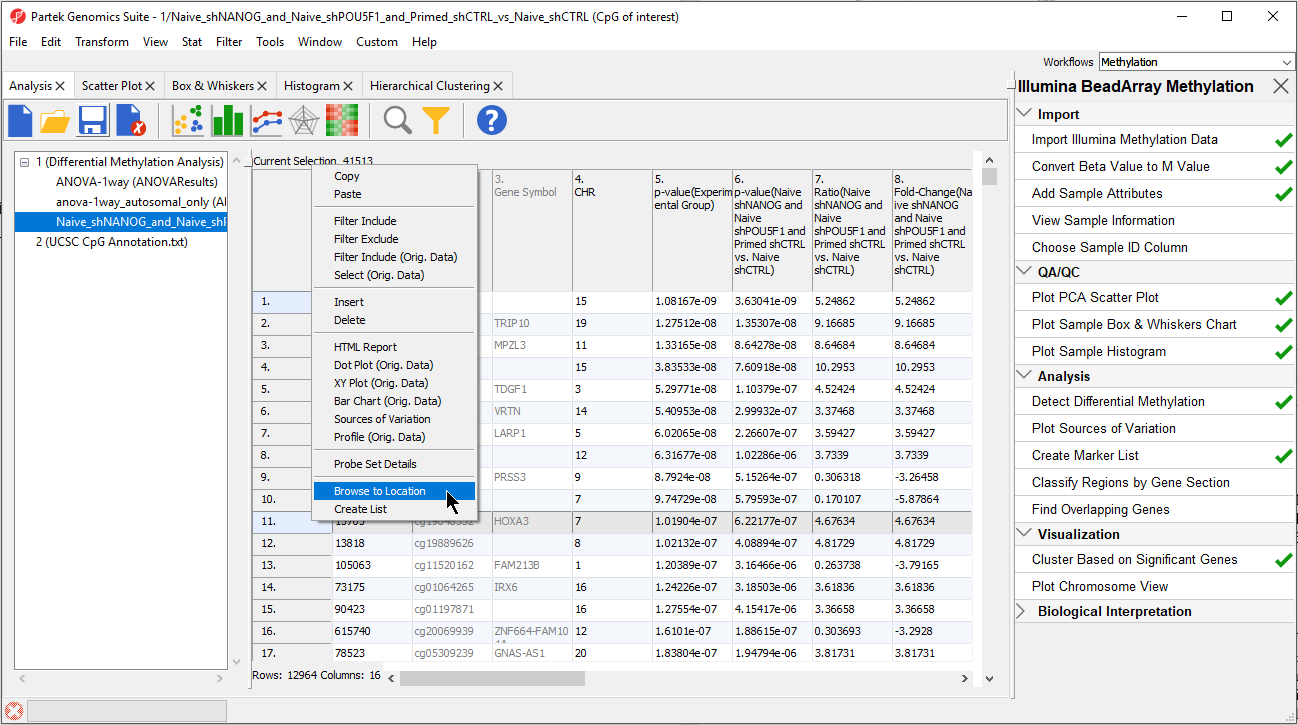
Page: Visualize methylation at each locus
|
|
PNG File appendix1.png |
102 kB |
Paul Fullerton |
Jul 05, 2017 15:16 |
Jul 05, 2017 15:16 |
|
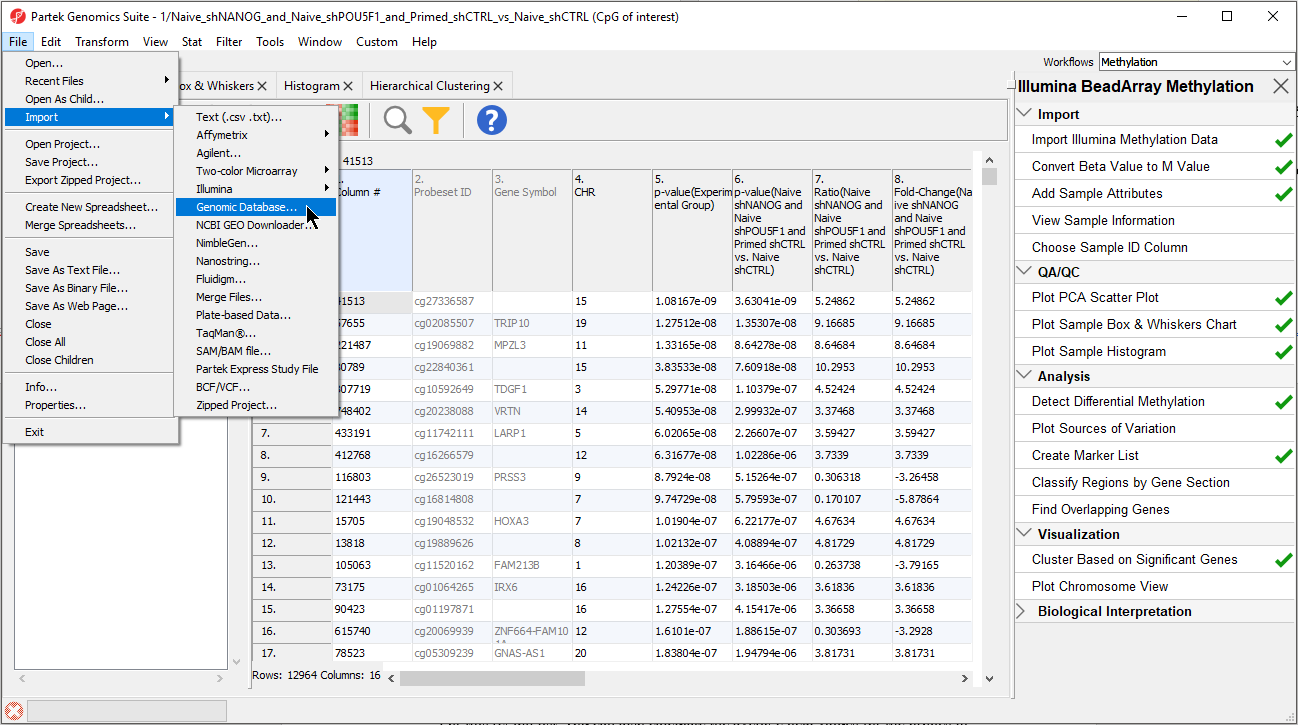
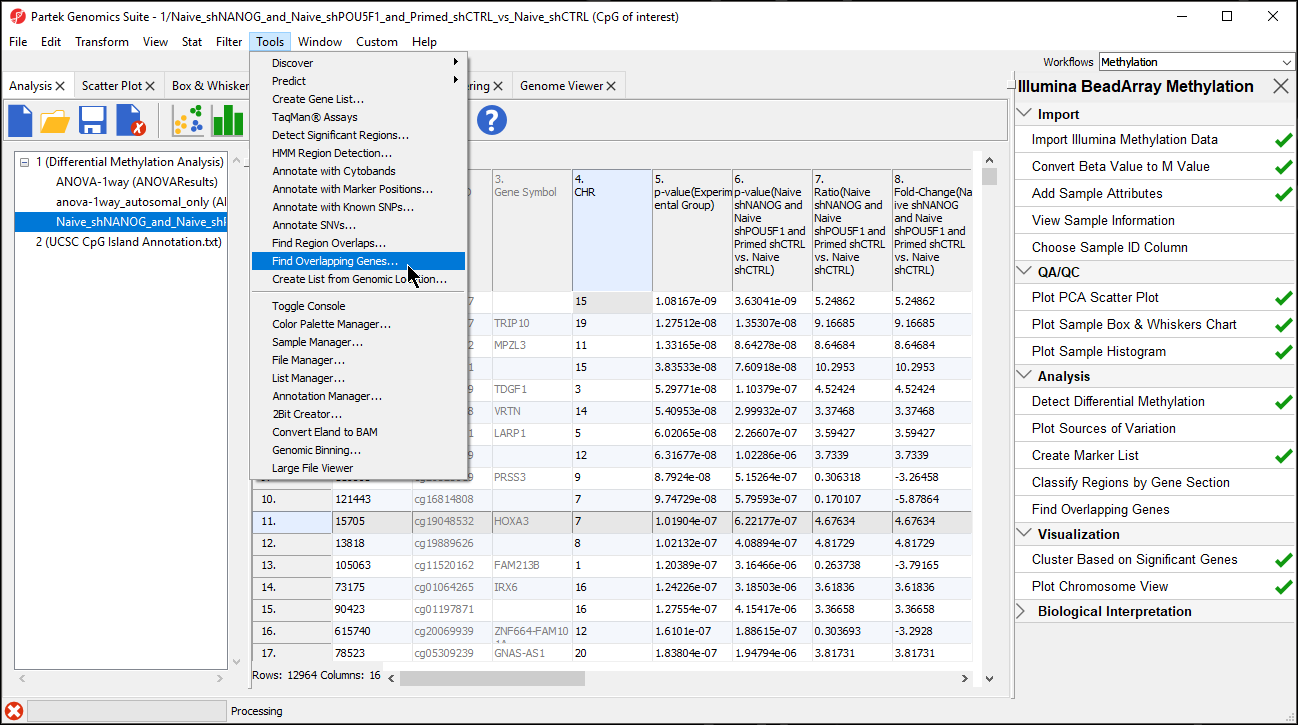
Page: Optional: Add UCSC CpG island annotations
|
|
PNG File 2017-08-29 16_11_41-Partek Genomics Suite - 1_E2_v… |
102 kB |
Paul Fullerton |
Aug 29, 2017 16:11 |
Aug 29, 2017 16:13 |
|
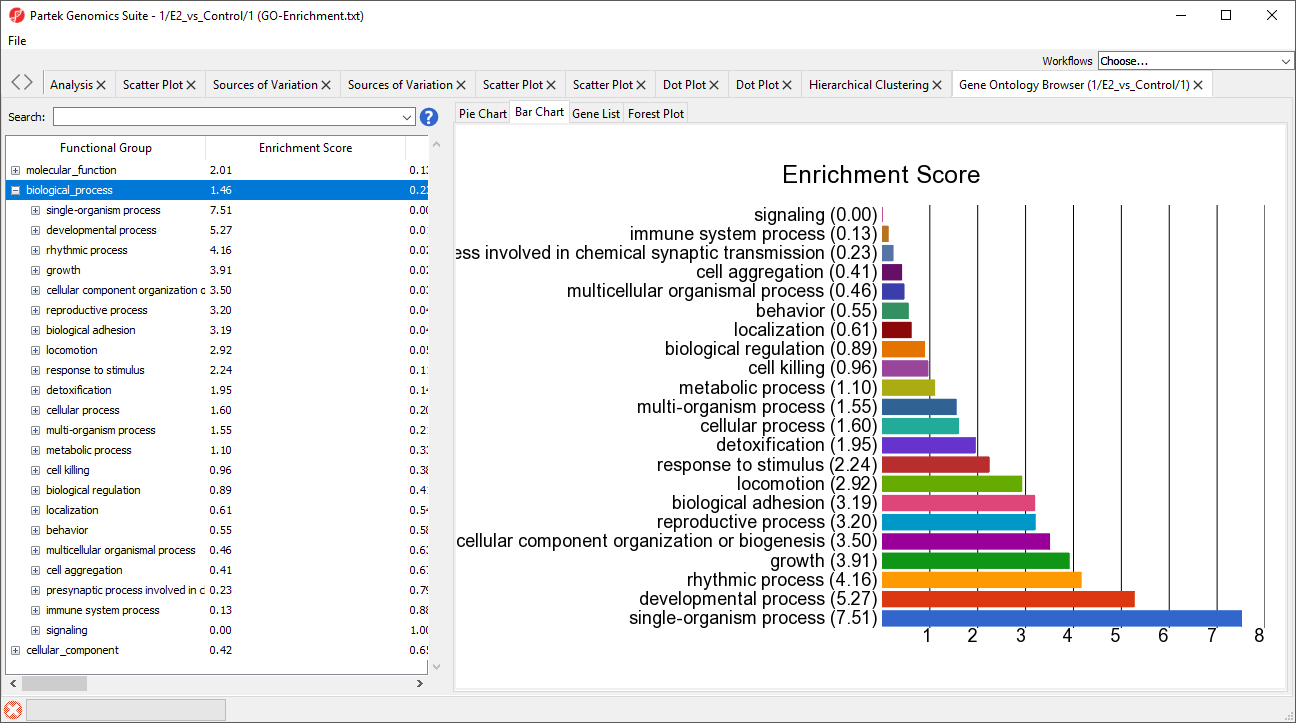
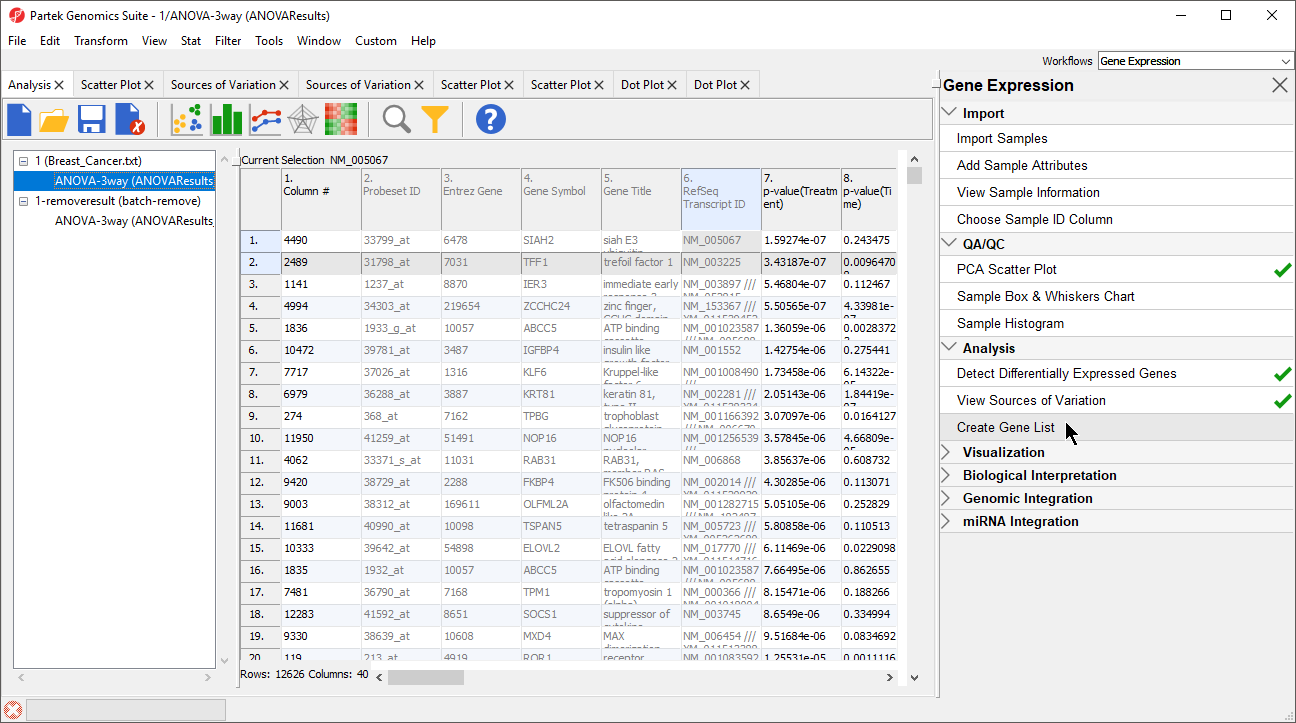
Page: GO enrichment using a gene list
|
|
PNG File 2017-07-05 12_04_46-.png |
102 kB |
Paul Fullerton |
Jul 05, 2017 14:51 |
Jul 05, 2017 14:51 |
|
Page: Filter loci with the interactive filter
|
|
PNG File model_selection_varsel.png |
102 kB |
Xiaowen Wang |
Aug 03, 2017 13:59 |
Aug 04, 2017 10:11 |
|
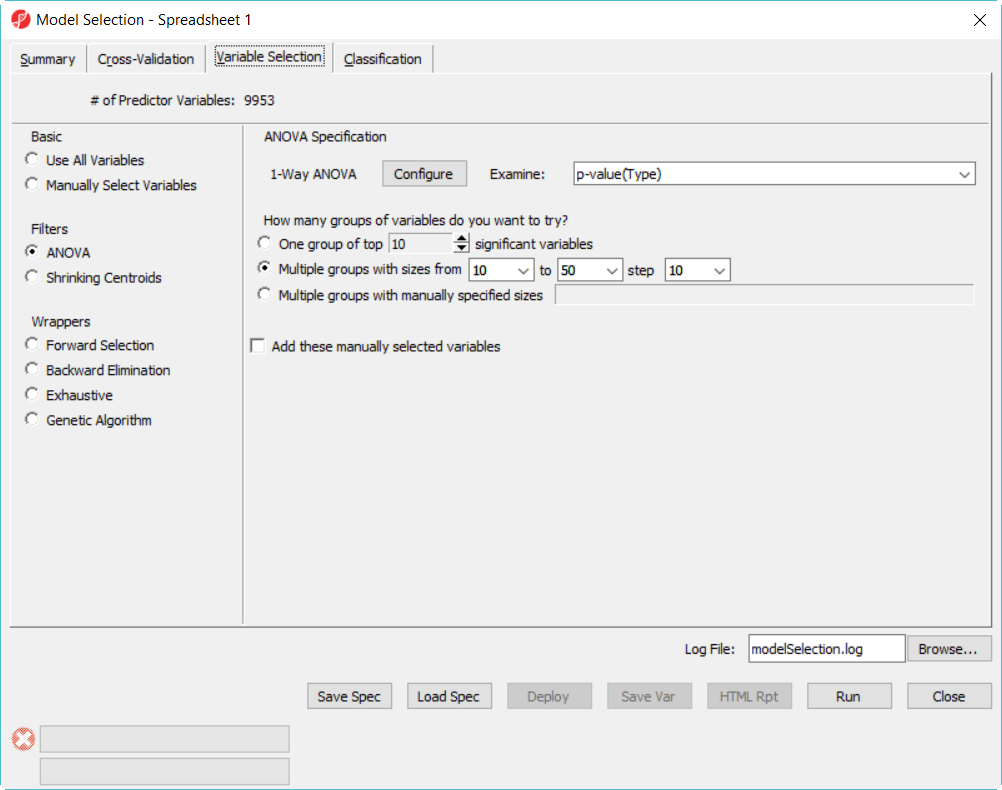
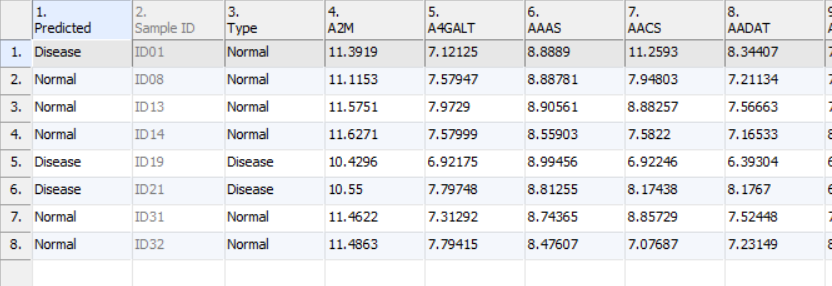
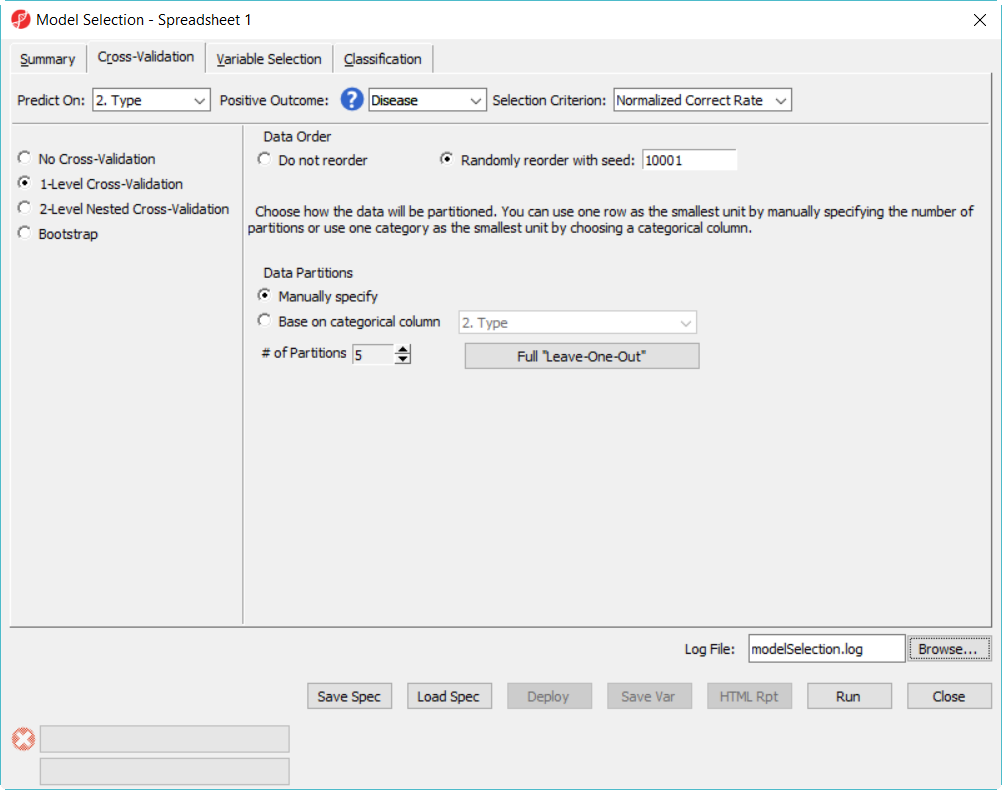
Page: Model Selection Tool
|
|
PNG File 2017-08-22 10_56_07-Partek Pathway - Synaptic vesi… |
101 kB |
Paul Fullerton |
Aug 22, 2017 10:56 |
Aug 22, 2017 10:56 |
|
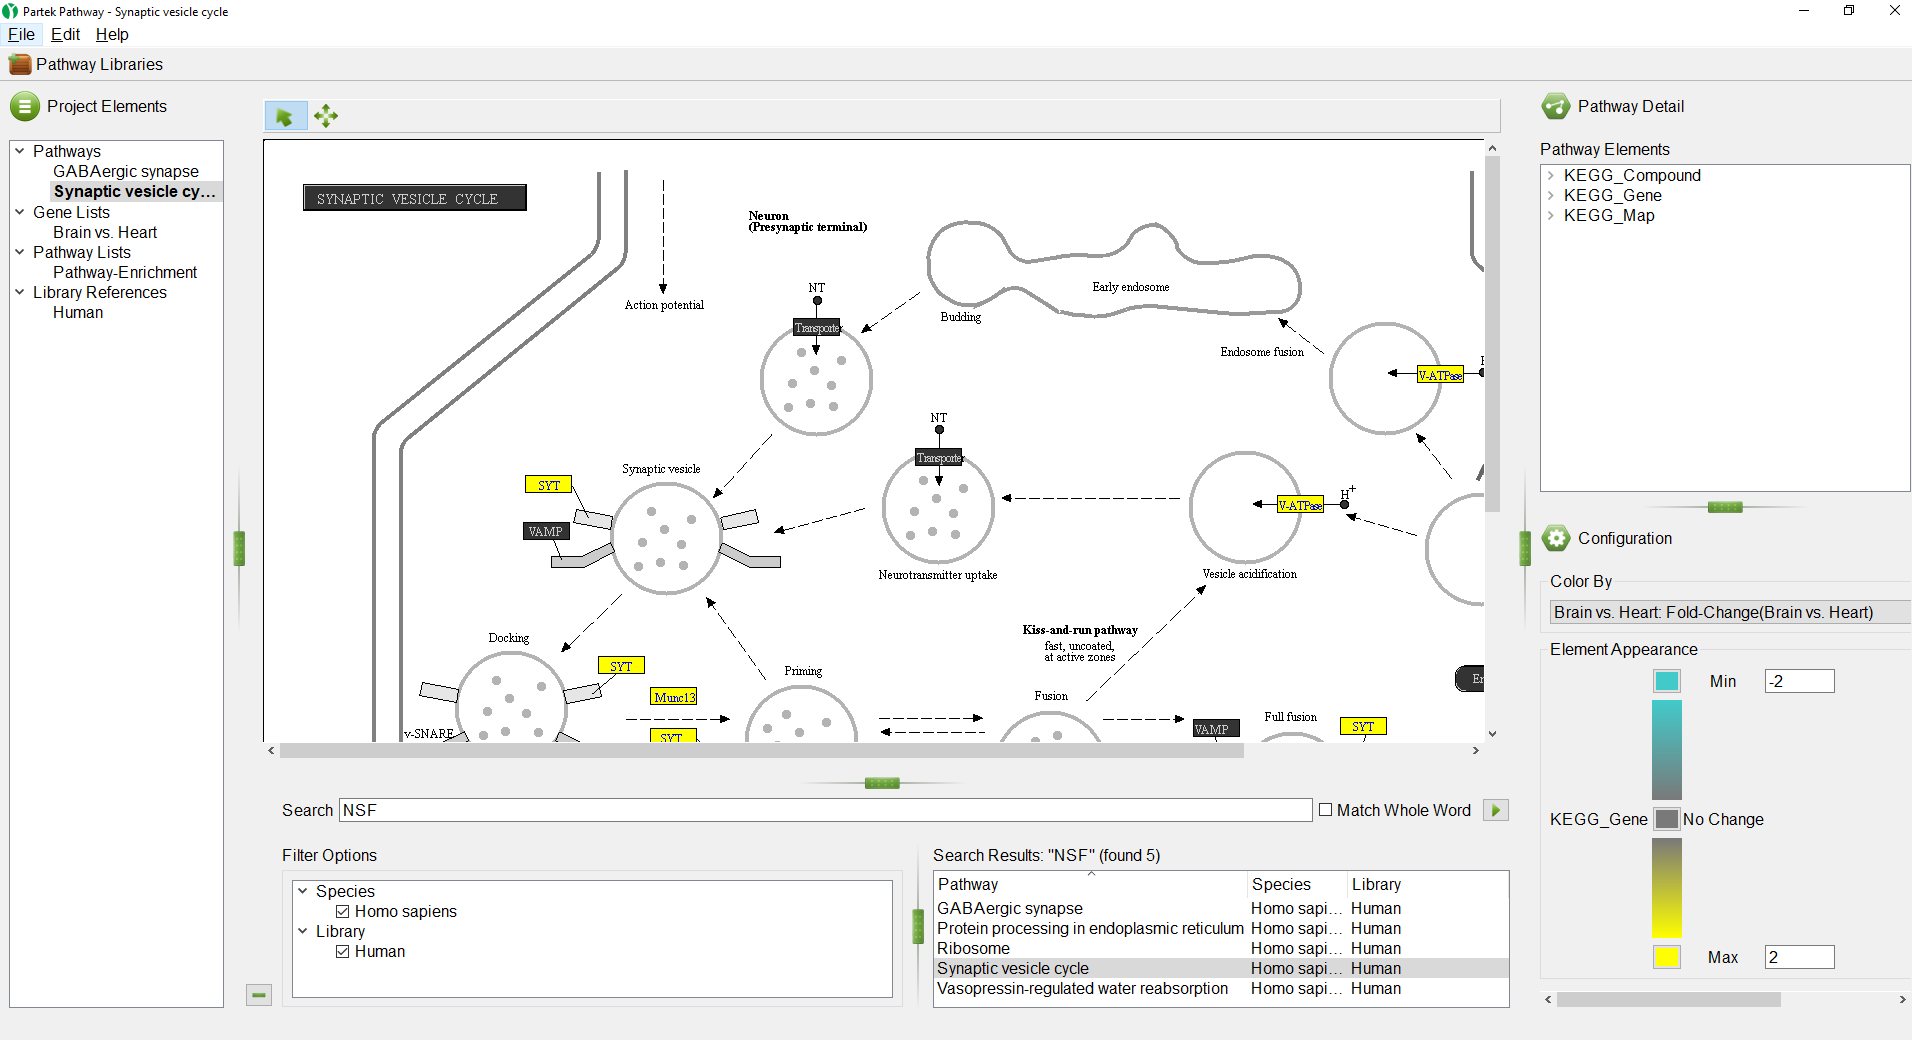
Page: Analyzing pathway enrichment in Partek Pathway
|
|
PNG File 2017-08-16 10_53_27-Partek Genomics Suite - 1 (Bre… |
101 kB |
Paul Fullerton |
Aug 16, 2017 10:53 |
Aug 16, 2017 12:20 |
|
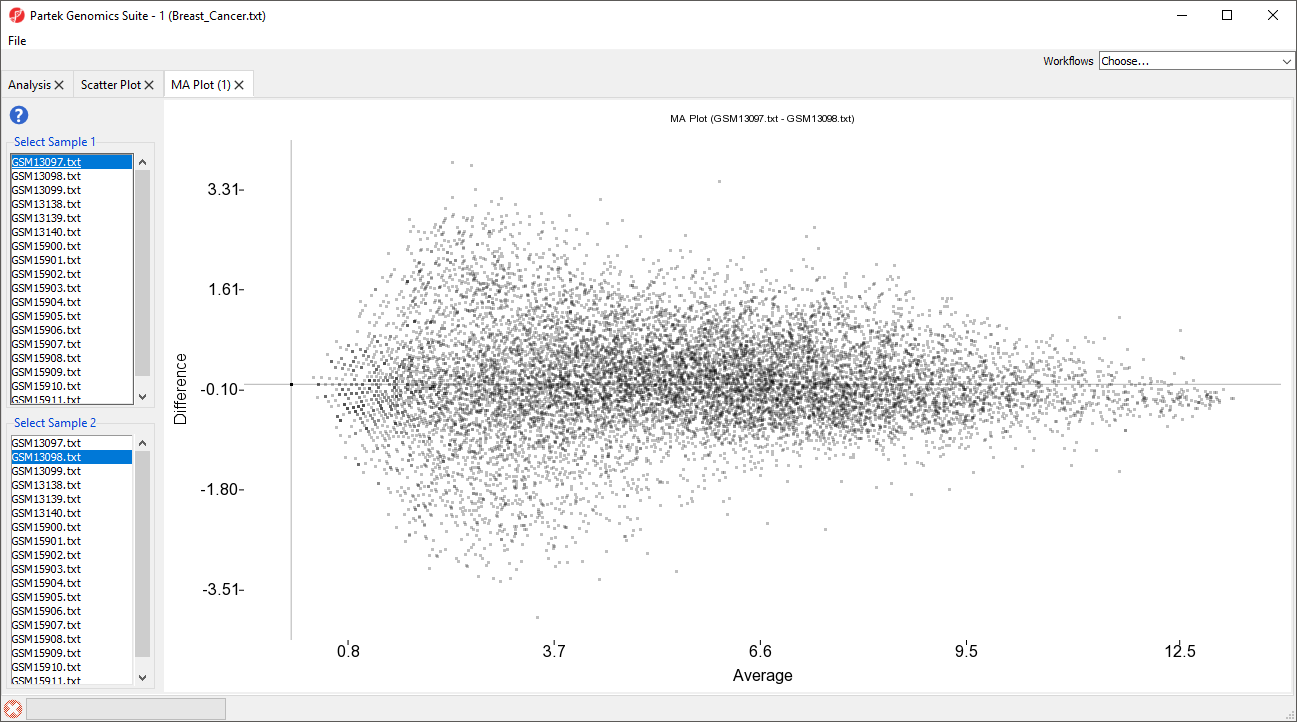
Page: Scatter Plot and MA Plot
|
|
PNG File 2017-08-15 16_53_20-Partek Genomics Suite - 1_1 (A… |
101 kB |
Paul Fullerton |
Aug 16, 2017 08:46 |
Aug 16, 2017 08:46 |
|
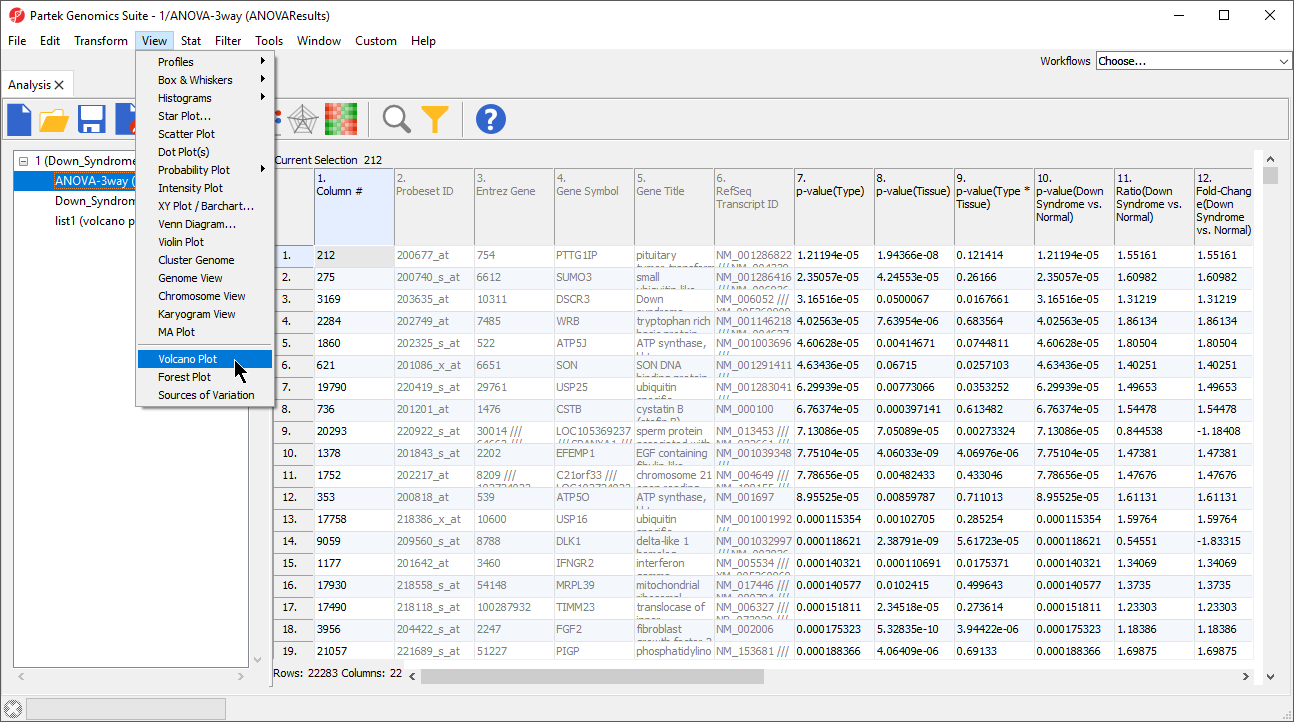
Page: Volcano Plot
|
|
PNG File SettingGOANOVA.png |
101 kB |
Ivan Lukic |
Jul 20, 2017 03:25 |
Jul 20, 2017 03:25 |
|
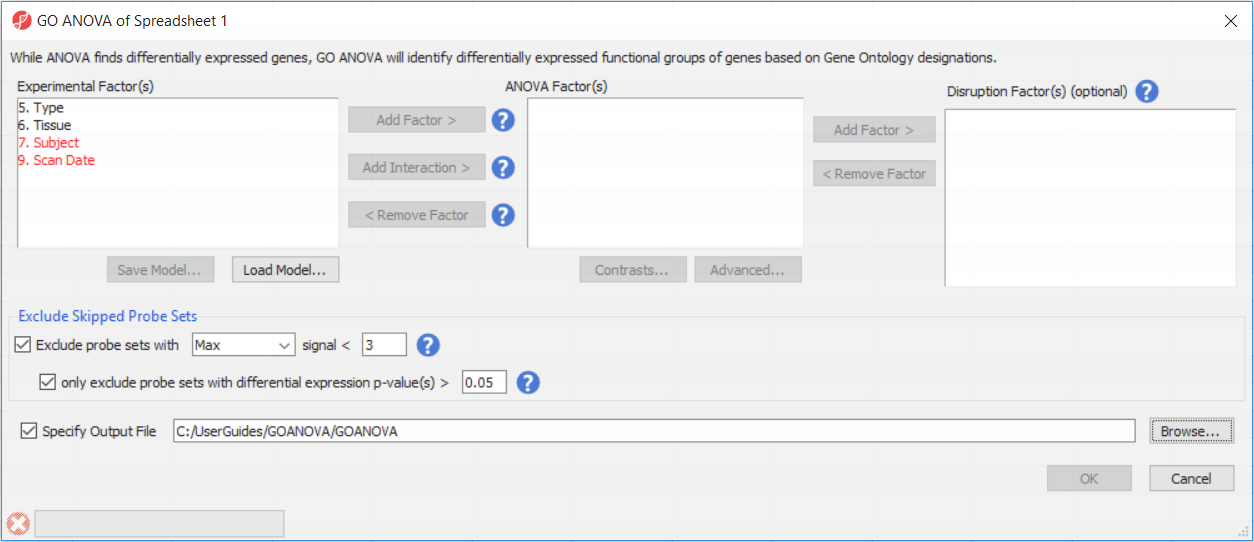
Page: Configuring the GO ANOVA Dialog
|
|
PNG File 2017-08-07 09_27_36-Partek Genomics Suite - 1_ANOV… |
101 kB |
Paul Fullerton |
Aug 07, 2017 09:29 |
Aug 07, 2017 09:29 |
|
Page: Identifying differentially expressed genes using ANOVA
|
|
PNG File 2017-08-08 16_47_49-Partek Genomics Suite - 2_ANOV… |
101 kB |
Paul Fullerton |
Aug 08, 2017 16:52 |
Aug 08, 2017 16:52 |
|
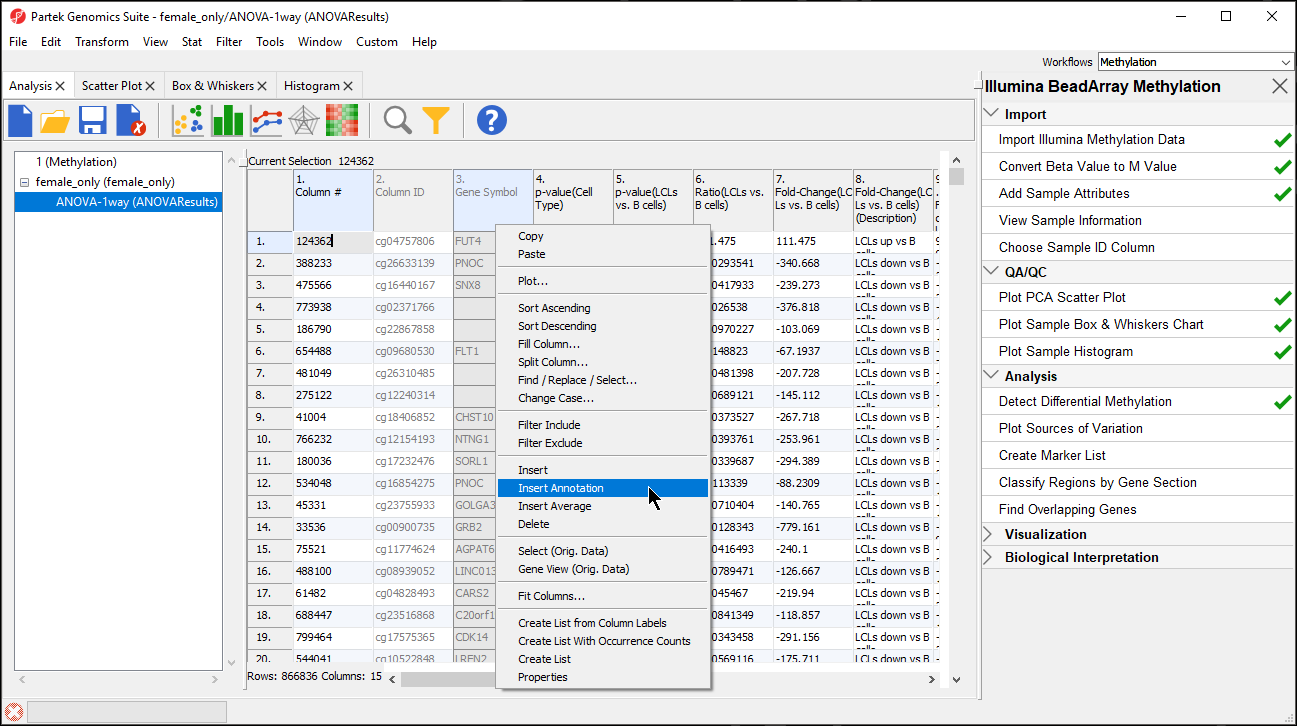
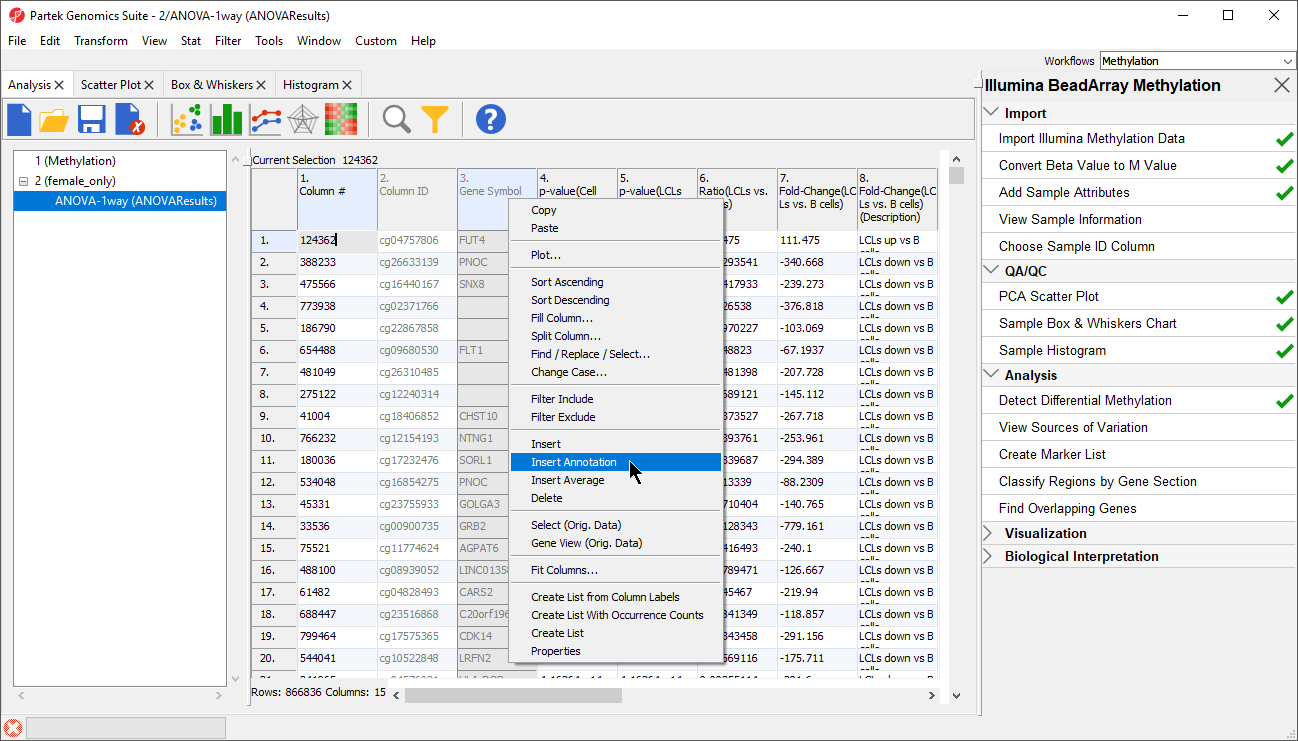
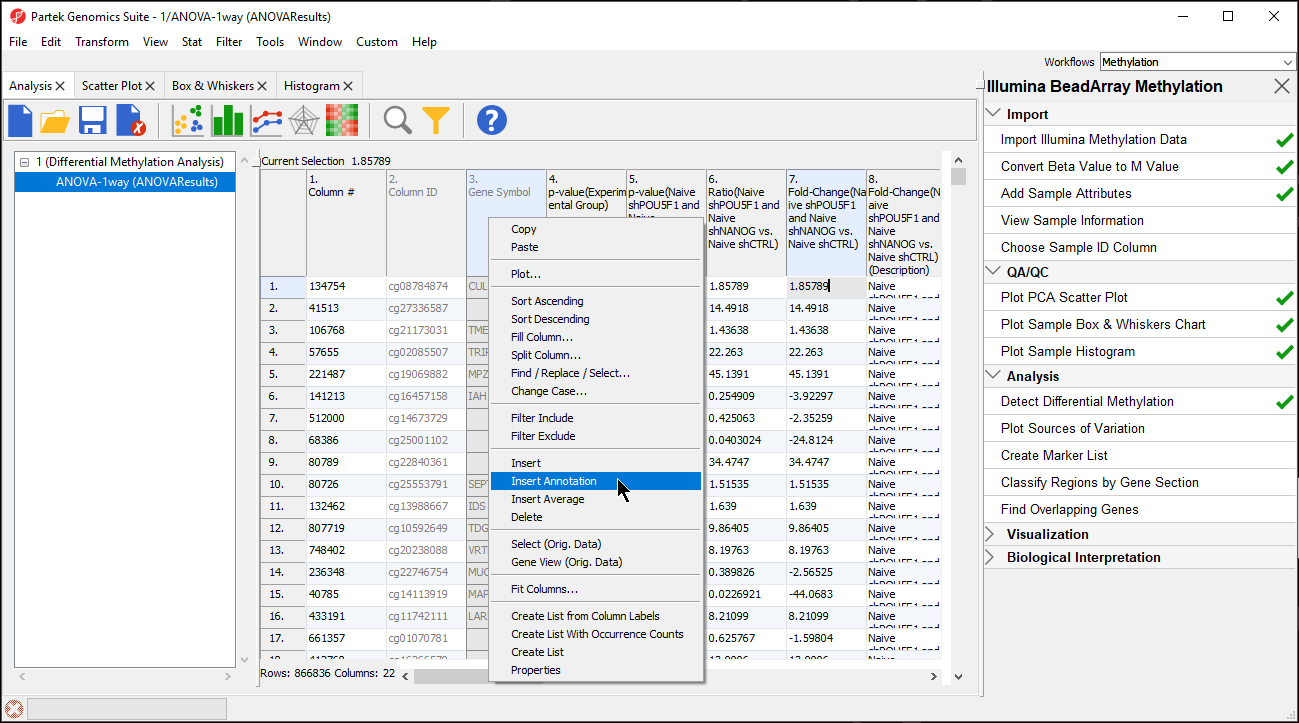
Page: Filter loci with the interactive filter
|
|
PNG File 2017-08-29 14_35_32-Partek Genomics Suite - 1_ANOV… |
101 kB |
Paul Fullerton |
Aug 29, 2017 14:37 |
Aug 29, 2017 15:05 |
|
Page: Creating a gene list using the Venn Diagram
|
|
PNG File 2017-08-15 13_39_52-Partek Genomics Suite - 1_Down… |
101 kB |
Paul Fullerton |
Aug 15, 2017 13:48 |
Aug 15, 2017 14:32 |
|
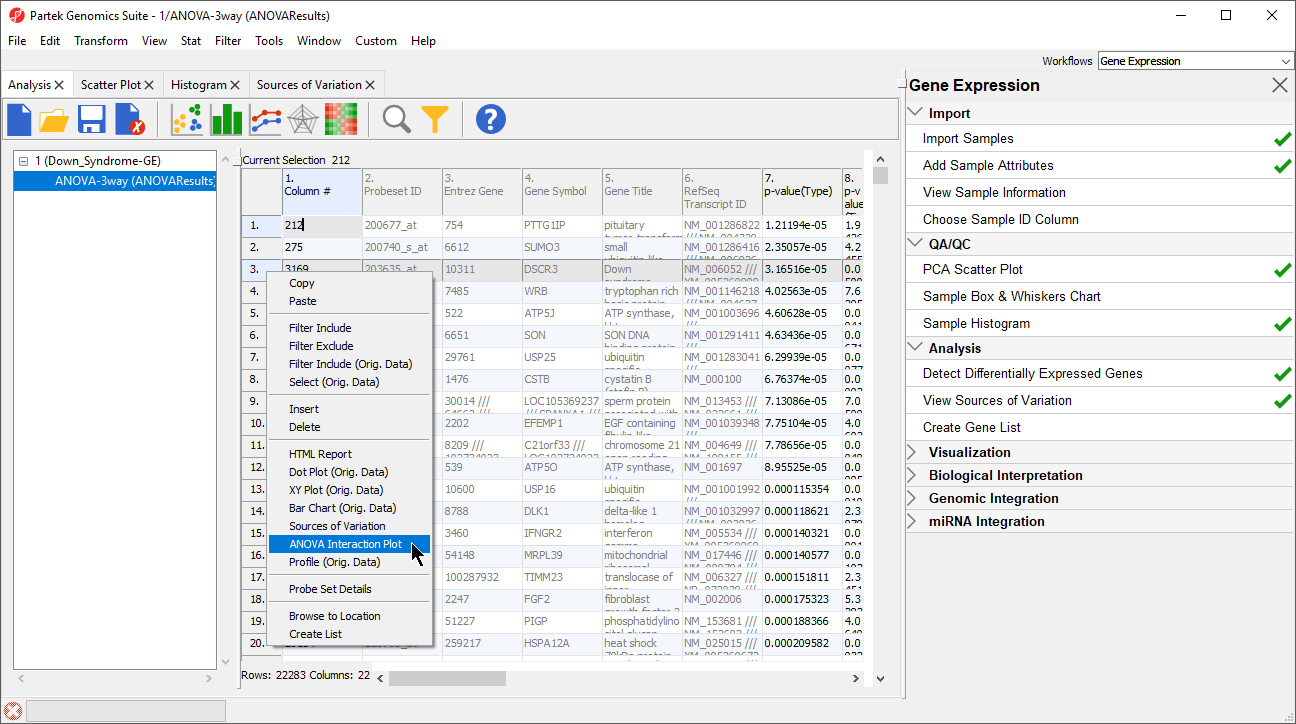
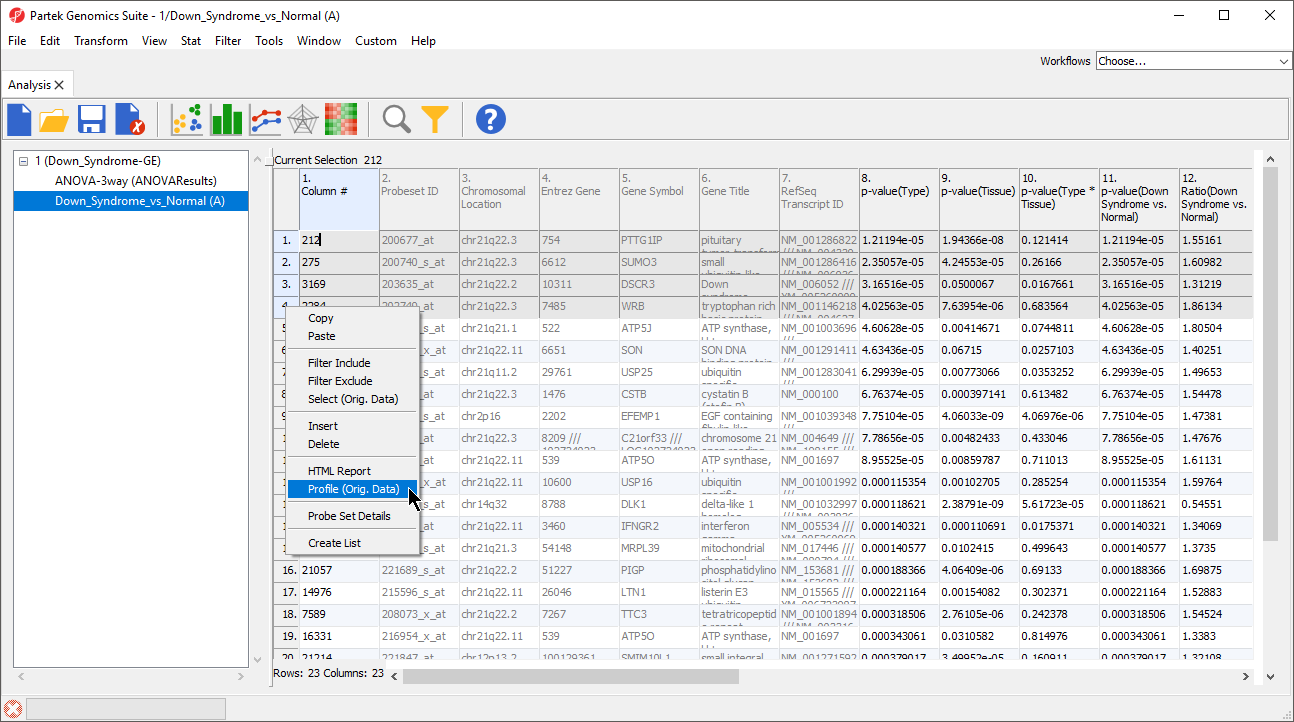
Page: Profile Plot
|
|
PNG File 2017-08-29 13_58_24-Partek Genomics Suite - 1-remo… |
100 kB |
Paul Fullerton |
Aug 29, 2017 13:58 |
Aug 29, 2017 13:58 |
|
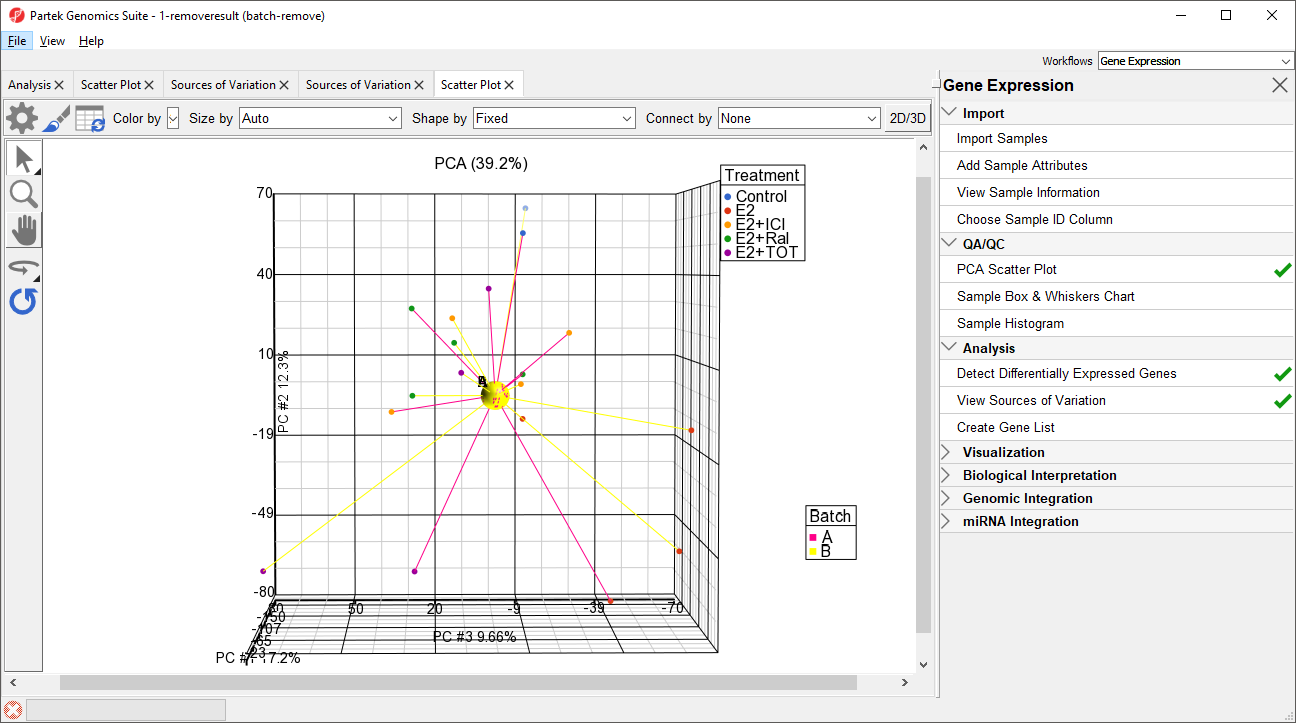
Page: Removing batch effects
|
|
PNG File 2017-08-15 15_38_19-Partek Genomics Suite - 1_Trea… |
100 kB |
Paul Fullerton |
Aug 15, 2017 15:40 |
Aug 15, 2017 16:32 |
|
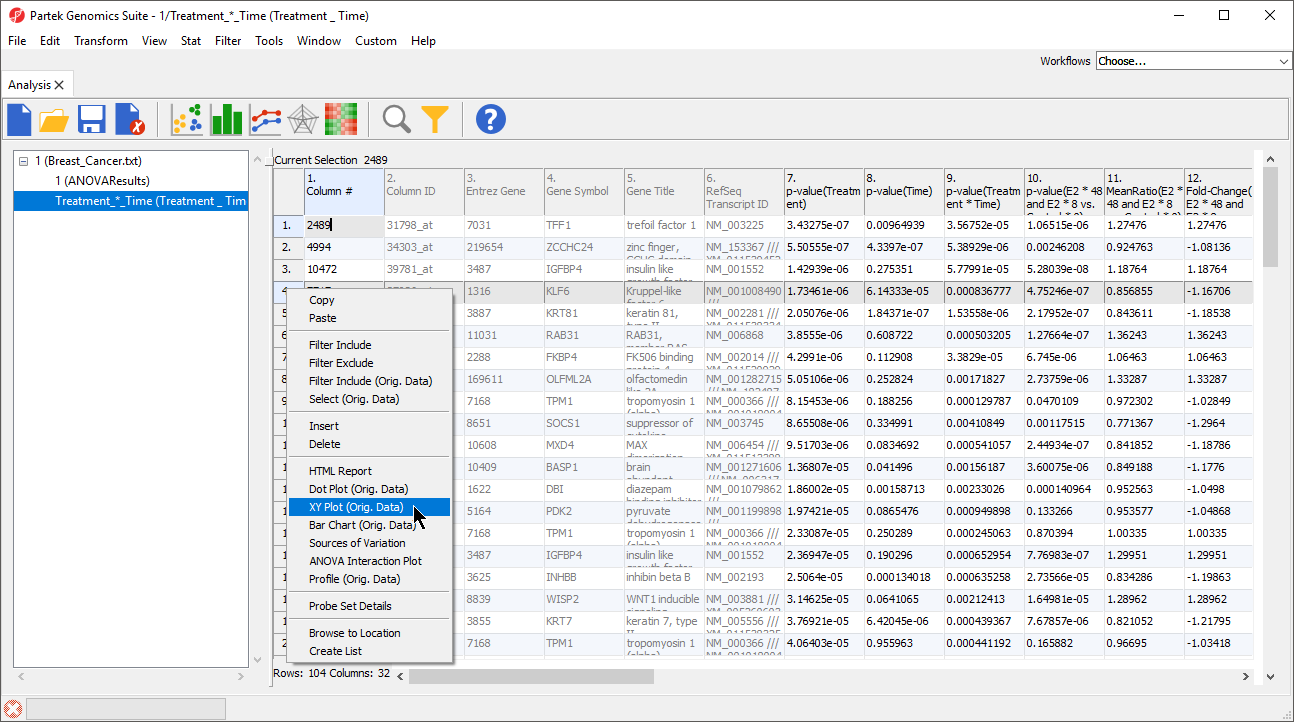
Page: XY Plot / Bar Chart
|
|
PNG File figure34.png |
99 kB |
Paul Fullerton |
Jun 30, 2017 16:23 |
Jun 30, 2017 16:58 |
|
Page: Perform gene set and pathway analysis
|
|
PNG File model_selection_test_spreadsheet.png |
98 kB |
Xiaowen Wang |
Aug 07, 2017 13:39 |
Aug 07, 2017 13:39 |
|
Page: Model Selection Tool
|
|
PNG File figure32.png |
98 kB |
Paul Fullerton |
Jun 30, 2017 16:00 |
Jun 30, 2017 16:03 |
|
Page: Visualize methylation at each locus
|
|
PNG File figure20.png |
98 kB |
Paul Fullerton |
Jun 30, 2017 10:14 |
Jun 30, 2017 10:55 |
|
Page: Filter loci with the interactive filter
|
|
PNG File model_selection_cv.png |
97 kB |
Xiaowen Wang |
Aug 03, 2017 13:27 |
Aug 04, 2017 10:11 |
|
Page: Model Selection Tool
|