To perform gene set and pathway analysis, we need to create a list of genes that overlap with differentially methylated CpG loci.
- Select LCLs_vs_B_cells_CpG_Islands in the spreadsheet tree
- Select Find Overlapping Genes from the Analysis section of the workflow
The Output Overlapping Features dialog will open (Figure 1). This dialog allows you to choose the annotation database that will define where gene are located. By default the promoter region will be defined as 5000 base pairs upstream and 3000 base pairs downstream from the transcription start site.
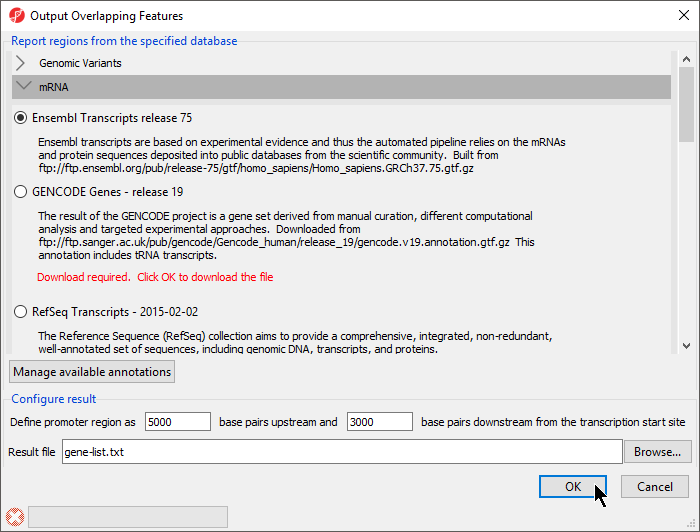 Figure 1. Selecting Finding Overlapping Genes form the main toolbar
- Select Ensembl Transcripts release 75 from the Report regions from the specified database options
- You can select a name for the new list, we have named it gene-list
- Select OK
A new spreadsheet will be created as a child spreadsheet (Figure 2)
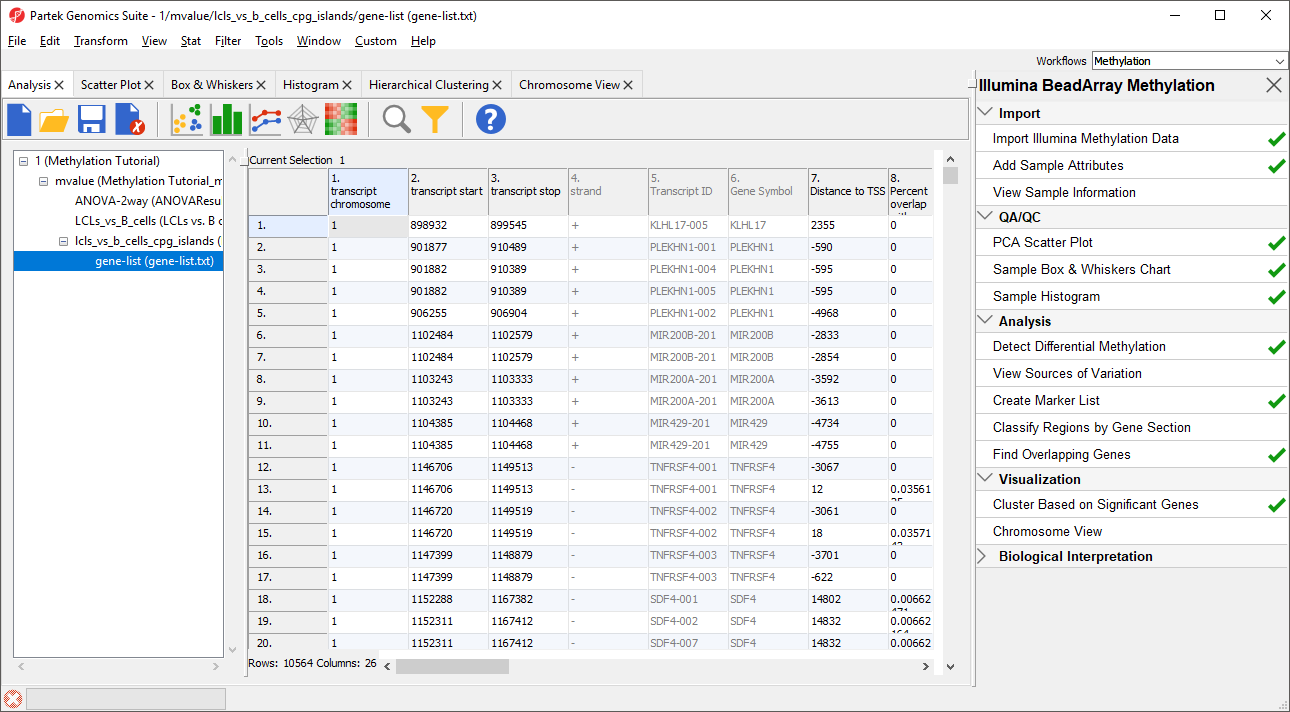 Figure 2. Annotating the differentially methylated CpG loci with genes
Partek Genomics Suite offers several tools to help interpret this list of genes. First, let's look at Gene Set Analysis.
Figure 2. Annotating the differentially methylated CpG loci with genes
Partek Genomics Suite offers several tools to help interpret this list of genes. First, let's look at Gene Set Analysis.
- Select Gene Set Analysis from the Biological Interpretation section of the Illumina BeadArray Methylation workflow
- Select GO Enrichment for Select the method of analysis
- Select Next >
- Select 1/mvalue/lcls_vs_b_cells_cpg_islands/gene-list (gene-list.txt) for the source spreadsheet
- Select Next >
- Select Invoke gene ontology browser on the result and leave the rest of the options set to defaults for Configure the parameters of the test (Figure 3)
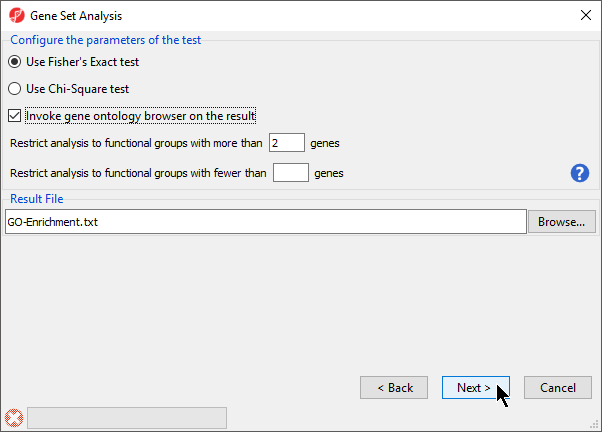
Figure 3. Configuring the parameters of the test
- Select Next >
- Select Default Mapping File for Select the method of mapping genes to genes sets
- Select Next >
A new spreadsheet will be created with categories ranked by enrichment score and the Gene Ontology Browser will launch to graphically display the results of the spreadsheet (Figure 4). The results show which gene sets are over represented in the list of genes overlapped by differentially regulated CpG loci between the experimental and control groups.
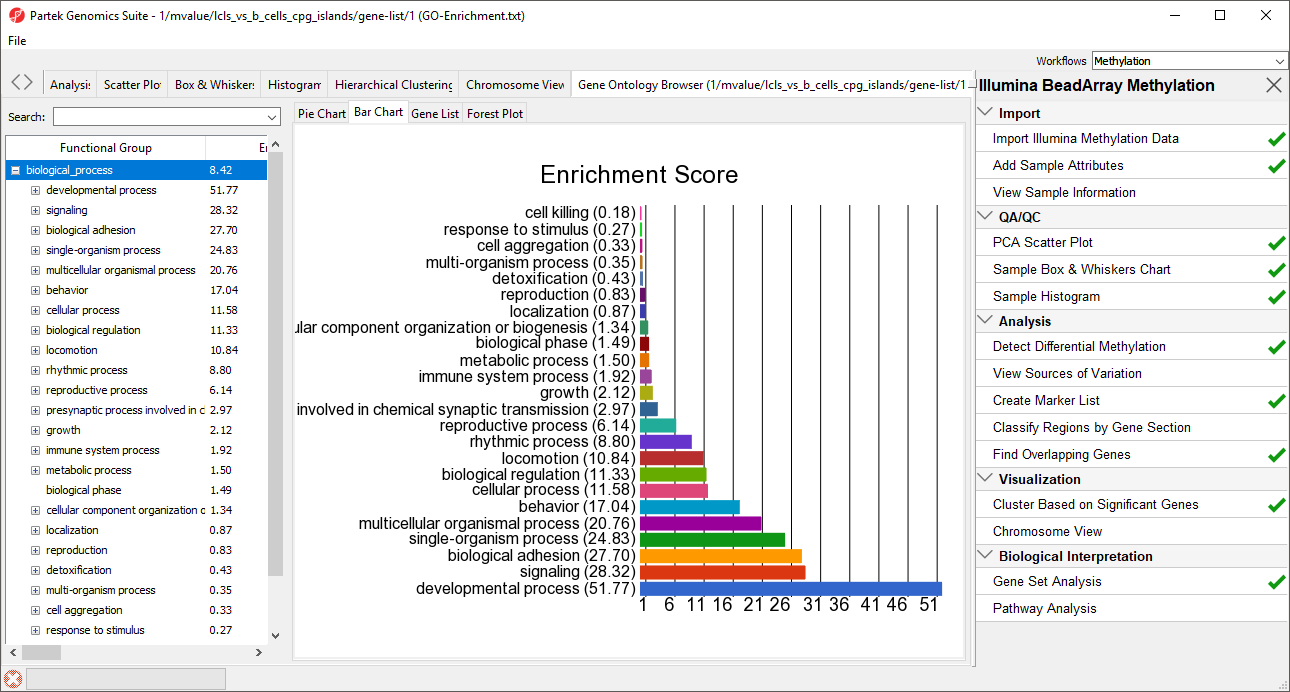 Figure 4. GO enrichment browser showing gene groups overrepresented in the list of genes which overlap with differentially methylated CpG loci
To get a better idea whether genes associated with these GO terms have increated or decreased methylation, we can view the Forest Plot.
Figure 4. GO enrichment browser showing gene groups overrepresented in the list of genes which overlap with differentially methylated CpG loci
To get a better idea whether genes associated with these GO terms have increated or decreased methylation, we can view the Forest Plot.
- Select the Forest Plot tab
Go terms are listed by the number of significantly up-regulated genes, with the percent up-regulated and down-regulated shown in red to green bars. Here, we see that most GO terms show increased methylation in their associated genes (Figure 4).
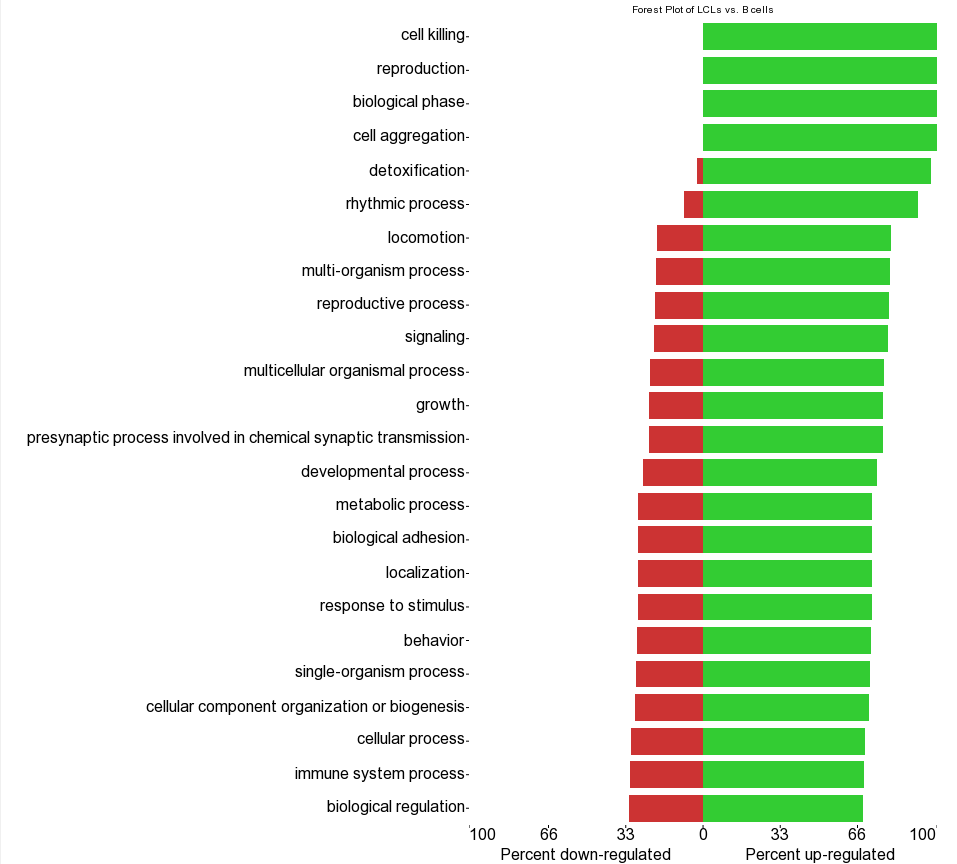
Figure 5. Gene Ontology Forest Plot
Next, we can perform Pathway Analysis to see which pathways are over represented in the gene overlapped by differentially regulated CpG loci.
- Select gene-list from the spreadsheet tree
- Select Pathway Analysis from the Biological Interpretation section of the Illumina BeadArray Methylation workflow
- Select Pathway Enrichment for Select the method of analysis
- Select Next >
- Select 1/mvalue/lcls_vs_b_cells_cpg_islands/gene-list (gene-list.txt) for the source spreadsheet
- Select Next >
- Leave the default selections for the Configure parameters of the test panel
- Select Next >
- Leave the default selections for the Result File and Select the parameters panels
- Select Next > to run the analysis
The Pathway-Enrichment spreadsheet will be added to the spreadsheet tree in Partek Genomics Suite and the Partek® Pathway™ software will open to provide visualization of the most significantly enriched pathway as a pathway diagram (Figure 5). The color of the gene boxes reflects p-values of the associated differentially methylated CpG loci (bright orange is insignificant, blue is highly significant). The Color by option can be changed another column from the gene-list.txt spreadsheet, such as Difference.
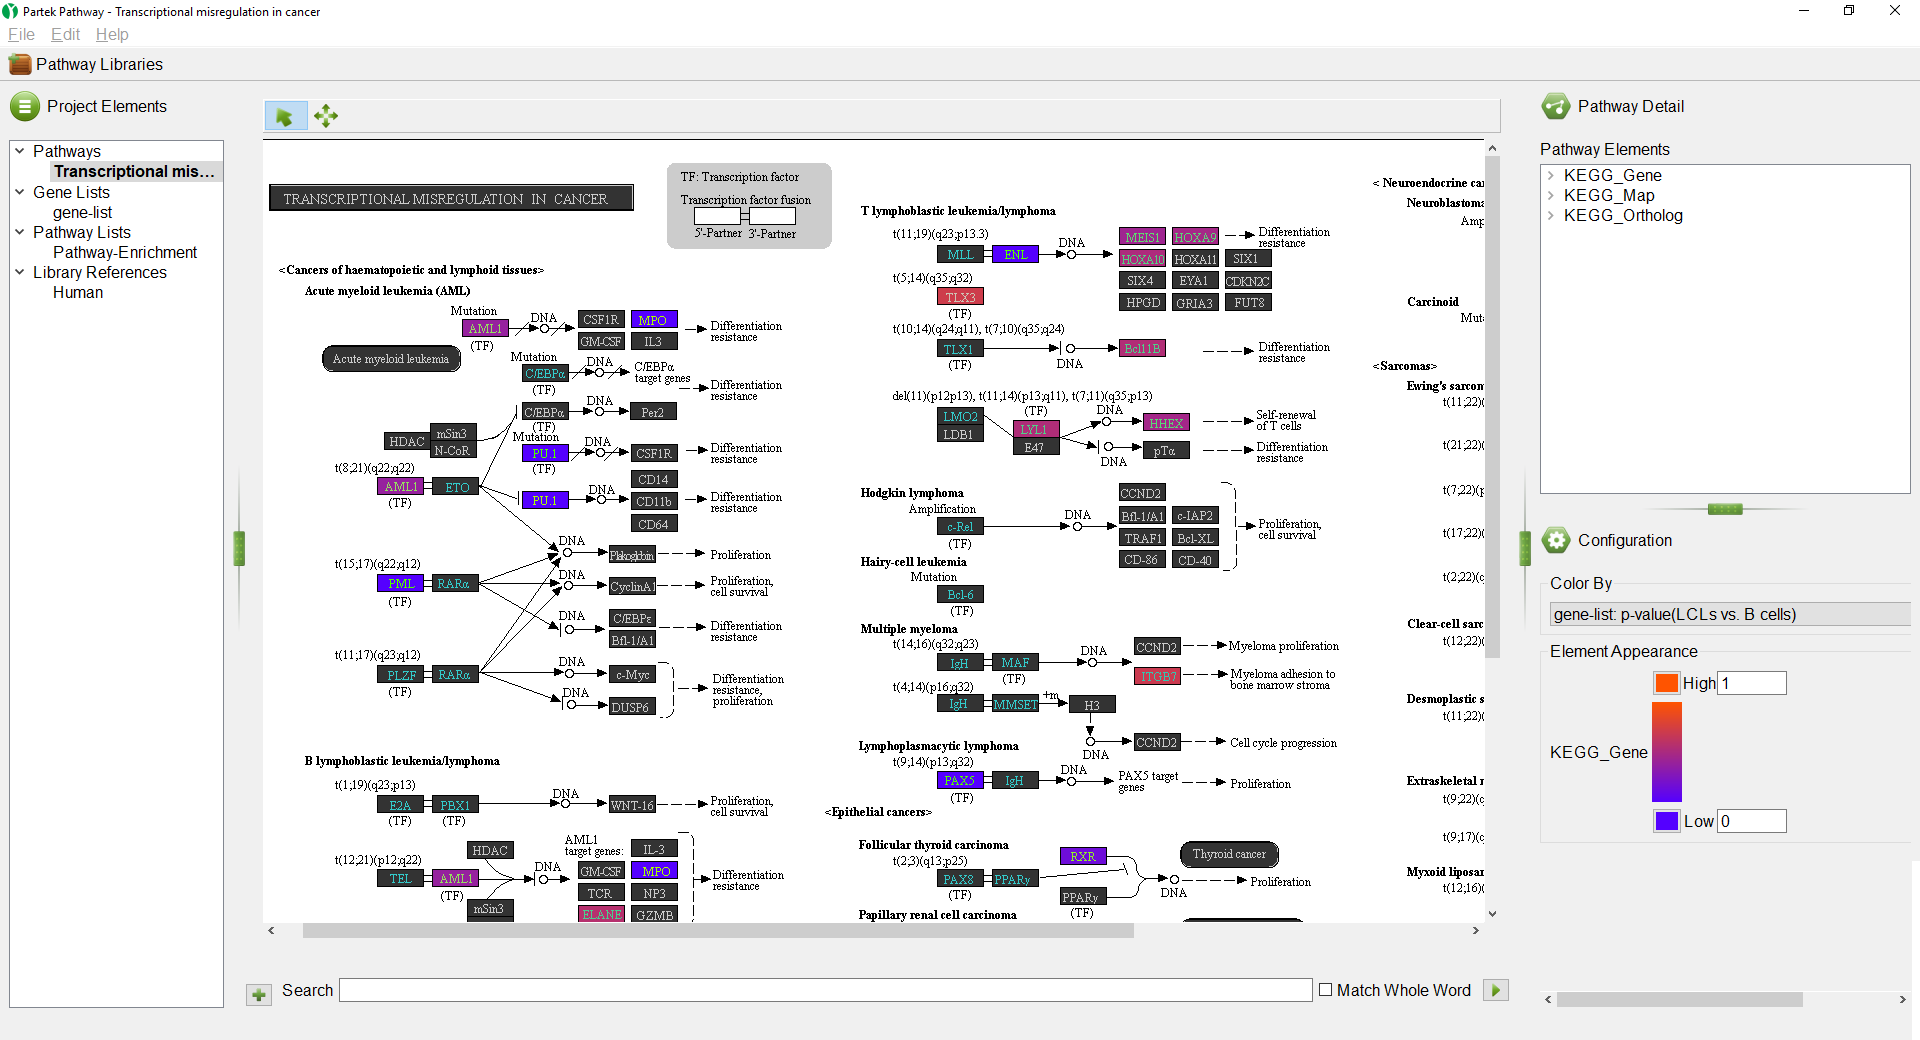
Figure 6. : Partek Pathway illustrating one of the pathways overrepresented in the list of genes overlapping the differentially methylated CpG sites.
The Pathway-Enrichment spreadsheet can also be viewed in Partek Pathway by switching to the Pathway-Enrichment section of the menu tree on the left-hand side of the window. From the spreadsheet view, you can select a pathway name to visualize that pathway. Alternatively, you can open a pathway visualization in Partek Pathway from the Pathway-Enrichment spreadsheet in Partek Genomics Suite by right-clicking on a row and selecting Show pathway... from the pop-up menu. Please note that if you have closed Partek Pathway and have reopened it, you will need to import a gene list if you want to color the visualization by attributes form the gene list. For more information about using Partek Pathway, checkout our Partek Pathway Tutorial.
Additional Assistance
If you need additional assistance, please visit our support page to submit a help ticket or find phone numbers for regional support.


| Your Rating: |
|
Results: |

|
35 | rates |
Overview
Content Tools