The setup dialog for GO ANOVA can be found in the Biological Interpretation section of the expression workflows (Gene Expression, MicroRNA Expression, Exon, RNA-Seq, miRNA-Seq). It is recommended that GO ANOVA is run on the sheet with expression levels, after import and normalization, though GO ANOVA can be run on any spreadsheet with samples on rows and genes on columns. If a child spreadsheet is selected, such as the result of a prior ANOVA analysis, then the test will be automatically run on the parent spreadsheet.
Upon selecting GO ANOVA (Biological Interpretation > Gene Set Analysis), Partek Genomics Suite will first offer the opportunity to configure the parameters of the test and exclude functional groups with too few or too many genes (Figure 1). To save time when running GO ANOVA, the size of GO categories analyzed can be limited using the Restrict analysis to function groups with fewer than __ genes. Large GO categories may be less interesting and also take the most time to analyze. We recommend to restrict the analysis to the groups with fewer than 150 genes, as it can make the analysis much quicker (and the results easier to interpret). In the current example, the maximum category was set to only 20 genes, for demonstration purposes only.
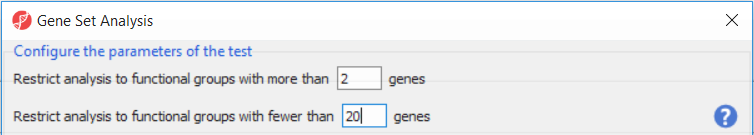 Figure 1. Configure the parameters of the test: gene ontology categories with too few or too many genes can be excluded
The next dialog (Figure 2) specifies the method of mapping genes to gene sets. Default mapping file is built from annotation files from geneontology.org. Custom mapping file points to the mapping files available on the local computer and present in the Microarray libraries directory. Create a new mapping file from the chip's annotation file option will try to build the annotation file from the annotation file created by the microarray vendor. Create a new mapping file from a spreadsheet enables you to create a custom mapping file from an open spreadsheet, which has gene symbols on one column, and gene groups on the other column. Finally, files in gene matrix transposed (GMT) or gene annotation (GA) formats can also be used.
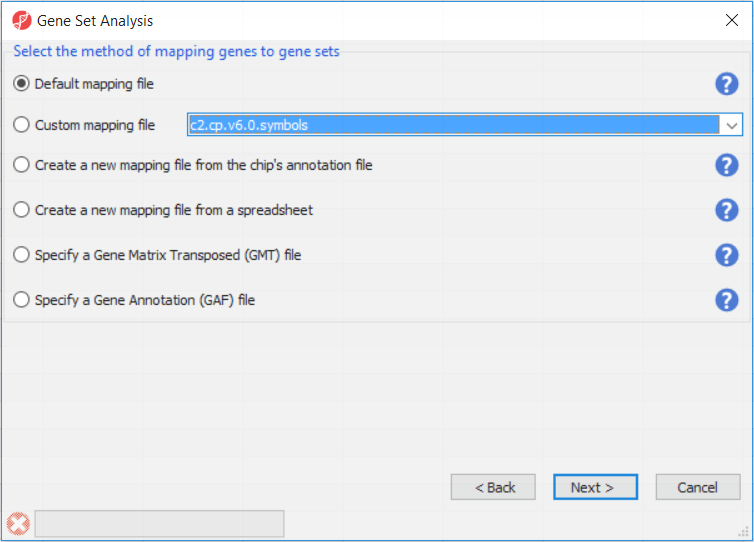 Figure 2. Setting the method of mapping genes to gene sets
To setup the GO ANOVA dialogue you must consider all factors that would normally be included in an ANOVA model analyzing gene expression among the samples (Figure 3). Briefly this should include:
- Experimental factors
- Factors explaining sample dependence
- Factors explaining noise
For more details on ANOVA, see Chapter 11 of the User’s Manual.
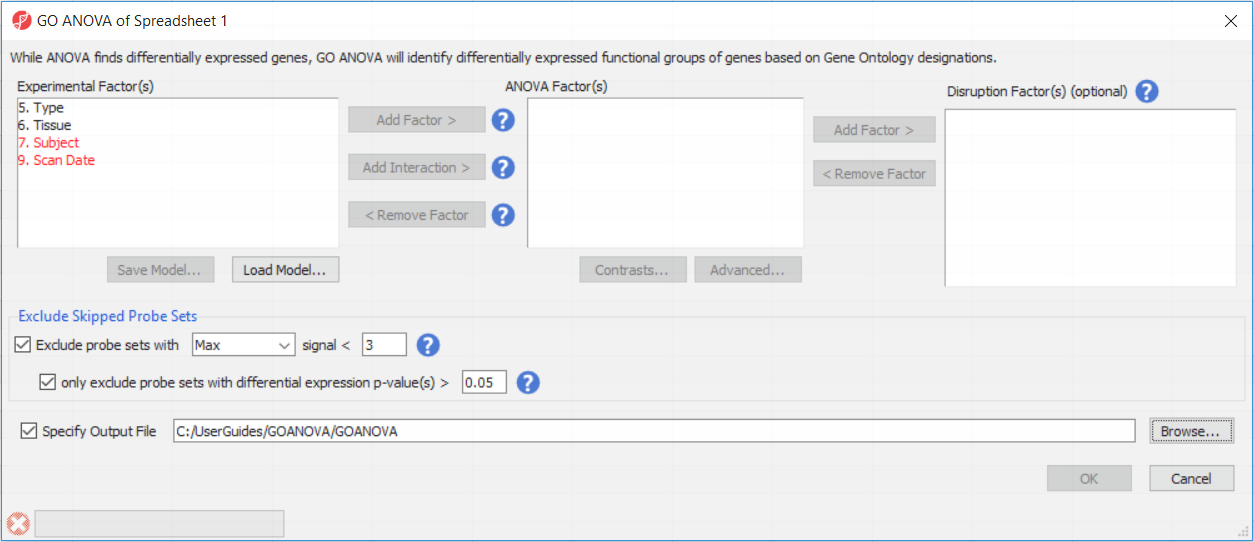 Figure 3. GO ANOVA setup dialog. Including a factor in the ANOVA model (ANOVA Factors) will identify gene ontology (GO) categories whose expression is different across the genes within the category, by the factor of interest. Including a factor as a Disruption Factor will identify GO categories where the expression of the genes within the category are affected but not uniformly across the genes withing the category. Genes (probesets) can be excluded based on expression levels, to reduce the noise.
Experimental Factors
Factors inherent to the experiment include variables that would be considered as the experimental variables during experiment design. Generally this will include all variables necessary to answer the questions of the researcher. Examples may include factors such as tissue type, disease state, treatment, or dosage.
Sometimes factors do not act independently of each other. For example, different dosages of a drug may affect patients differently over time, or a drug may not affect tissues equally as in many toxicity studies. If the effect of one variable on the other is either suspected of occurring, or of particular interest, an interaction between the two factors should be included. To do this, select the two factors simultaneously by CTRL-clicking the factors and then select Add Interaction.
Factors Explaining Sample Dependence
Factors to control for sample dependence include variables that account for relation between samples. If tissues are collected in pairs from the same patient, patient ID would be included. Similarly if tissues are collected from two distinct populations, this variable should probably be included as well.
Factors Explaining "Noise"
Noise variables may be caused by technical processes used during sample collection and processing. Scan data and dye color are often among these variables.
Optional Disruption Factor(s)
Factors included in the GO ANOVA fall into two separate categories: the normal ANOVA factors (middle box) and those interacting with the gene (right-side box).
Fundamentally, you can run the GO ANOVA with the same parameters used to run a standard ANOVA analysis on gene expression data. (In other words, the middle box of the GO ANOVA is populated exactly as the normal ANOVA and the Interact with Gene box is left empty.) If such an analysis is run, the results would be similar to a standard statistical analysis, except resulting data will report on differential expression of functional categories instead of individual genes. Expression of a functional group is derived from the mean of all genes included within the group. Running GO ANOVA with the same parameters as the differential expression analysis is the most common method of running GO ANOVA. This keeps the analysis much more accessible and the results are easier to interpret.
There is no need to interact a factor with the gene if such an interaction is not of interest. The right most box in the GO ANOVA setup is optional and may be left empty if this is the case.
More advanced analysis can include factors, which are interacted with the genes in the GO ANOVA model. After factors are added to the ANOVA factor(s) box, some can be added additionally to the Disruption Factor(s) box. At the mathematical level, this will include the Factor*Gene term in the model, called a Factor-Gene interaction. At the biological level, this will test whether patterns of gene expression within the functional group are being modified as a result of the factor. This altering of gene expression patterns is referred to in this document as the disruption of the functional group.
For example, if comparing different tissue types, adding tissue to the middle ANOVA factor(s) box, will identify entire GO functional groups that are up or down regulated between tissue types. If comparing nerves and muscles, this might include such categories as myosin binding or actin production, which will be wholly up regulated in muscles as the function is much less important to nerve function.
By interacting tissue with the gene in the model (adding tissue to the right most box), the interaction p-value may provide a method of discovering categories where total expression might not changed significantly but the pattern of gene expression with the category is altered or disrupted. Within a functional group, the interaction p-value represents how similar the patterns of gene expression are between the different tissues. One example of a functional group identified by a tissue*gene interaction might include a category such as ion transfer. Ion transfer is equally important to both nerve and muscle function, but the distribution of ion channels and many of the responsible genes may be quite different between the two.
Sometimes factors may be included in the Interact with Gene box even if they are not of specific interest in a similar way that factors to control for noise are added to the ANOVA factors middle box. If any factors are included in Disruption Factor(s) box, to get the most accurate p-values, the more advanced model must fit the data as well as possible. All factors that may alter gene expression patterns should be included. It is important to keep in mind that the GO ANOVA is not only looking for significance in the factors included, but is attempting to generally fit the data. As appropriate factors are added to the model, not only are more aspects of the data analyzed; the model becomes a better fit to the true data and the results will become more accurate.
To understand how including a Gene*Factor interaction may improve the fit of the model, consider the complex GO ANOVA design in the case of a dose-time analysis of a drug. While it may seem clear that the ANOVA factors in the middle box - dose, time, and the dose*time interaction should be specified (to consider the effect of dose, time, and the change in the effect of dose over time) what to put in the rightmost Gene*Factor box is not as clear. Adding dose alone (which is actually Dose*Gene) will check if different drug doses affect the pattern of gene expression. Similarly adding time into the right box (which is actually Time*Gene) will identify gene ontology categories that are affected in different times but differentially across the genes. While this may be the true limit of questions of interest, including the interactions of the gene and both dose and time may be prudent. In general, if it is likely, or expected, that a factor will affect gene distribution within functional categories, then the factor should be included in the Disruption Factor(s) box if the gene distribution is being analyzed at all.
To review, including a factor in the middle box will identify GO categories whose expression is consistently affected across the genes within the category by the factor of interest. Including a factor in the right box (factor*gene) will identify gene ontology categories where the expression of the genes within the category are affected but not uniformly across the genes within the category.
Contrasts
GO ANOVA is not restricted to analysis of factors with only two levels. The ANOVA p-values are measures of likelihood that all groups are equivalent. While this is useful in general, sometimes tests comparing only two sets of data are more desirable. Using contrasts to define pair wise comparisons in an ANOVA model is superior to using a test that is limited to a two group comparison.
To specify individual pair wise comparisons, press the Contrast button. Contrasts are performed on groups already defined in the ANOVA model. If two tissue types should be compared to each other, select the tissue term from the Select Factor/Interaction dropdown in the upper left. Select either one or a set of categories and add them to group 1 and group 2. All samples falling into group 1 will be compared to all samples falling into group 2. Output will include not only a p-value, but also a fold change. This fold change will represent the average fold change of the GO category between the two groups. Fold change is calculated as Group 1 divided by Group 2. For data in log space, the data is antilogged as well; fold change output is always for data on a linear scale.
Excluding Genes
Check Exclude probe sets and differential expression p-value(s) > to filter out probe sets (=genes) which are not express in any of the genes. The Exclude probe sets option will remove any gene that meets the specified limit. Using the default options, this will remove low expression genes. Note that the default value of 3 is a suggestion for Affymetrix expression arrays and may not be applicable for other data sets. We suggest to perform exploratory analysis and inspect the distribution of the expression values first (e.g. View > Histogram > Row or View > Box and Whiskers > Row). The sub-checkbox, differential expression p-values, provides an override to the low expression limit. Here, a gene will be included in the analysis despite a low expression value if the gene displays a p-value below the specified limit, suggesting that the gene is differentially expressed
Additional Assistance
If you need additional assistance, please visit our support page to submit a help ticket or find phone numbers for regional support.


| Your Rating: |
|
Results: |

|
35 | rates |
Overview
Content Tools