| Name
|
Size
|
Creator |
Creation Date
|
Last Modification Date
|
Labels |
Attached To |
|
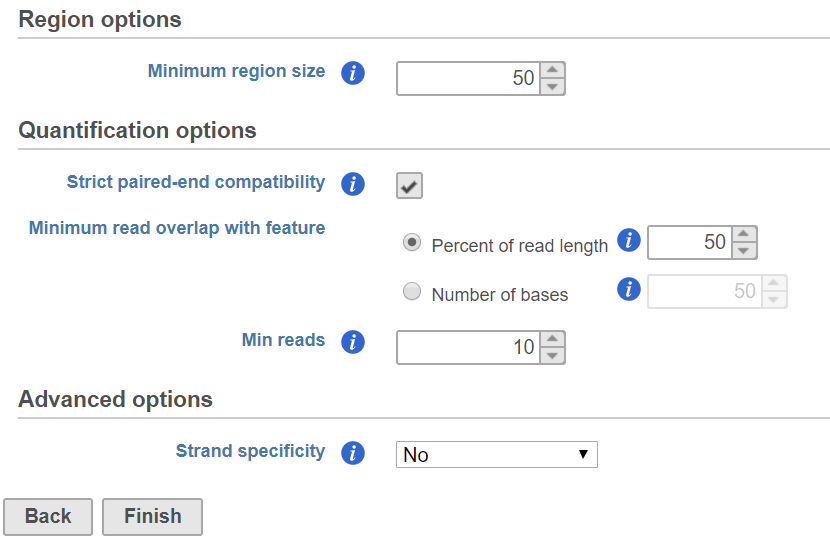
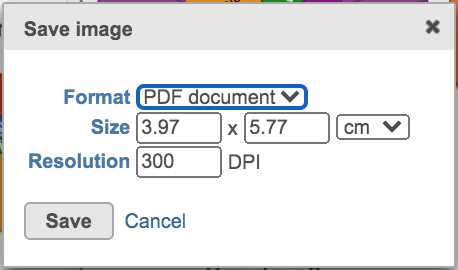
PNG File quantify_peak_dialog.png |
29 kB |
Xiaowen Wang |
Dec 24, 2018 12:34 |
Dec 24, 2018 12:34 |
|
Page: Quantify regions
|
|
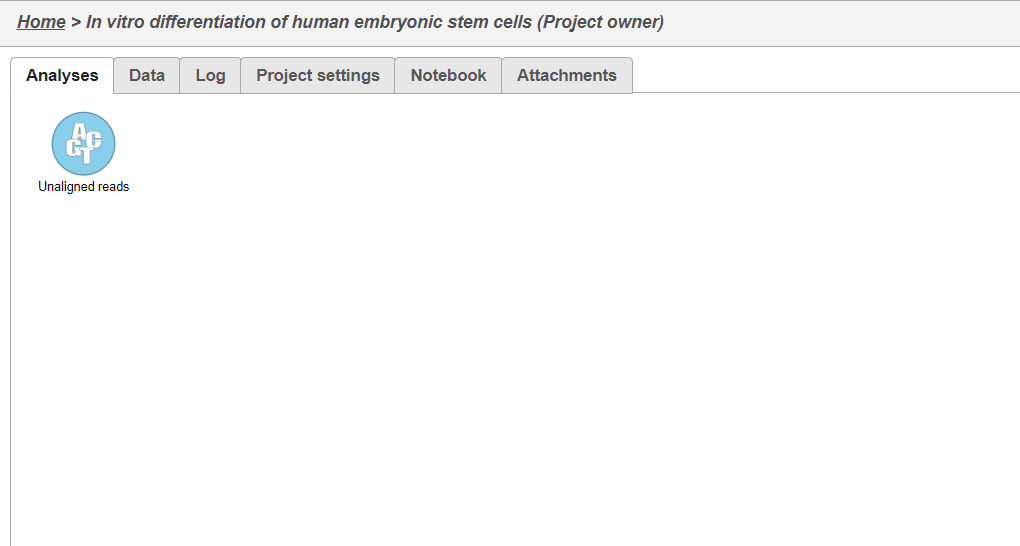
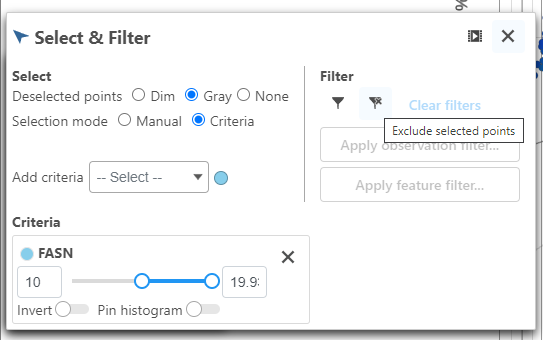
PNG File image2018-12-20 11:26:18.png |
29 kB |
Paul Fullerton |
Dec 20, 2018 11:26 |
Dec 20, 2018 11:35 |
|
Page: Importing a GEO / ENA project
|
|
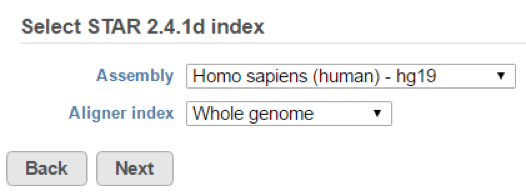
PNG File star_aligner_index_selector.png |
29 kB |
admin |
Jun 10, 2016 10:04 |
Jul 18, 2016 17:31 |
|
Page: Running a Pipeline
|
|
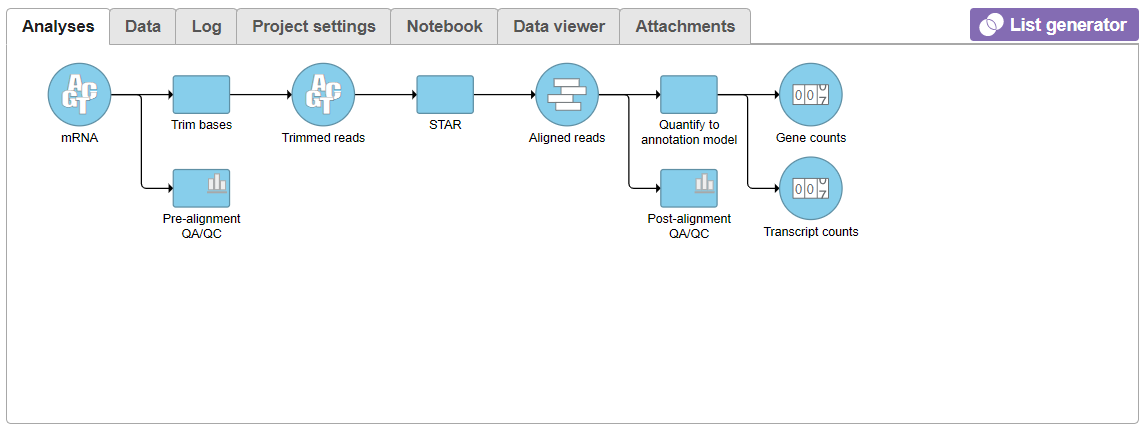
PNG File 2021-02-12 11_31_28-Inked2021-02-12 11_27_41-Task … |
29 kB |
Ivan Lukic |
Feb 12, 2021 04:32 |
Feb 12, 2021 04:32 |
|
Page: Quantifying to an annotation model
|
|
PNG File image2018-1-29 17:20:33.png |
29 kB |
Paul Fullerton |
Jan 29, 2018 17:20 |
Jan 29, 2018 17:20 |
|
Page: Classify cells from multiple samples using t-SNE
|
|
PNG File image2018-1-29 17:20:33.png |
29 kB |
Alex Rutkovsky |
Jul 12, 2023 07:38 |
Jul 12, 2023 07:38 |
|
Page: Process Xenium data
|
|
PNG File image2018-1-29 17:20:33.png |
29 kB |
Alex Rutkovsky |
Jul 07, 2023 11:29 |
Jul 07, 2023 11:29 |
|
Page: Start with 10x Genomics Visium fastq files
|
|
PNG File image2018-3-22 9:44:32.png |
29 kB |
Paul Fullerton |
Mar 22, 2018 09:44 |
Mar 22, 2018 09:44 |
|
Page: Importing the tutorial data set
|
|
PNG File image2017-12-29 11:14:6.png |
29 kB |
Paul Fullerton |
Dec 29, 2017 11:13 |
Dec 29, 2017 11:13 |
|
Page: Classify cells from multiple samples using t-SNE
|
|
PNG File image2017-12-29 11:14:6.png |
29 kB |
Alex Rutkovsky |
Jul 12, 2023 07:38 |
Jul 12, 2023 07:38 |
|
Page: Process Xenium data
|
|
PNG File image2017-12-29 11:14:6.png |
29 kB |
Alex Rutkovsky |
Jul 07, 2023 11:29 |
Jul 07, 2023 11:29 |
|
Page: Start with 10x Genomics Visium fastq files
|
|
PNG File image2019-8-5_12-32-32.png |
29 kB |
Xiaowen Wang |
Dec 24, 2020 11:42 |
Dec 24, 2020 11:42 |
|
Page: General linear model
|
|
PNG File Screen Shot 2021-01-06 at 11.11.13 AM.png |
29 kB |
Uchenna Emechebe |
Mar 06, 2021 10:04 |
Mar 06, 2021 10:04 |
|
Page: Histograms
|
|
PNG File Screen Shot 2021-01-06 at 11.11.13 AM.png |
29 kB |
Zhengbin Liu |
Jan 06, 2021 11:11 |
Jan 06, 2021 11:11 |
|
Page: Pie Chart
|
|
PNG File image2023-7-21_18-38-40.png |
29 kB |
Alex Rutkovsky |
Jul 21, 2023 17:38 |
Jul 21, 2023 17:38 |
|
Page: Perform Exploratory analysis
|
|
PNG File image2018-3-20 9:29:1.png |
29 kB |
Paul Fullerton |
Mar 20, 2018 09:29 |
Mar 20, 2018 09:29 |
|
Page: Getting started with the tutorial data set
|
|
PNG File image2018-3-20 9:29:1.png |
29 kB |
Alex Rutkovsky |
Jul 07, 2023 11:29 |
Jul 07, 2023 11:29 |
|
Page: Start with pre-processed Space Ranger output files
|
|
PNG File image2018-3-20 9:29:1.png |
29 kB |
Alex Rutkovsky |
Jul 12, 2023 07:38 |
Jul 12, 2023 07:38 |
|
Page: Import 10x Genomics Xenium Analyzer output
|
|
PNG File image2017-9-11 17:3:44.png |
29 kB |
Paul Fullerton |
Sep 11, 2017 17:03 |
Sep 11, 2017 17:03 |
|
Page: Importing the tutorial data set
|
|
PNG File image2018-2-20 16:5:4.png |
29 kB |
Paul Fullerton |
Feb 20, 2018 16:05 |
Feb 20, 2018 16:05 |
|
Page: Getting started with the tutorial data set
|