This method is based on general linear model, much like ANOVA in reverse, it calculates the variation attributed to the factor(s) being removed then adjusting the original values to remove the variation.
By including batch in the differential analysis model, the variability due to the batch effect is accounted for when calculating p-values. In this sense, batch effects are best handled as part of the differential analysis model. However, clustering data or visualizing biological effects can be very difficult if batch effects are present in the original data. We transform the original values to remove the batch effect using this tool.
We recommend normalizing your data prior to removing batch effects, but the task will run on any counts data node.
- Click the counts data node
- Click the Batch removal section of the toolbox
- Click General linear model
The batch effect removal dialog is similar to the dialog for ANOVA. To set up the model, you need to choose which attributes should be considered. Here, you should include the batch attribute, any attributes that interact with batch, and the interactions between these attributes.
For example, in the case where you have different cell types and batch may have a different effect on different cell types, you would need to include both batch, cell type, and the interaction between batch and cell type. Here, batch is the attribute Version and cell type is the attribute Classification.
- Click Version and Classification
- Click Add factors
- Click Version and Classification
- Click Add interaction (Figure 1)
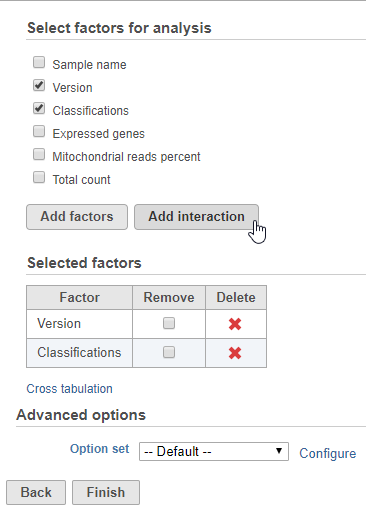
Figure 1. Adding factors and interactions to the model
To remove the batch effect and its interaction with cell type, we can click the Remove checkbox for both Version and Version*Classification.
- Click the Remove checkbox for Version and Version*Classification
- Click Finish to run (Figure 2)
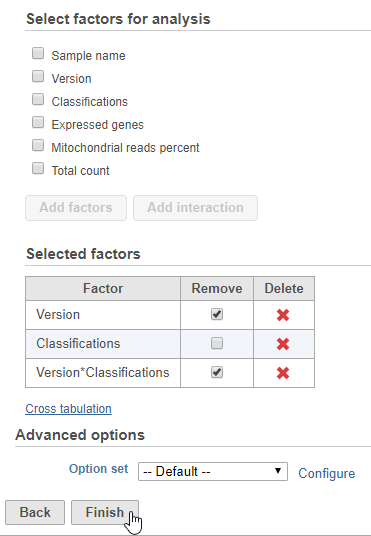
Figure 2. Configuring the batch effect removal tool
The output of is a new data node, Batch effect adjusted counts. This data node contains the batch effect corrected values can be used as the input for downstream tasks such as clustering and UMAP.
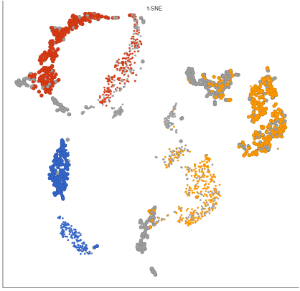
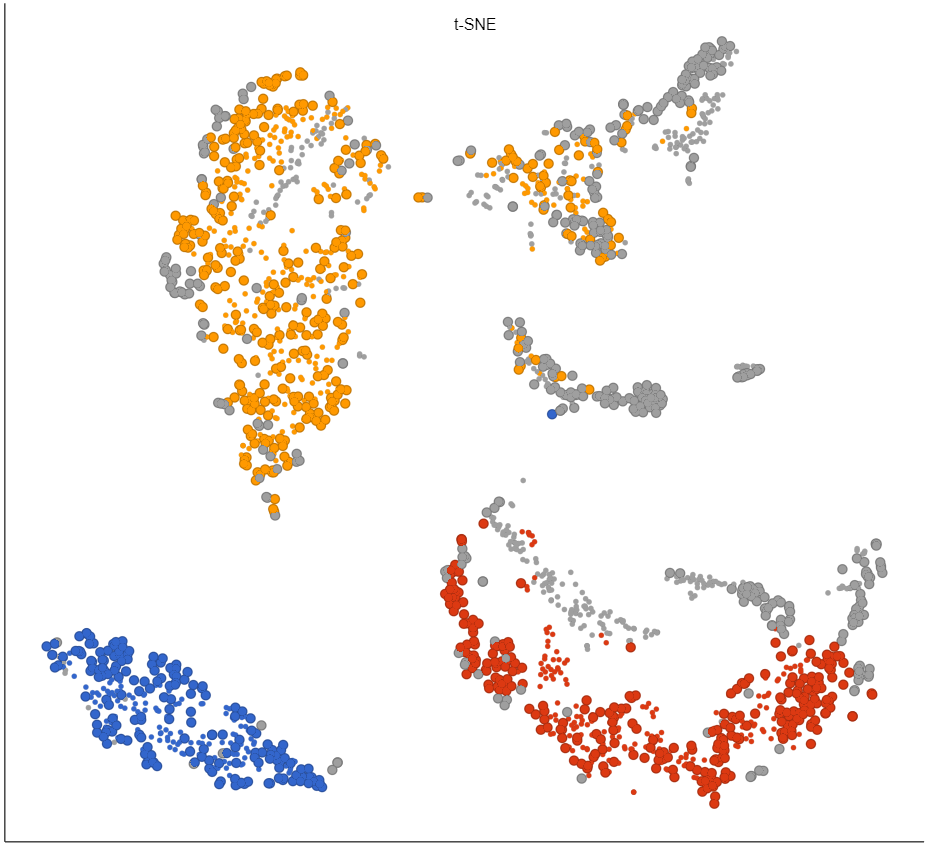
Figure 3. Before (left) and after (right) batch effect removal of Version and Version*Classification. Cells are sized by Version and colored by Classification.
Advanced options
The advanced options for Remove batch effect are shared by ANOVA/LIMMA-trend/LIMMA-voom.
Overview
Content Tools