| Name
|
Size
|
Creator |
Creation Date
|
Last Modification Date
|
Labels |
Attached To |
|
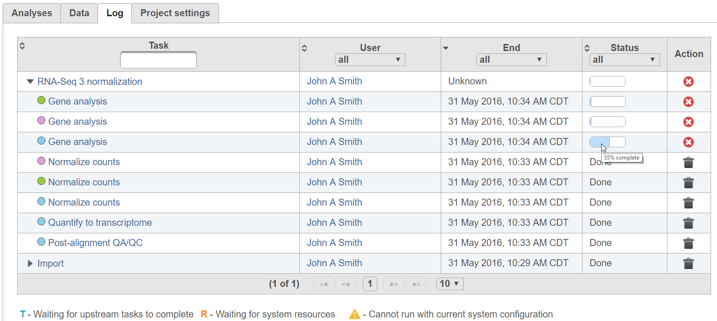
PNG File pipeline_log_tab_running.png |
107 kB |
admin |
Jun 10, 2016 10:06 |
Jul 18, 2016 17:33 |
|
Page: Running a Pipeline
|
|
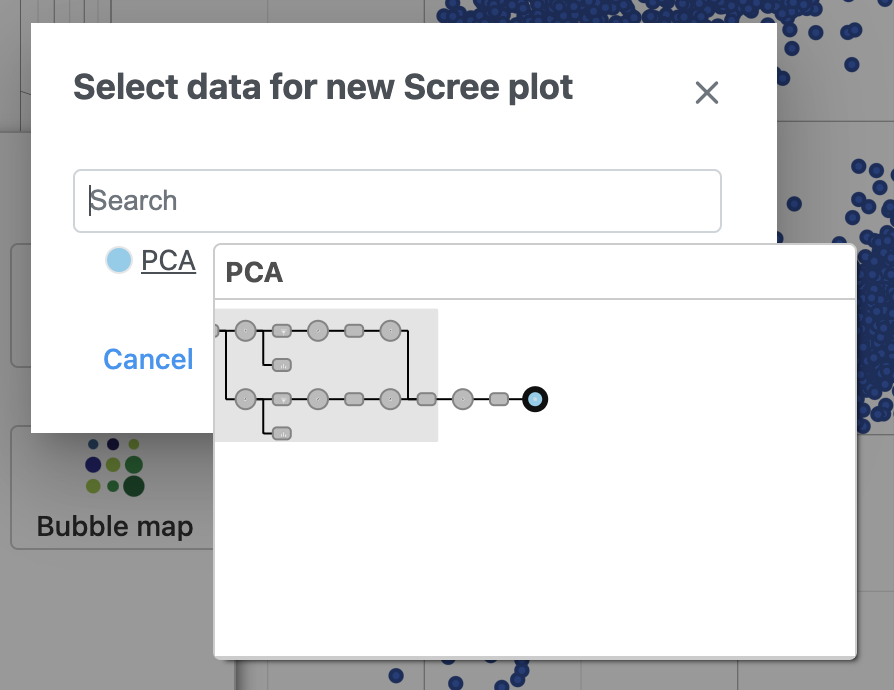
PNG File Screenshot 2023-09-18 at 11.54.39.png |
107 kB |
Matteo Luberti |
Sep 18, 2023 06:01 |
Sep 18, 2023 06:01 |
|
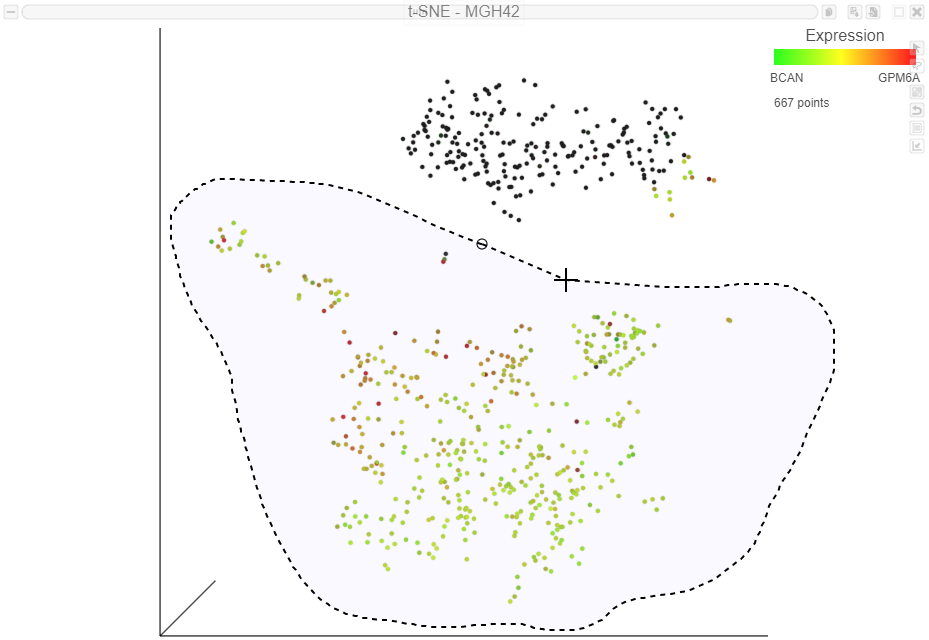
Page: Dimensionality Reduction and Clustering
|
|
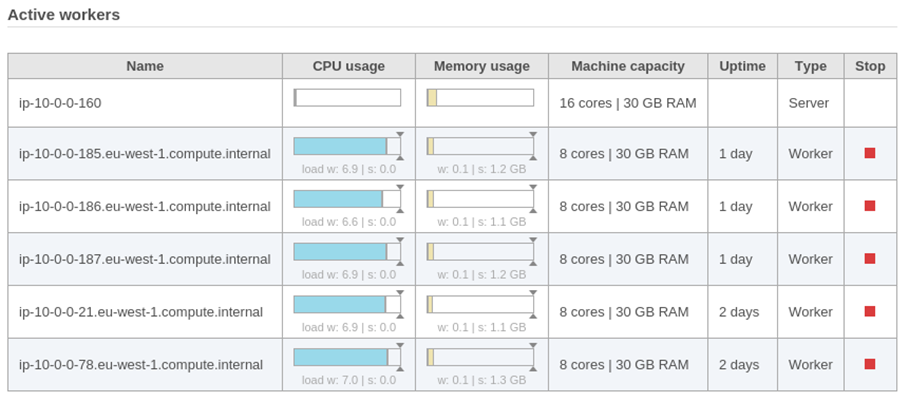
PNG File workers.png |
107 kB |
admin |
Jun 09, 2016 09:34 |
Jul 19, 2016 13:04 |
|
Page: System Resources
|
|
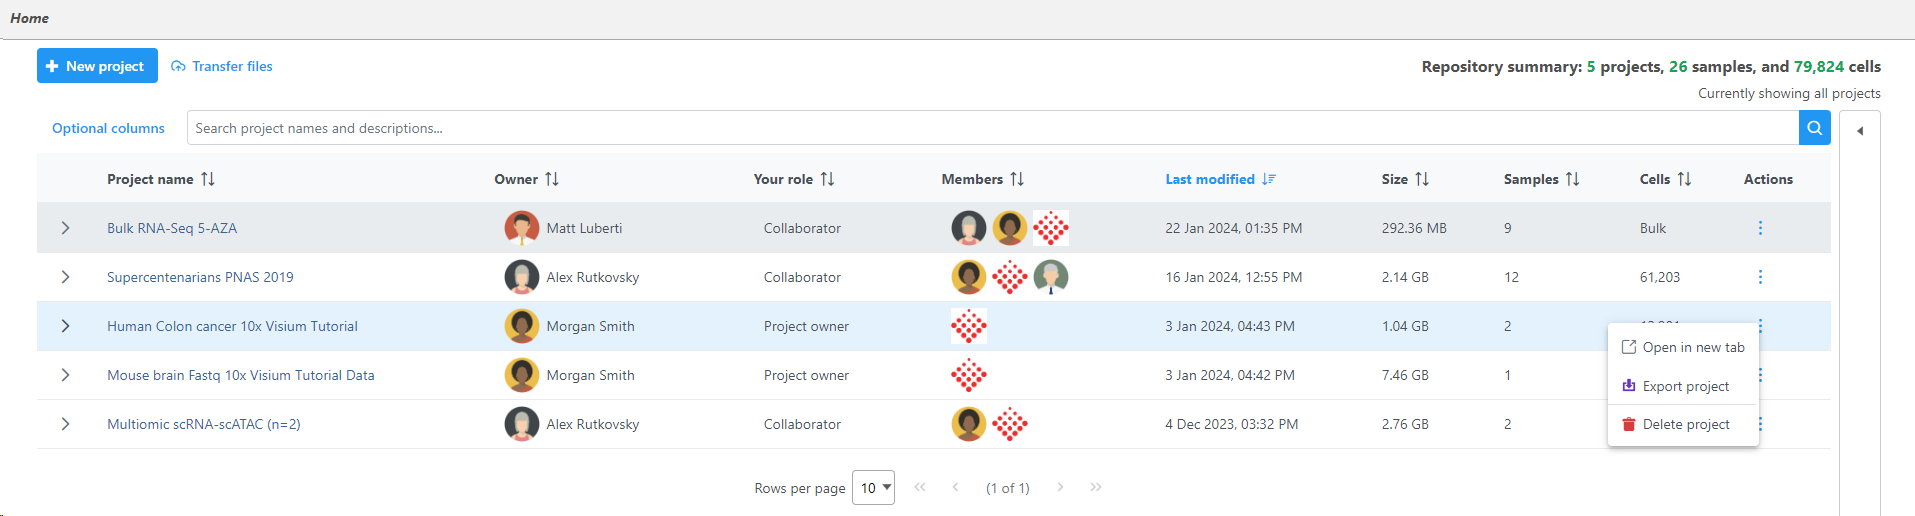
PNG File image2024-1-24_9-33-53.png |
107 kB |
Alex Rutkovsky |
Jan 24, 2024 08:33 |
Jan 24, 2024 08:33 |
|
Page: Interface
|
|
PNG File Select_glioma_cells.png |
107 kB |
Simit Patel |
Jun 15, 2020 10:23 |
Jun 15, 2020 10:23 |
|
Page: Classify cells from multiple samples using t-SNE
|
|
PNG File Select_glioma_cells.png |
107 kB |
Alex Rutkovsky |
Jul 12, 2023 07:38 |
Jul 12, 2023 07:38 |
|
Page: Process Xenium data
|
|
PNG File Select_glioma_cells.png |
107 kB |
Alex Rutkovsky |
Jul 07, 2023 11:29 |
Jul 07, 2023 11:29 |
|
Page: Start with 10x Genomics Visium fastq files
|
|
PNG File image2023-10-2_14-12-33.png |
107 kB |
Alex Rutkovsky |
Oct 02, 2023 13:12 |
Oct 02, 2023 13:12 |
|
Page: Pipeline managment
|
|
PNG File image2018-4-4 11:23:4.png |
107 kB |
Paul Fullerton |
Apr 04, 2018 11:23 |
Apr 04, 2018 11:23 |
|
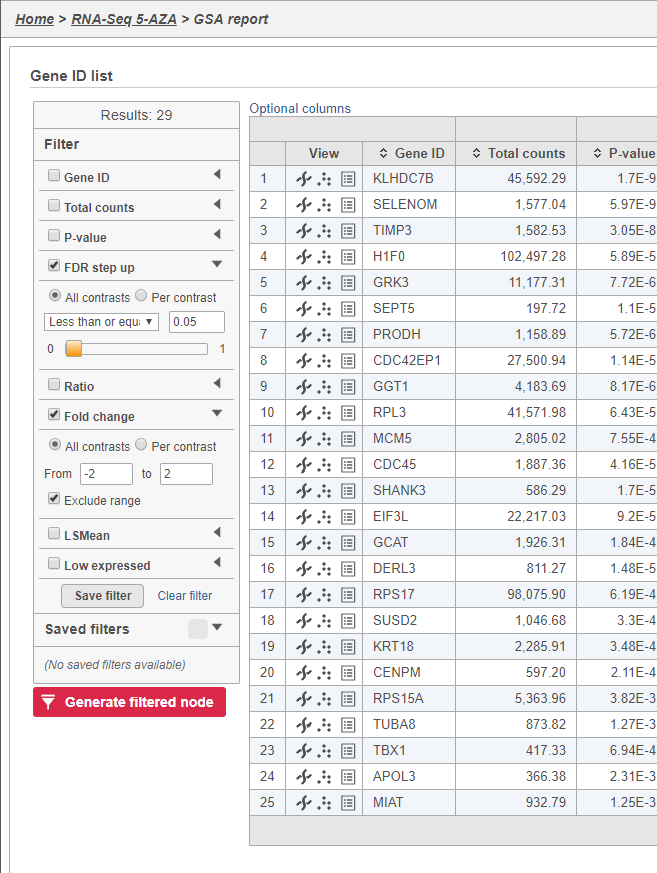
Page: Viewing DESeq2 results and creating a gene list
|
|
PNG File image2018-2-16 12:46:36.png |
107 kB |
Paul Fullerton |
Feb 16, 2018 12:46 |
Feb 16, 2018 12:46 |
|
Page: Compare expression between cell types with multiple samples
|
|
PNG File image2018-2-16 12:46:36.png |
107 kB |
Alex Rutkovsky |
Jul 12, 2023 07:38 |
Jul 12, 2023 07:38 |
|
Page: Make comparisons using Compute biomarkers and Biological interpretation
|
|
PNG File image2018-2-16 12:46:36.png |
107 kB |
Alex Rutkovsky |
Jul 07, 2023 11:29 |
Jul 07, 2023 11:29 |
|
Page: Spatial data analysis steps
|
|
PNG File 2021-09-21 13_43_18-Movies & TV.png |
106 kB |
Ivan Lukic |
Sep 21, 2021 06:43 |
Sep 21, 2021 06:43 |
|
Page: Compute biomarkers
|
|
PNG File image2018-1-29 17:13:7.png |
106 kB |
Paul Fullerton |
Jan 29, 2018 17:13 |
Jan 29, 2018 17:13 |
|
Page: Classify cells from multiple samples using t-SNE
|
|
PNG File image2018-1-29 17:13:7.png |
106 kB |
Alex Rutkovsky |
Jul 12, 2023 07:38 |
Jul 12, 2023 07:38 |
|
Page: Process Xenium data
|
|
PNG File image2018-1-29 17:13:7.png |
106 kB |
Alex Rutkovsky |
Jul 07, 2023 11:29 |
Jul 07, 2023 11:29 |
|
Page: Start with 10x Genomics Visium fastq files
|
|
PNG File Screenshot 2023-09-15 at 15.12.28.png |
106 kB |
Matteo Luberti |
Sep 15, 2023 09:13 |
Sep 15, 2023 09:13 |
|
Page: Analyzing Single Cell RNA-Seq Data
|
|
PNG File image2018-1-29 16:51:26.png |
106 kB |
Paul Fullerton |
Jan 29, 2018 16:51 |
Jan 29, 2018 16:51 |
|
Page: Classify cells from multiple samples using t-SNE
|
|
PNG File image2018-1-29 16:51:26.png |
106 kB |
Alex Rutkovsky |
Jul 12, 2023 07:38 |
Jul 12, 2023 07:38 |
|
Page: Process Xenium data
|
|
PNG File image2018-1-29 16:51:26.png |
106 kB |
Alex Rutkovsky |
Jul 07, 2023 11:29 |
Jul 07, 2023 11:29 |
|
Page: Start with 10x Genomics Visium fastq files
|