This page covers the following topics:
Home Page
The Partek Flow Home page is the first page displayed upon login. It provides a quick overview of recent activities and provides access to several system options (Figure 1).
To access a project, click the blue project name. The projects can be sorted by the column title and searched by criteria using the search options on the right and the search bar above the project table. The Repository summary shows the total number of projects, samples, and cells in your Partek Flow server (Figure 1).
Home Page Icons
Shown at the top of the Home page, the New project button provides a quick link to create a new project in your Partek Flow server.
The Transfer files button is used to transfer data to the server.
The Optional columns button can be used to add additional column information to the project table.
The Search button will search for project names and descriptions that have been typed into the search bar.
Additional project details can also be opened and closed individually using the arrow to the left of the project name. To open additional project details for all projects at once, use the arrow to the left of the Project name column header.
The table listing all the projects can be sorted by clicking the sort icon to the right of the table headers. By default, the table is sorted by the date when the project was last modified.
Under the Actions column, three vertical dots will open the project actions options: Open in new tab , Export project, and Delete project (Figure 2).
System Options
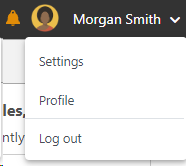
The drop-down menu in the upper right corner of the Home page (Figure 3) displays options that are not related to a project or a task, but to the Partek Flow application as a whole. This links to the Settings and Profile and gives you the option to log out of your server.
Progress Indicator and Queue
The left-most icon will bring you back to the Home page with one click.
The next icon is the progress indicator, summarizing the current status of the Partek Flow server. If no tasks are being processed, the icon is grey and static and the idle message is shown upon mouse over. Clicking on this icon will direct you to the System resources under Settings (Figure 4).
If the server is running, the progress indicator will depict green bars animated on the server icon (Figure 5).
Selecting the Queue dropdown will list the number of running tasks launched by the user. Additional information about the queue including the estimated completion time as well the total number of queued tasks launched can be obtained by selecting View queued tasks (Figure 6).
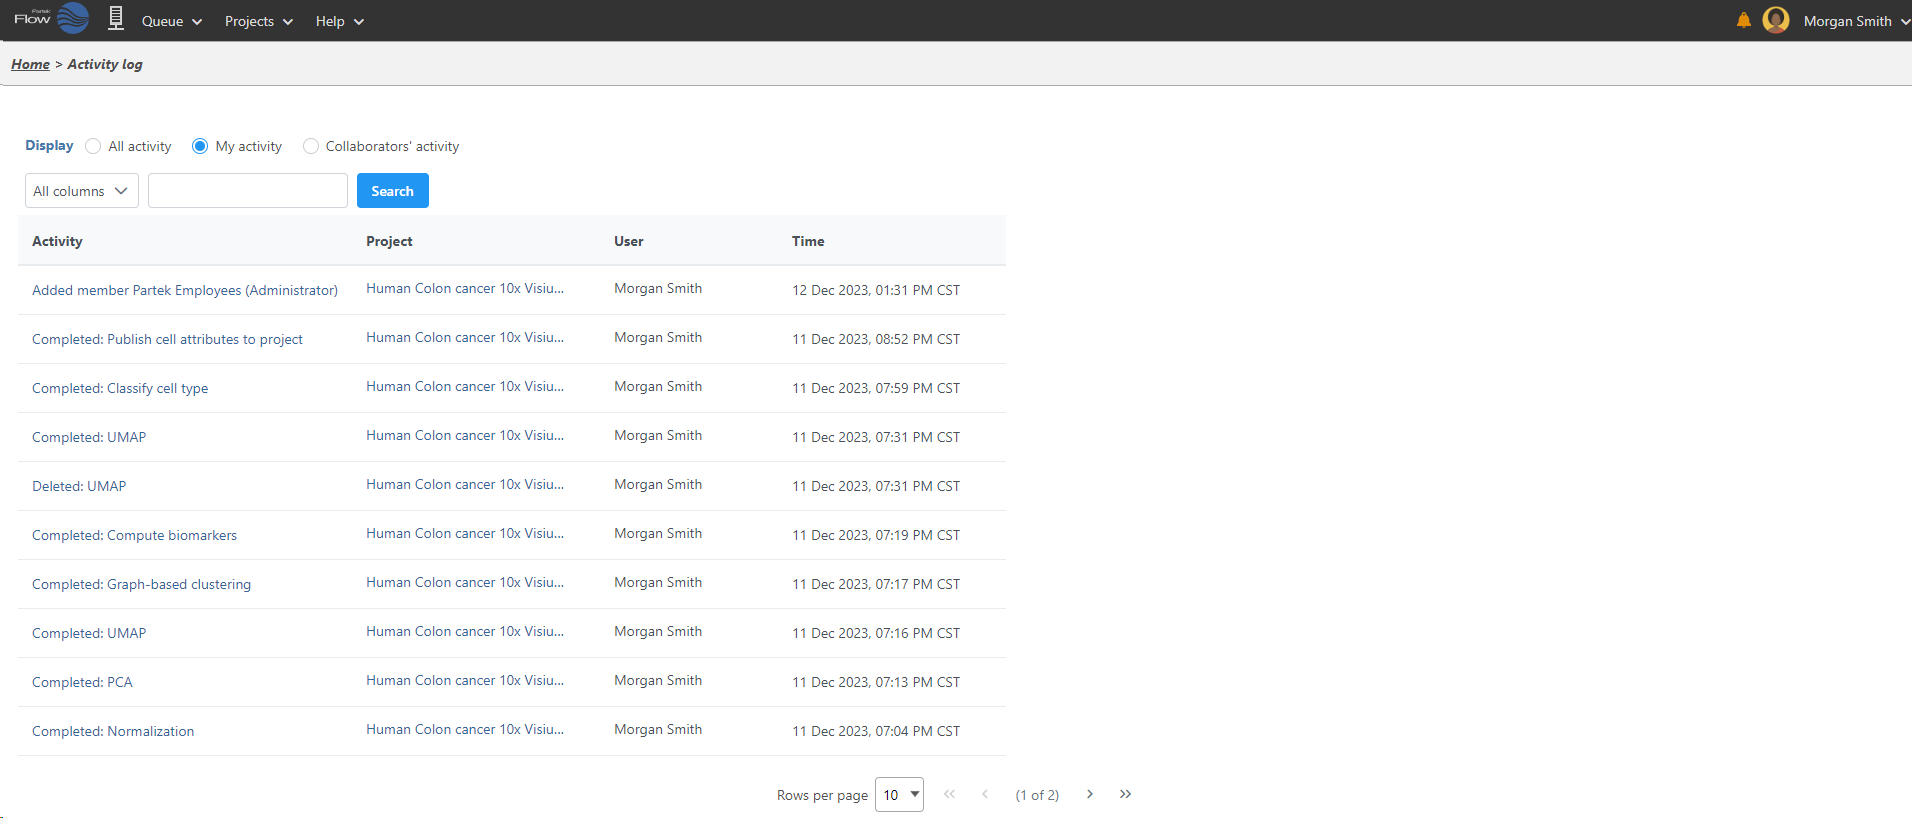
To view all previous tasks, select the View recent activity link. Clicking this link loads the Activity log page (Figure 7). It displays all the tasks within the projects accessible to the user (either as the owner or as a collaborator), including the tasks launched by other users of the Partek Flow instance.
The Display radio buttons enable filtering of the log. All activity will show all the tasks (irrespective of the task owner, i.e. the user starting the task), while My activity lists only the tasks started by the current user. In contrast to the latter, Collaborator’s activity displays the tasks that are not owned by the current user (but to which the user has access as a collaborator).
The Activity log page also contains a search function that can help find a particular task (Figure 8). Search can be performed through the entire log (All columns), or narrowed down to one of the columns (using the drop-down list).
Searching the Home Page and Project Details
The Home page lists the most recent projects that have been performed on the server. By default, the table contains all the projects owned by the current user or ones where the user is a collaborator. The list entries are links that automatically load the selected project.
The Search box can be used to find specific projects based on project titles and descriptions. You can also Search by individual or multiple criteria based on projects Owners, Members, Cell count, Sample count, Cell type, Organ, and Organism (Figure 9). Cell type, Organ, Organism, cell count, and sample count are sourced from the metadata tab. Owner and members are sourced from the project settings tab.
The criteria used for the search are listed above the table along with the number of projects containing the criteria.
The project table displays optional columns as the project name, owner, your role, the members that have access to the project, date last modified, size, number of samples, and number of cells. The drop down contains a thumbnail, short description, samples contained within the project and queue status (Figure 10).
The project settings tab within each project can be used to modify details such as the project name, thumbnail, description, species, members, and owner.
Additional Assistance
If you need additional assistance, please visit our support page to submit a help ticket or find phone numbers for regional support.


| Your Rating: |
    
|
Results: |
    
|
52 | rates |


1 Comment
Melissa del Rosario
author: cignacio