| Name
|
Size
|
Creator |
Creation Date
|
Last Modification Date
|
Labels |
Attached To |
|
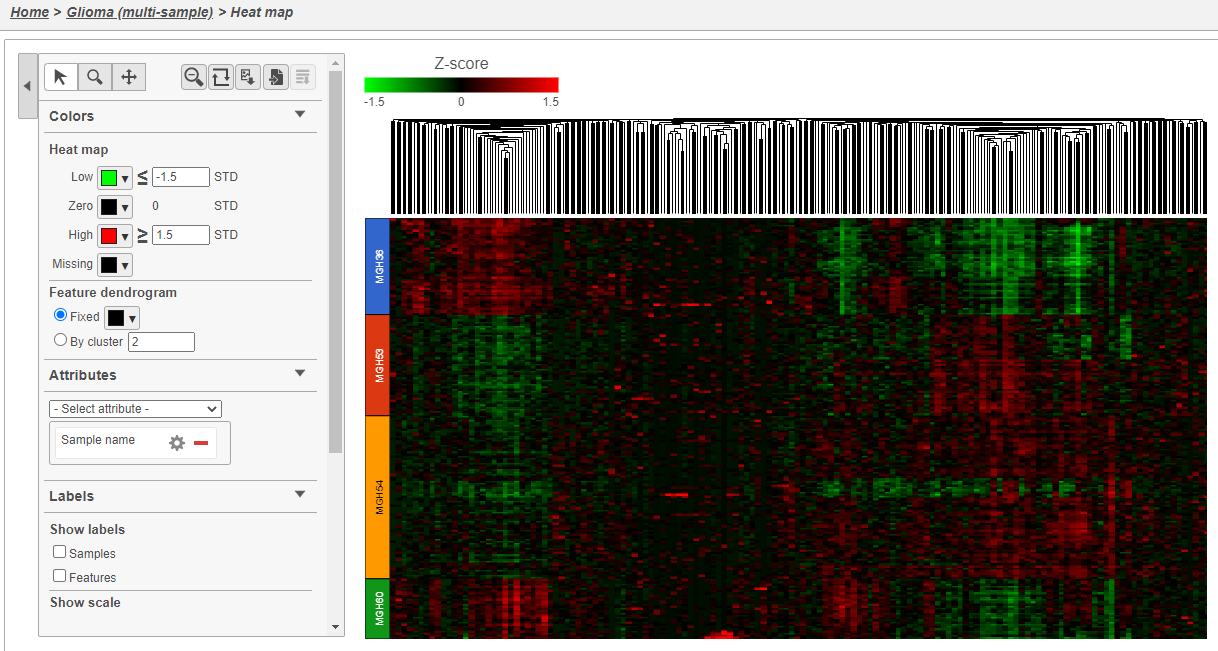
PNG File Heatmap_Glioma.png |
255 kB |
Alex Rutkovsky |
Jul 12, 2023 07:38 |
Jul 12, 2023 07:38 |
|
Page: Make comparisons using Compute biomarkers and Biological interpretation
|
|
PNG File Heatmap_Glioma.png |
255 kB |
Alex Rutkovsky |
Jul 07, 2023 11:29 |
Jul 07, 2023 11:29 |
|
Page: Spatial data analysis steps
|
|
PNG File Screenshot 2023-01-10 at 14.46.37.png |
254 kB |
Matteo Luberti |
Jan 10, 2023 08:46 |
Jan 10, 2023 08:46 |
|
Page: Compare expression between cell types with multiple samples
|
|
PNG File Screenshot 2023-01-10 at 14.46.37.png |
254 kB |
Alex Rutkovsky |
Jul 12, 2023 07:39 |
Jul 12, 2023 07:39 |
|
Page: Make comparisons using Compute biomarkers and Biological interpretation
|
|
PNG File Screenshot 2023-01-10 at 14.46.37.png |
254 kB |
Alex Rutkovsky |
Jul 07, 2023 11:29 |
Jul 07, 2023 11:29 |
|
Page: Spatial data analysis steps
|
|
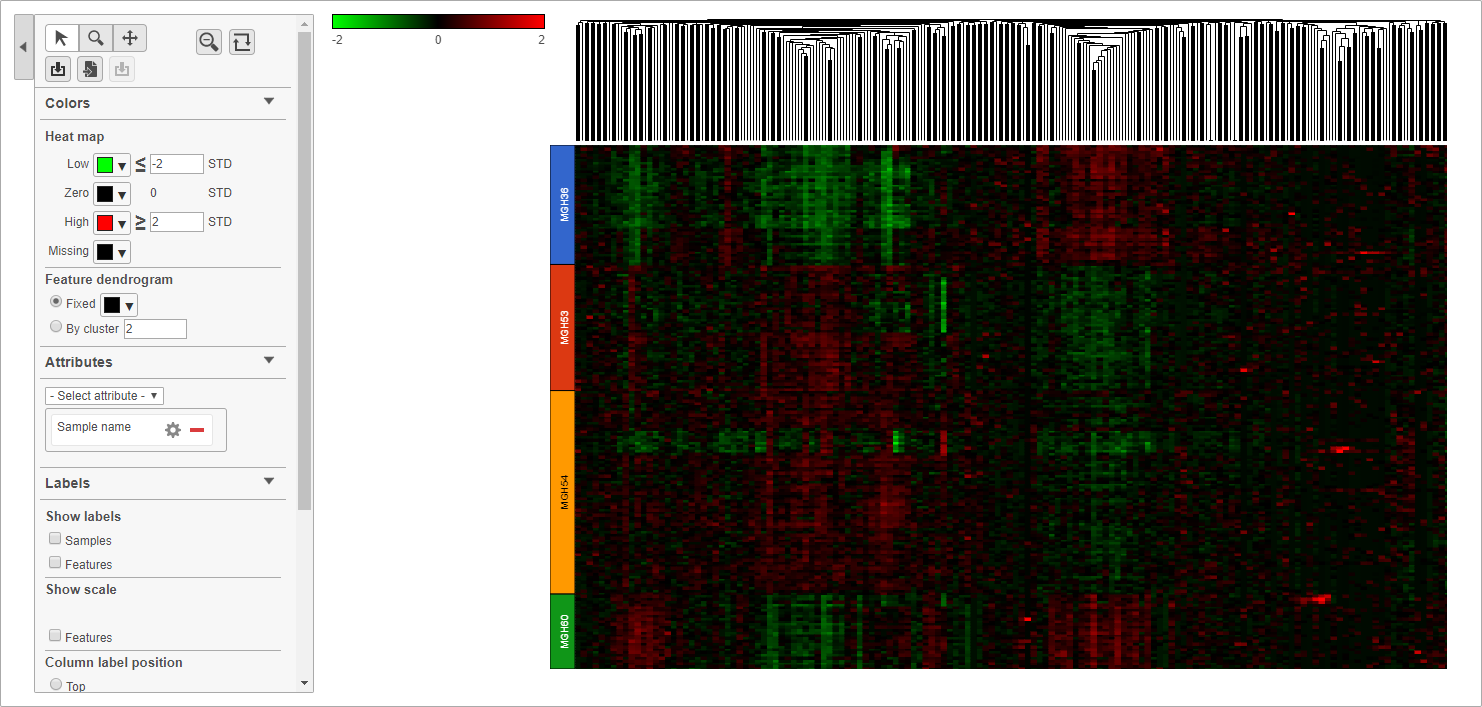
PNG File image2018-3-21 14:44:17.png |
253 kB |
Paul Fullerton |
Mar 21, 2018 14:44 |
Mar 21, 2018 14:44 |
|
Page: Compare expression between cell types with multiple samples
|
|
PNG File image2018-3-21 14:44:17.png |
253 kB |
Alex Rutkovsky |
Jul 12, 2023 07:38 |
Jul 12, 2023 07:38 |
|
Page: Make comparisons using Compute biomarkers and Biological interpretation
|
|
PNG File image2018-3-21 14:44:17.png |
253 kB |
Alex Rutkovsky |
Jul 07, 2023 11:29 |
Jul 07, 2023 11:29 |
|
Page: Spatial data analysis steps
|
|
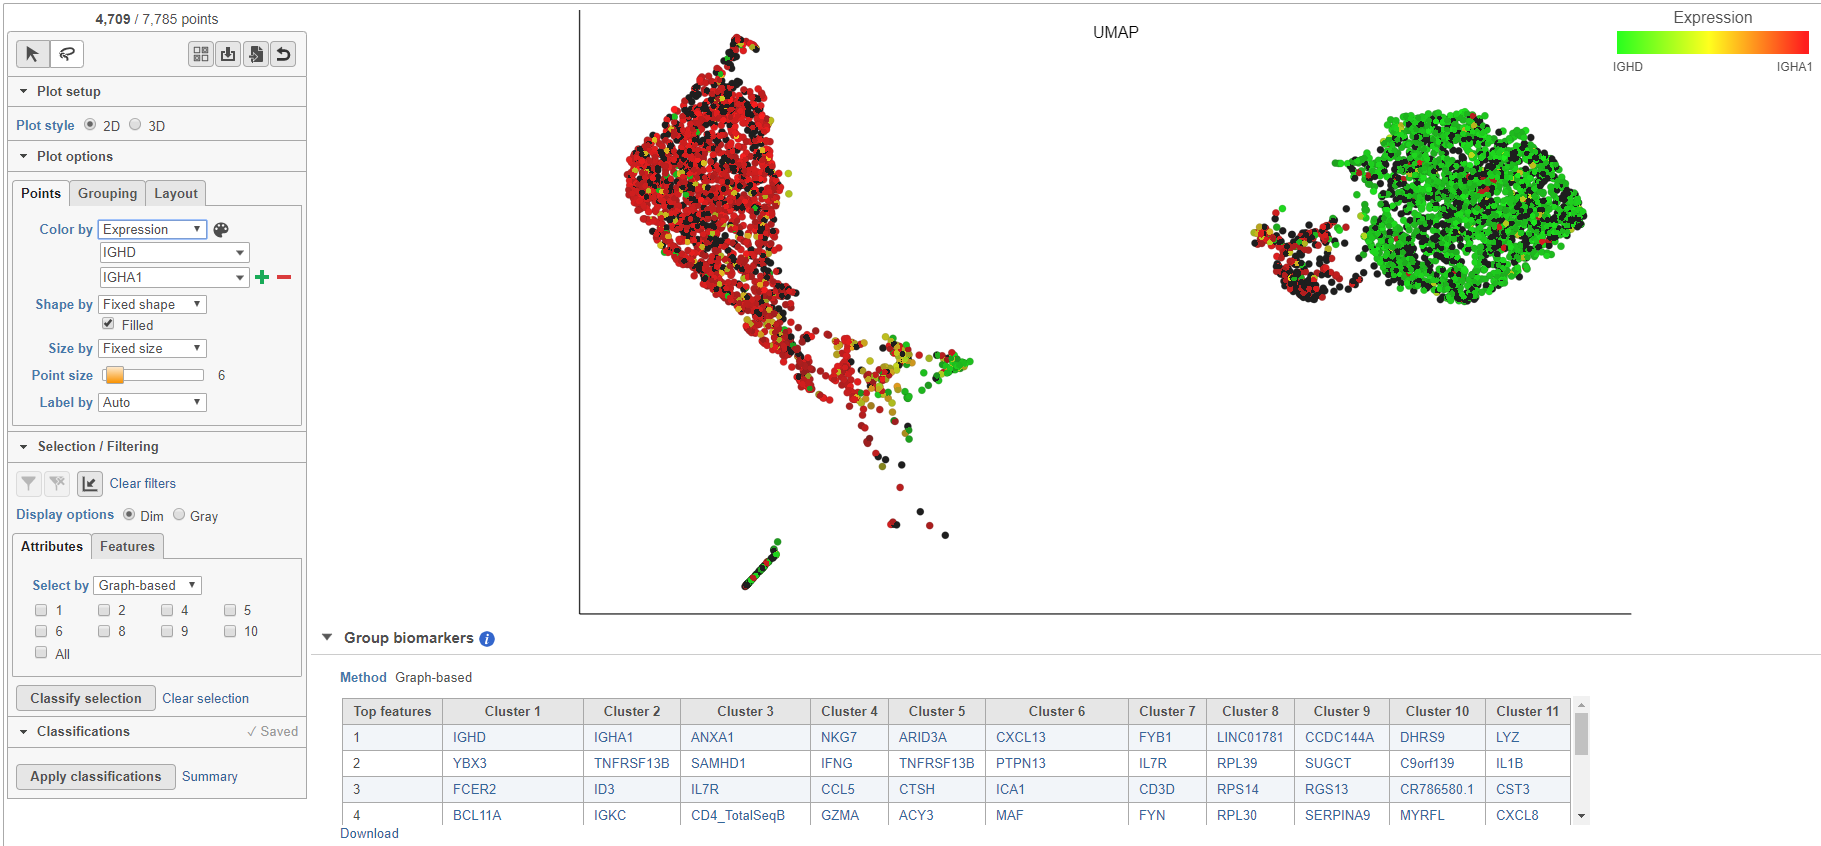
PNG File image2019-5-24 11:17:14.png |
252 kB |
Paul Fullerton |
May 24, 2019 11:17 |
May 24, 2019 11:17 |
|
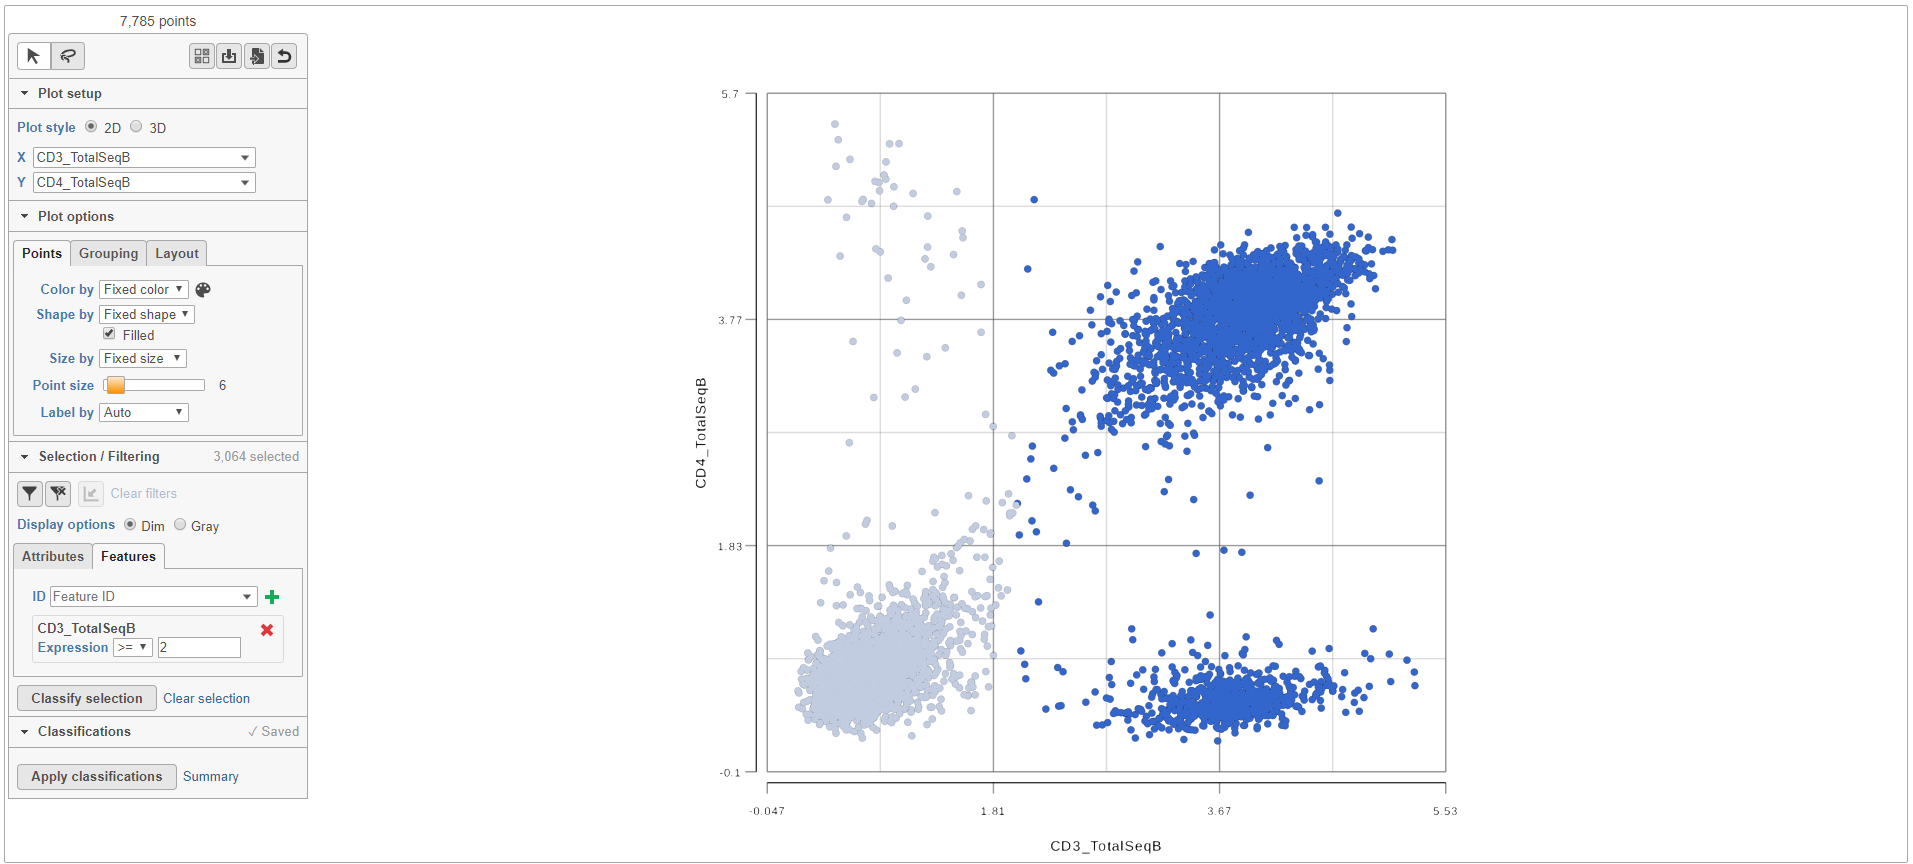
Page: Analyzing CITE-Seq Data
|
|
PNG File Color_by_sample.png |
251 kB |
Simit Patel |
Jun 16, 2020 07:18 |
Jun 16, 2020 07:18 |
|
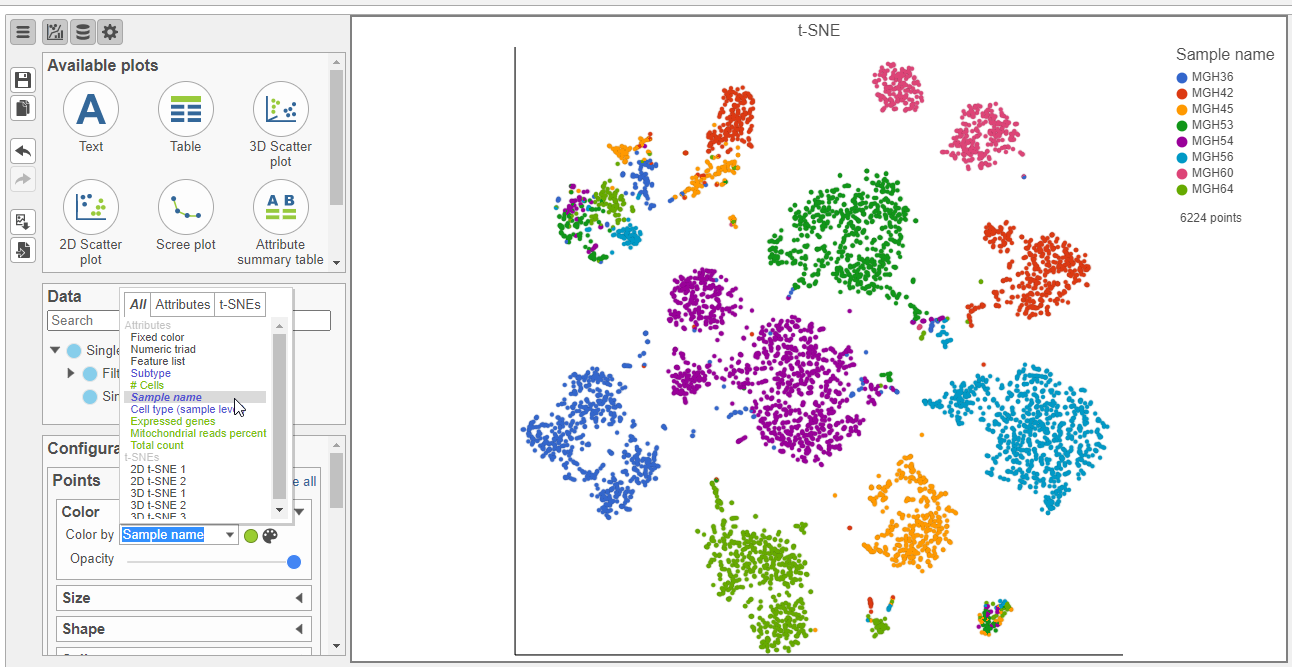
Page: Classify cells from multiple samples using t-SNE
|
|
PNG File Color_by_sample.png |
251 kB |
Alex Rutkovsky |
Jul 12, 2023 07:38 |
Jul 12, 2023 07:38 |
|
Page: Process Xenium data
|
|
PNG File Color_by_sample.png |
251 kB |
Alex Rutkovsky |
Jul 07, 2023 11:29 |
Jul 07, 2023 11:29 |
|
Page: Start with 10x Genomics Visium fastq files
|
|
PNG File image2019-5-21 13:48:0.png |
251 kB |
Paul Fullerton |
May 21, 2019 13:48 |
May 21, 2019 13:48 |
|
Page: Analyzing CITE-Seq Data
|
|
PNG File image2019-5-21 12:53:14.png |
251 kB |
Paul Fullerton |
May 21, 2019 12:53 |
May 21, 2019 12:53 |
|
Page: Analyzing CITE-Seq Data
|
|
PNG File Screenshot 2023-11-14 at 16.45.00.png |
251 kB |
Matteo Luberti |
Nov 14, 2023 10:45 |
Nov 14, 2023 10:45 |
|
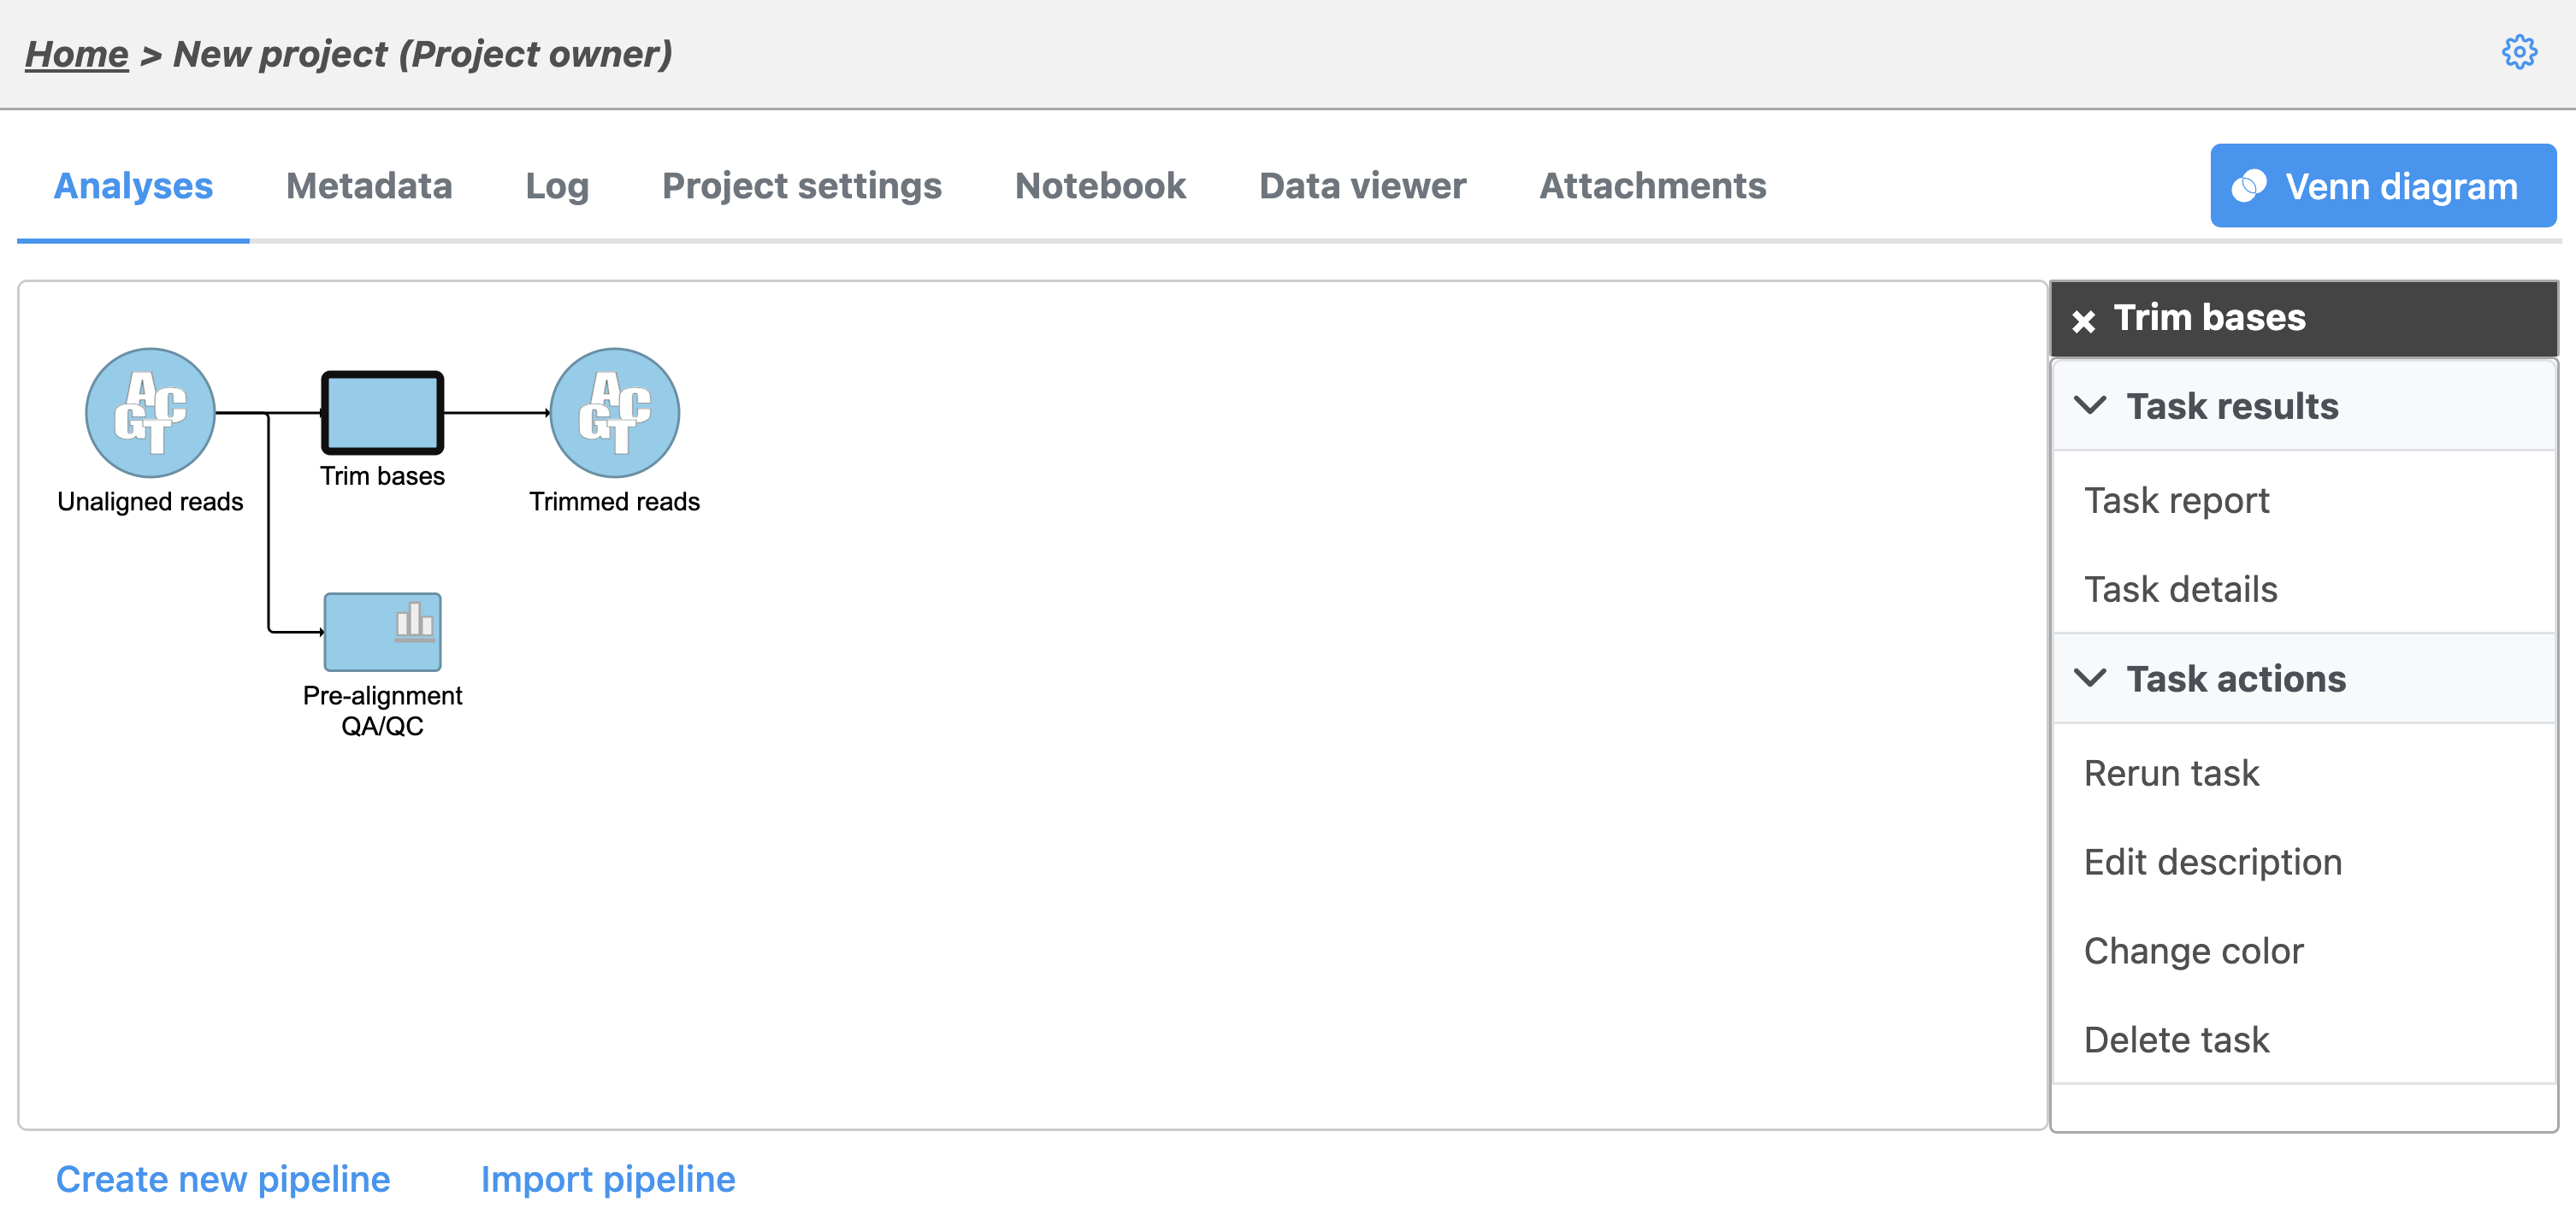
Page: The Analyses Tab
|
|
PNG File image2023-7-27_15-31-58.png |
249 kB |
Alex Rutkovsky |
Jul 27, 2023 14:31 |
Jul 27, 2023 14:31 |
|
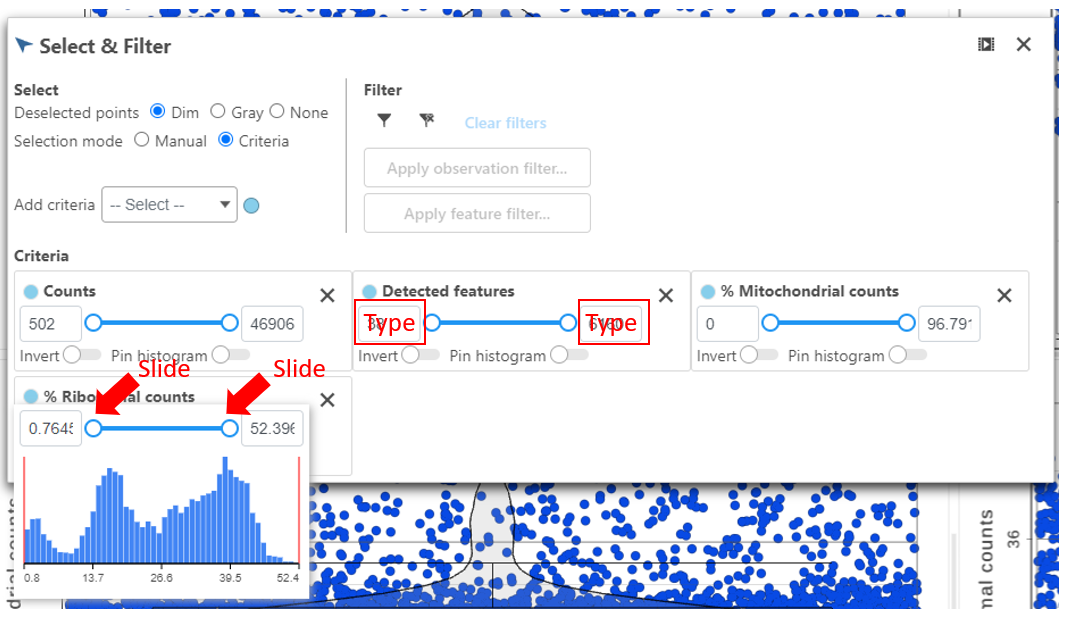
Page: Single-cell QA/QC
|
|
PNG File Screen Shot 2020-12-23 at 4.44.47 PM.png |
249 kB |
Zhengbin Liu |
Dec 24, 2020 10:23 |
Dec 24, 2020 10:23 |
|
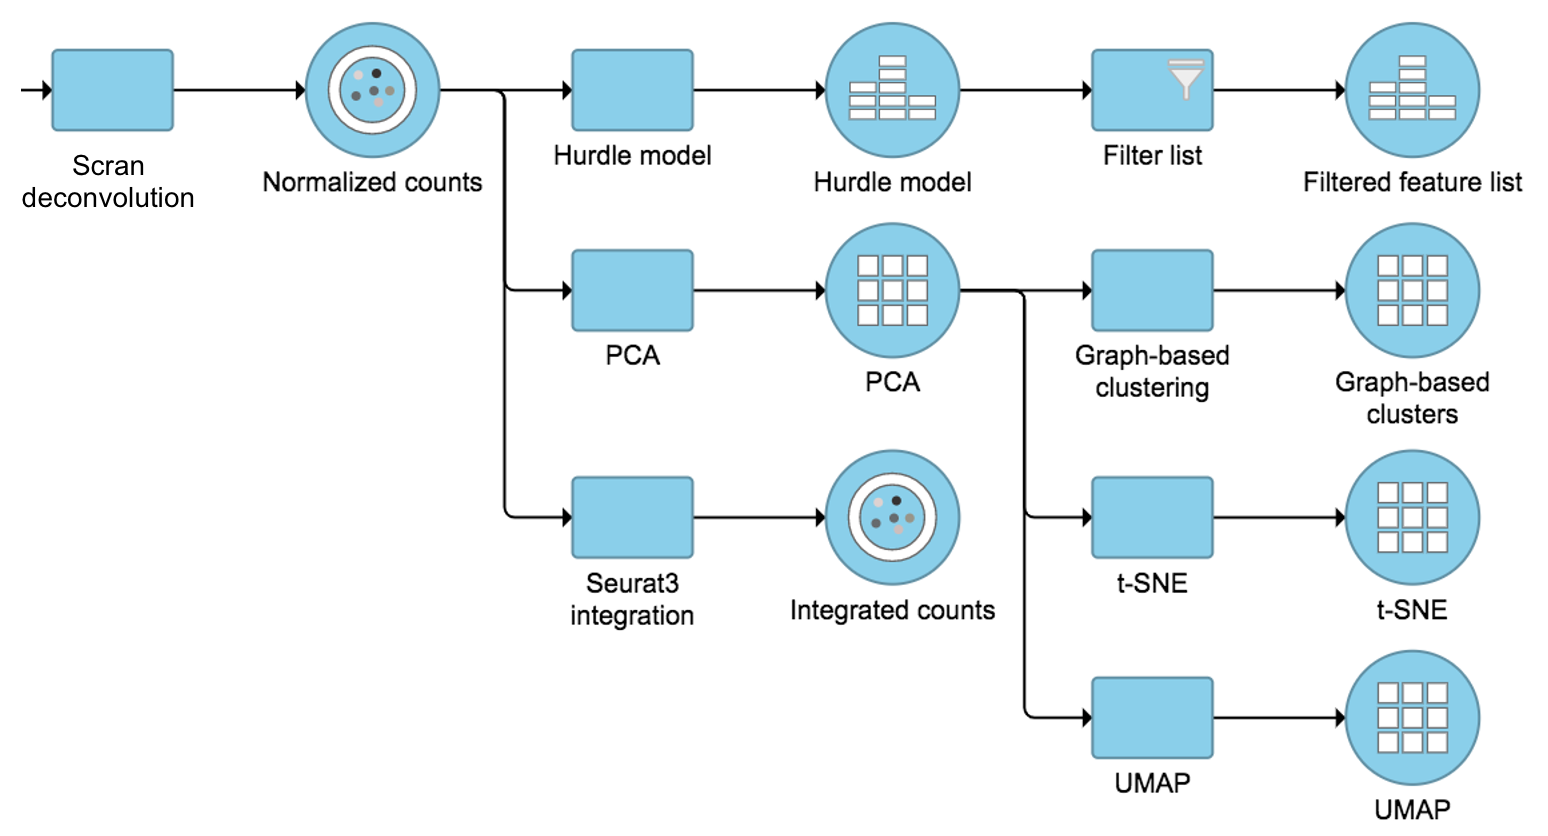
Page: Scran deconvolution
|
|
PNG File Screen Shot 2020-12-23 at 4.44.47 PM.png |
249 kB |
Zhengbin Liu |
Jul 15, 2022 10:06 |
Jul 15, 2022 10:06 |
|
Page: Promoter sum matrix
|
|
PNG File Screen Shot 2020-12-23 at 4.44.47 PM.png |
249 kB |
Zhengbin Liu |
Feb 15, 2022 16:03 |
Feb 15, 2022 16:03 |
|
Page: TF-IDF normalization
|
|
PNG File image2019-5-22 15:42:24.png |
248 kB |
Paul Fullerton |
May 22, 2019 15:42 |
May 22, 2019 15:42 |
|
Page: Analyzing CITE-Seq Data
|