Library size normalization is the simplest strategy for performing scaling normalization. But composition biases will be present when any unbalanced differential expression exists between samples. The removal of composition biases is a well-studied problem for bulk RNA sequencing data analysis. However, single-cell data can be problematic for these bulk normalization methods due to the dominance of low and zero counts[1]. To overcome this, Partek Flow wrapped the calculateSumFactors() function from R package scran. It pools counts from many cells to increase the size of the counts for accurate size factor estimation. Pool-based size factors are then “deconvolved” into cell-based factors for normalization of each cell’s expression profile[1].
Scran deconvolution in Flow can be invoked in Normalization and scaling section by clicking any single cell counts data node (Figure 1).
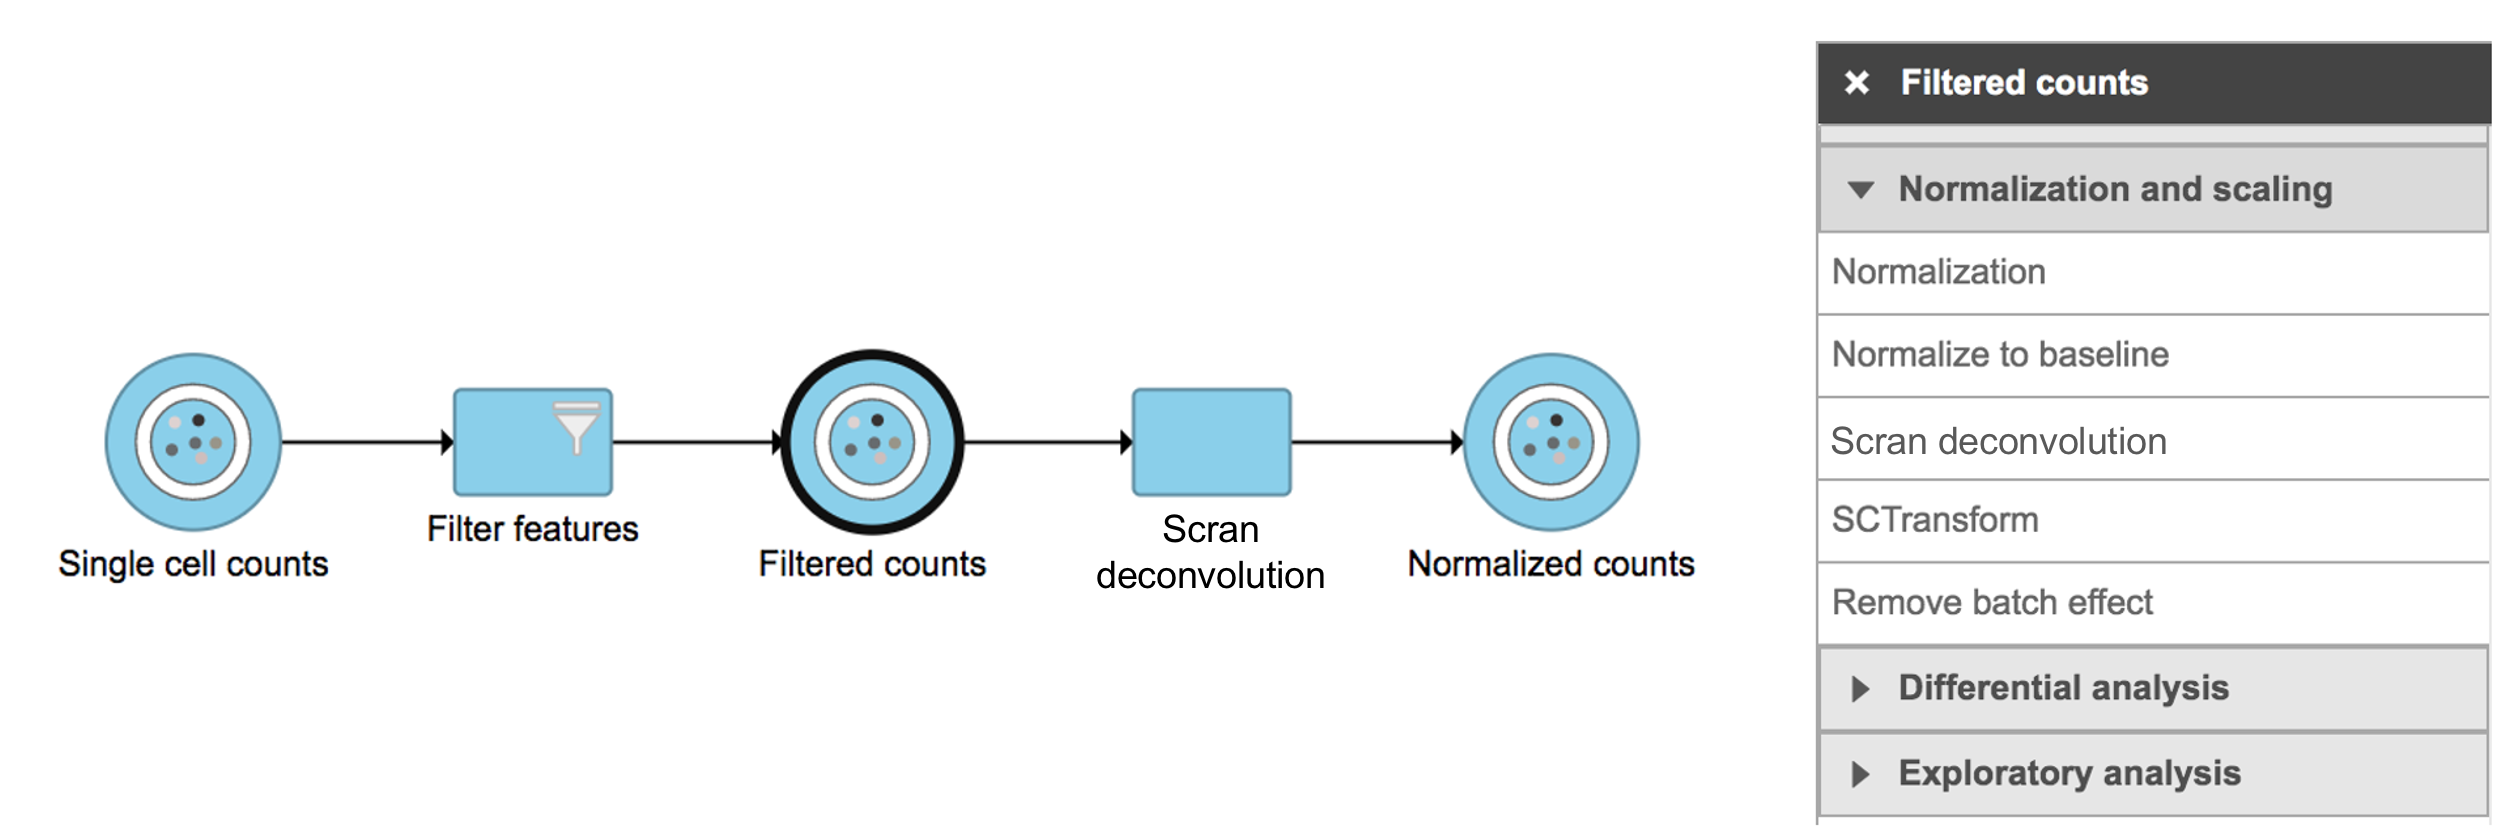
Figure 1. Scran deconvolution task in Normalization and scaling section in Flow.
To run Scran deconvolution,
- Click a single cell counts data node
- Click the Normalization and scaling section in the toolbox
- Click Scran deconvolution
The GUI is simple and easy to understand. The first Scran deconvolution dialog is asking to select the cluster name from a drop-down list that includes all the attributes for this dataset. The selected cluster is an optional factor specifying which cells belong to which cluster, for deconvolution within clusters (Figure 2). Simply click the Finish button if you want to run the task as default.
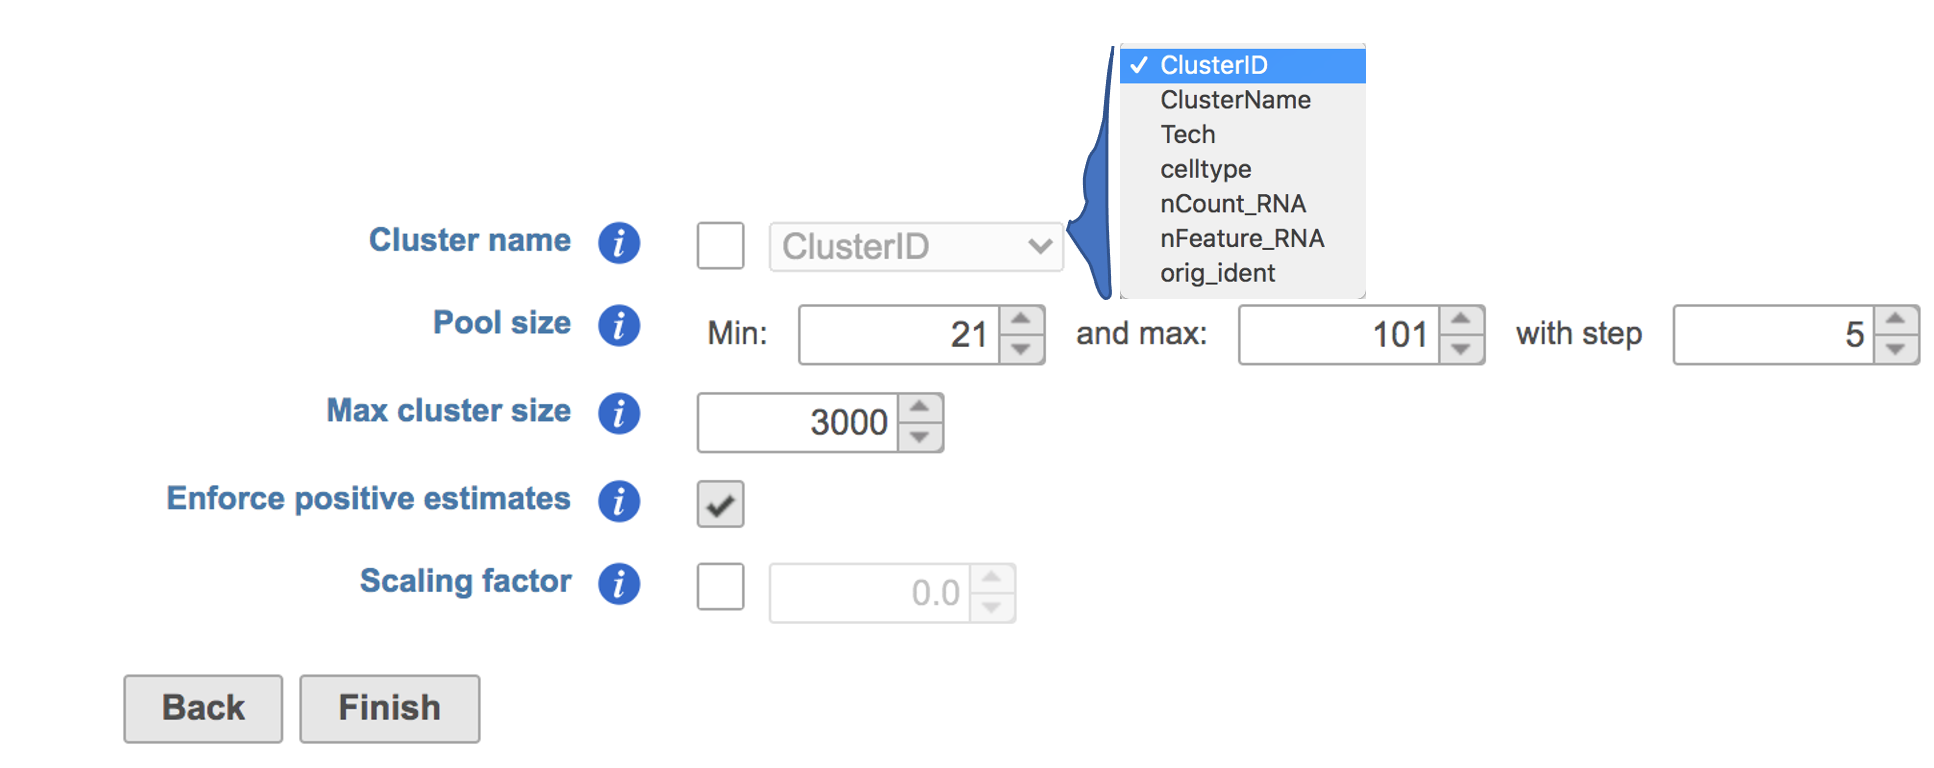
Figure 2. Interface of Scran deconvolution task in Partek Flow. Example attributes are indicated in the drop-down list if Cluster name is checked.
The output of Scran deconvolution is a new data node that has been normalized by the pool-based size factors of each cell and log2 transformed. We can then use this new normalized matrix for downstream analysis and visualization (Figure 3).
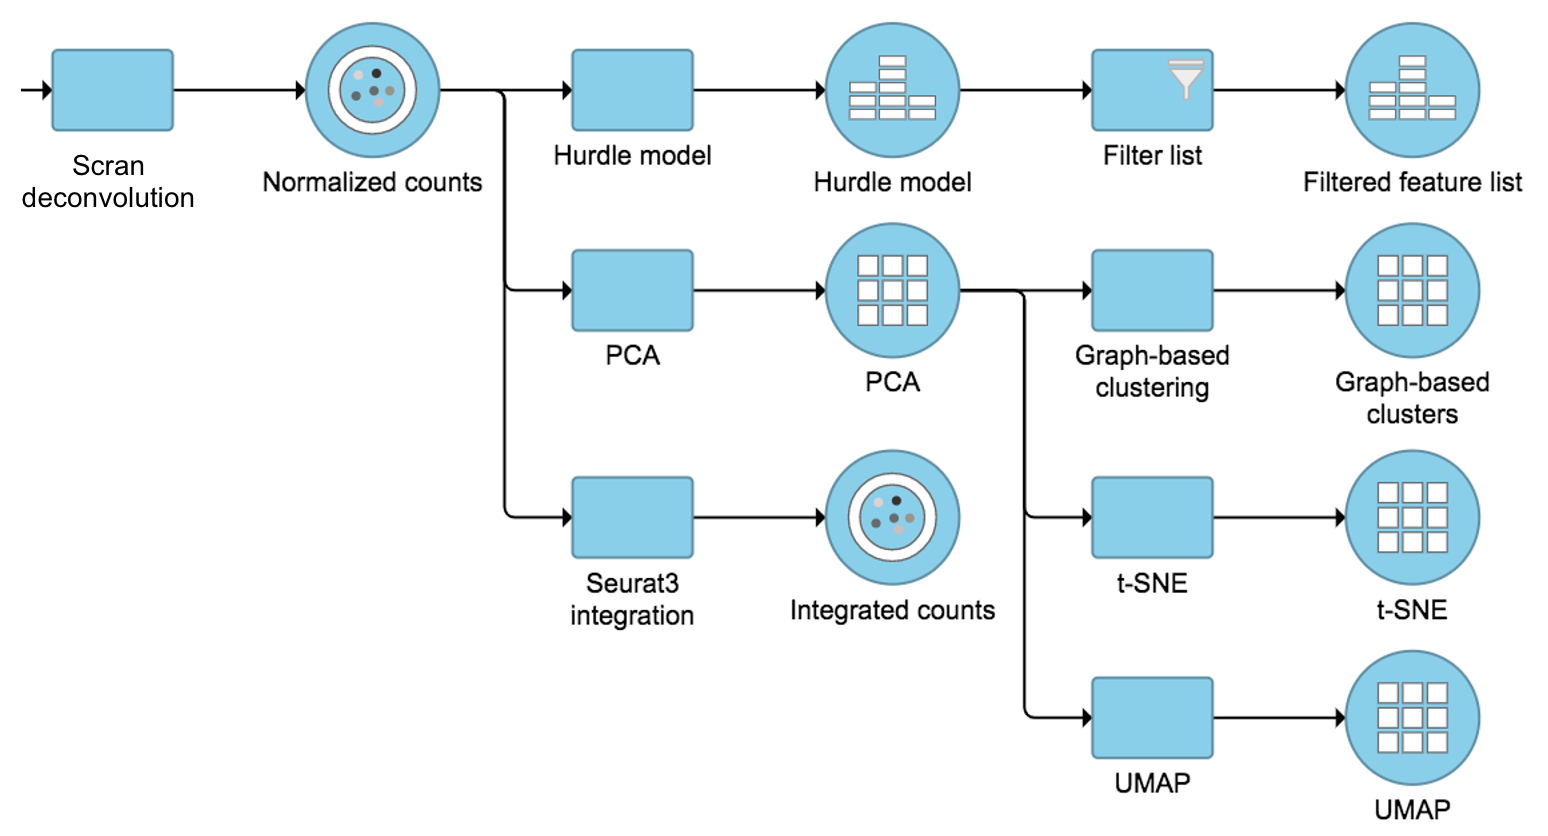
Figure 3. Example workflows to demonstrate downstream analysis and visualization of Scran deconvolution output.
Other parameters in this task that you can adjust include:
Pool size: A numeric vector of pool sizes, i.e., number of cells per pool.
Max cluster size: An integer scalar specifying the maximum number of cells in each cluster.
Enforce positive estimates: A logical scalar indicating whether linear inverse models should be used to enforce positive estimates.
Scaling factor: A numeric scalar containing scaling factors to adjust the counts prior to computing size factors.
References
- Lun, A. T., K. Bach, and J. C. Marioni. Pooling across cells to normalize single-cell RNA sequencing data with many zero counts. Genome Biol. 2016.
https://genomebiology.biomedcentral.com/articles/10.1186/s13059-016-0947-7
Additional Assistance
If you need additional assistance, please visit our support page to submit a help ticket or find phone numbers for regional support.
Overview
Content Tools