The Annotate regions task in Flow labels individual peaks as promoters for a particular gene if the peak falls 1000 bases upstream from a gene's transcription start site, or 1000 bases downstream from a gene's transcription start site by default. A promoter sum for a given gene is the number of cut sites per cell that fall within all the peaks labeled as promoters (-1000bp ~ 1000bp by default or user defined through Annotate regions) for that gene. Higher promoter sum values indicate higher chromatin accessibility in the promoter region [1].
Flow task Promoter sum matrix summarizes each promoter sum and outputs a cell x gene matrix. In the matrix, only genes that have peaks within its promoter region have been included. In Flow Promoter sum matrix can be invoked in the Peak analysis section by clicking the Annotated regions data node (Figure 1).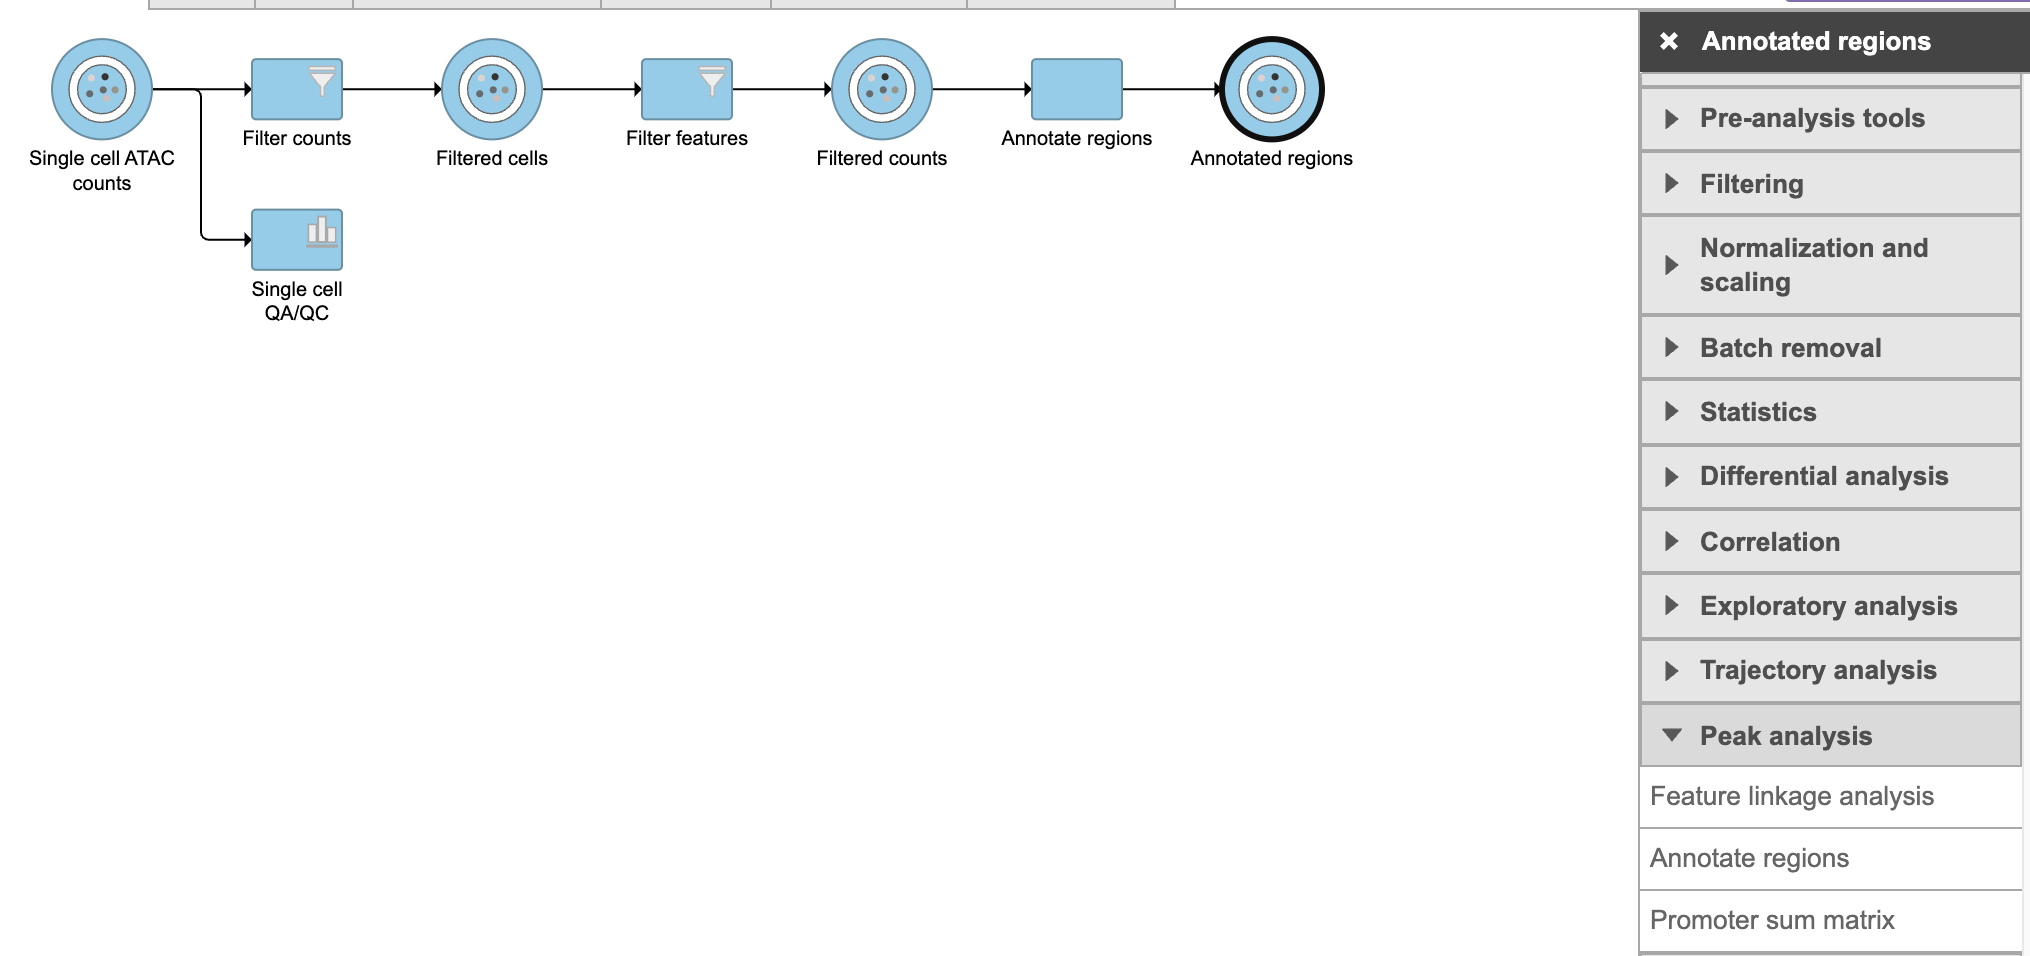
Figure 1. Promoter sum matrix task in Peak analysis section in Flow.
To run Promoter sum matrix in Flow,
- Click the Annotated regions data node
- Click the Peak analysis section in the toolbox
- Click Promoter sum matrix
Once the task has been finished, a new data node will be produced where the promoter sum value for each feature can be used to color UMAP/T-SNE and to determine cell type (Figure 2).
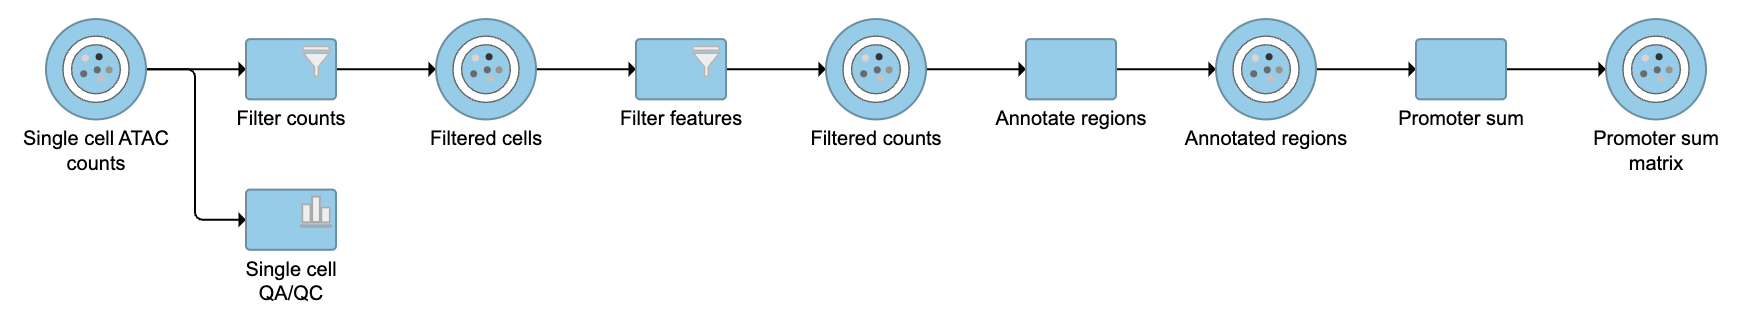
Figure 2. Output of Promoter sum matrix task in Partek Flow.
References
Additional Assistance
If you need additional assistance, please visit our support page to submit a help ticket or find phone numbers for regional support.
Overview
Content Tools