| Name
|
Size
|
Creator |
Creation Date
|
Last Modification Date
|
Labels |
Attached To |
|
PNG File image2018-12-11 11:1:26.png |
348 kB |
Alex Rutkovsky |
Jan 17, 2024 15:16 |
Jan 17, 2024 15:16 |
|
Page: Annotate Visium image
|
|
PNG File image2022-8-29_23-52-15.png |
347 kB |
Alex Rutkovsky |
Aug 29, 2022 22:52 |
Aug 29, 2022 22:52 |
|
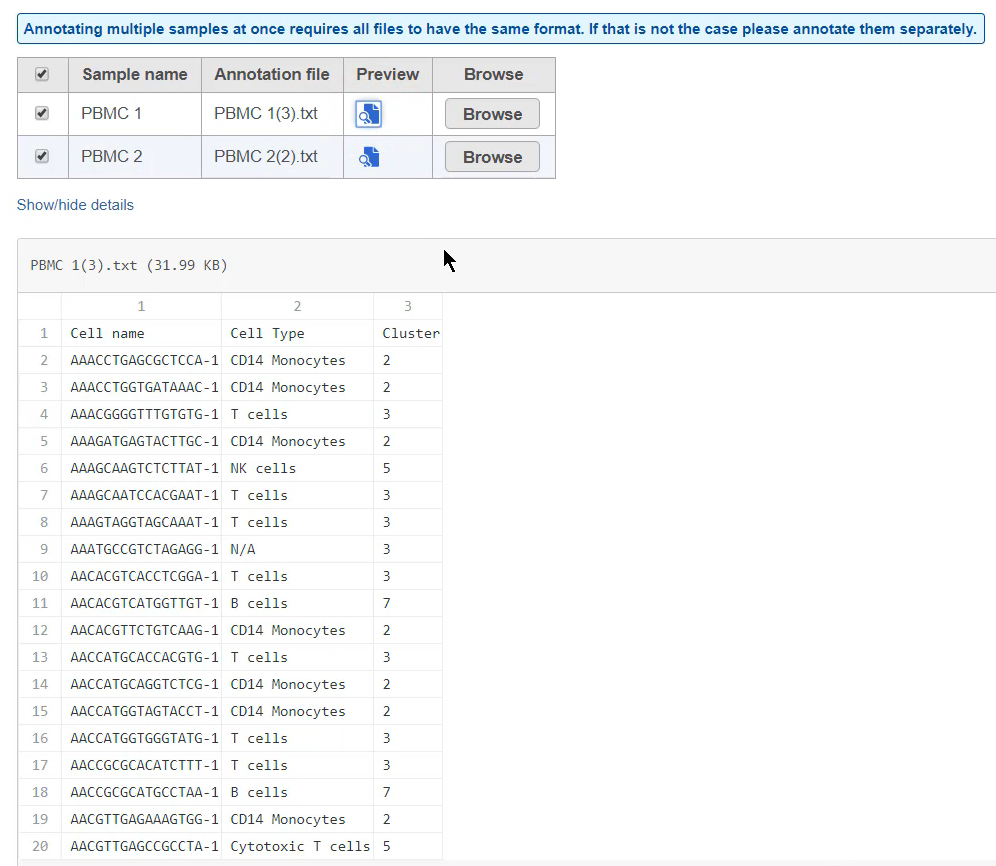
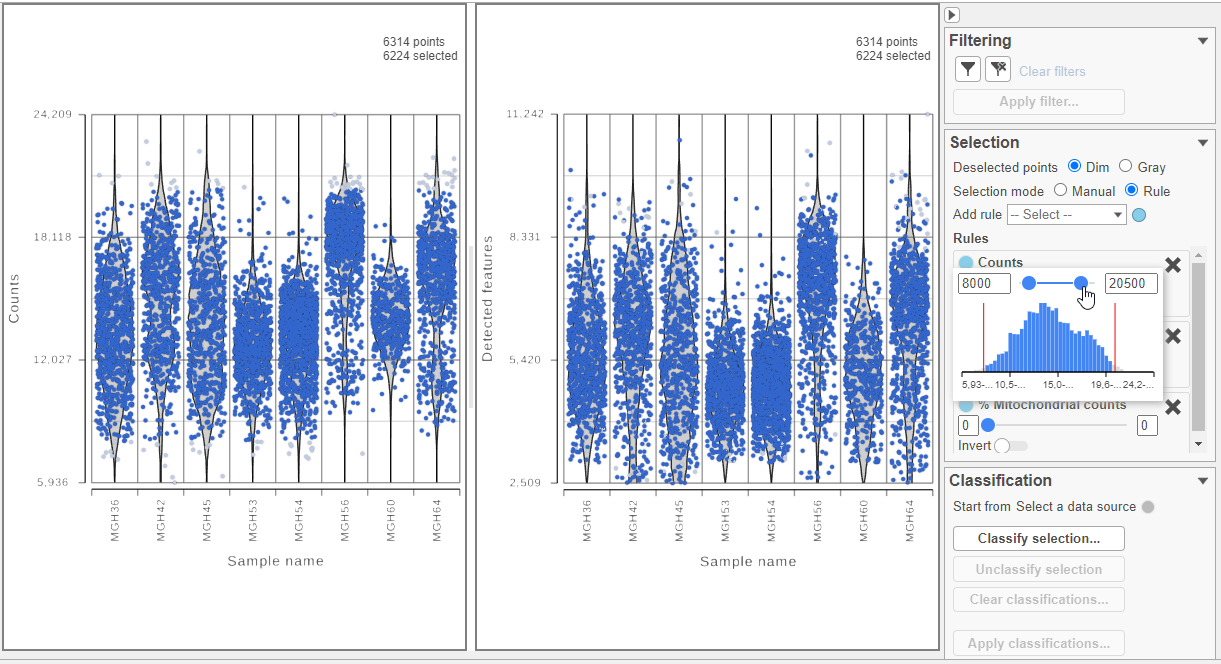
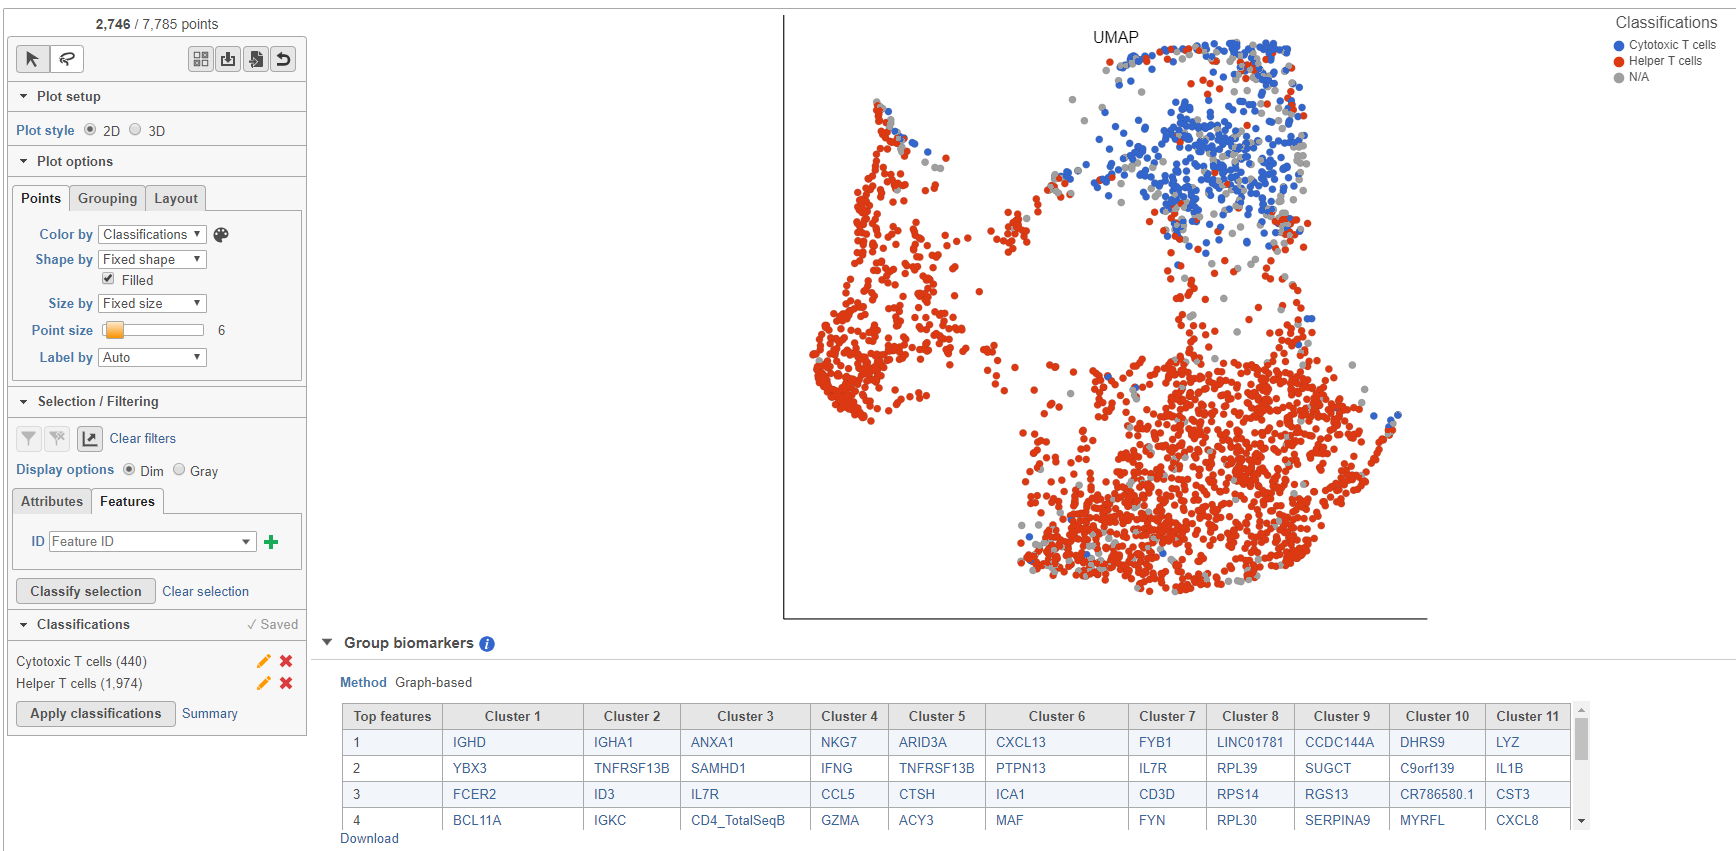
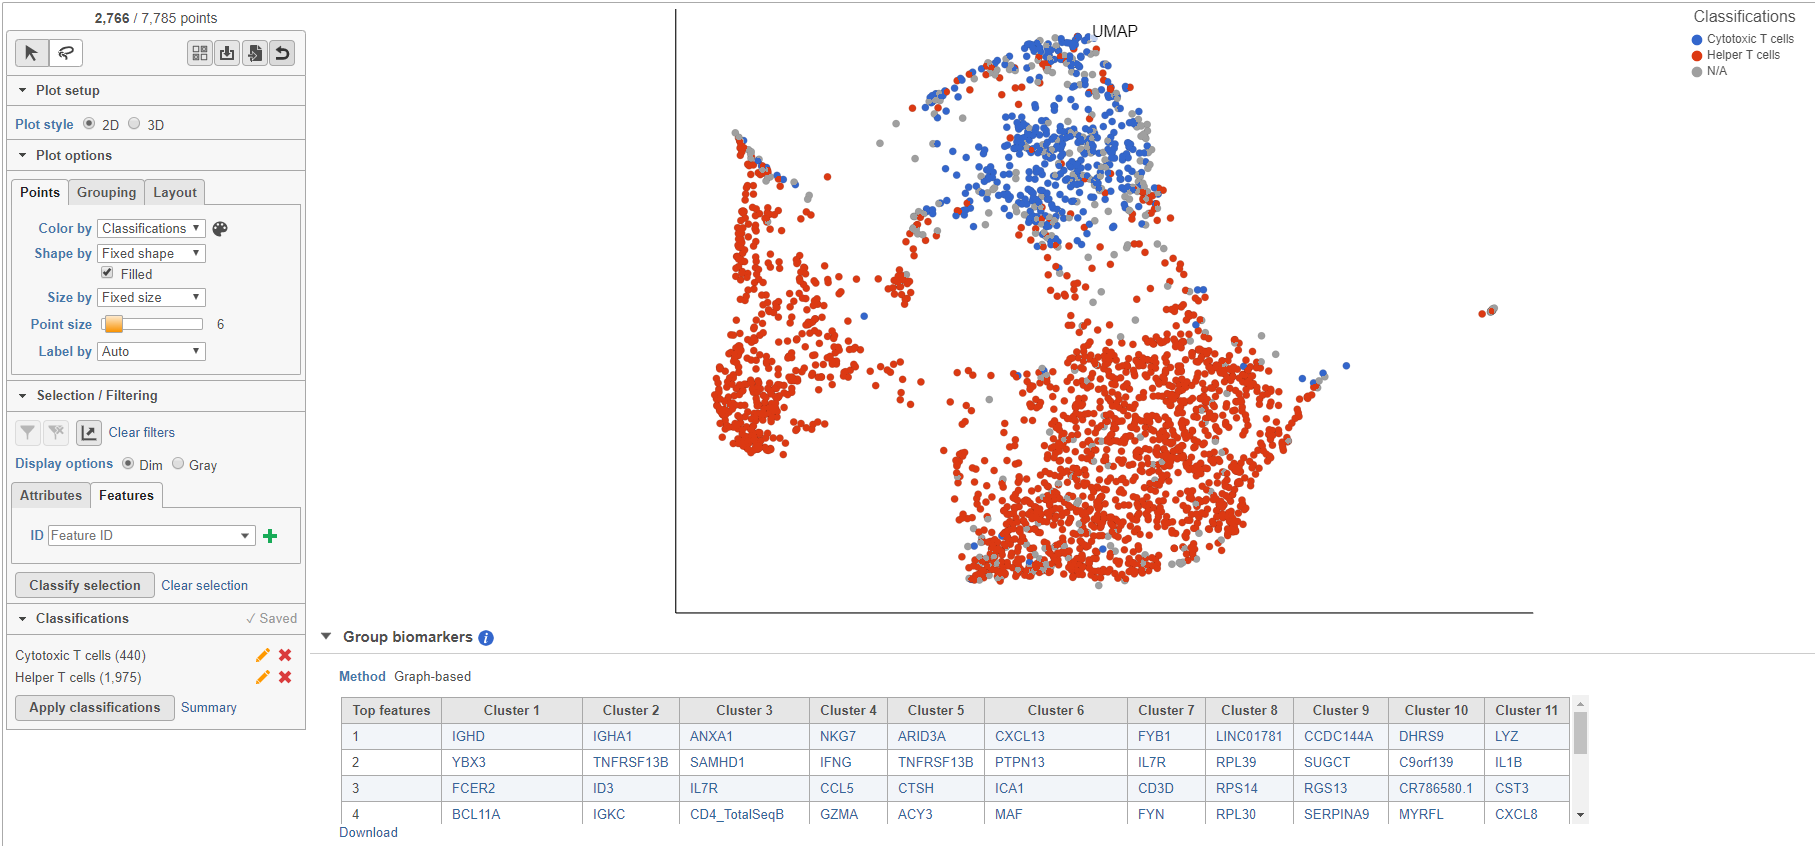
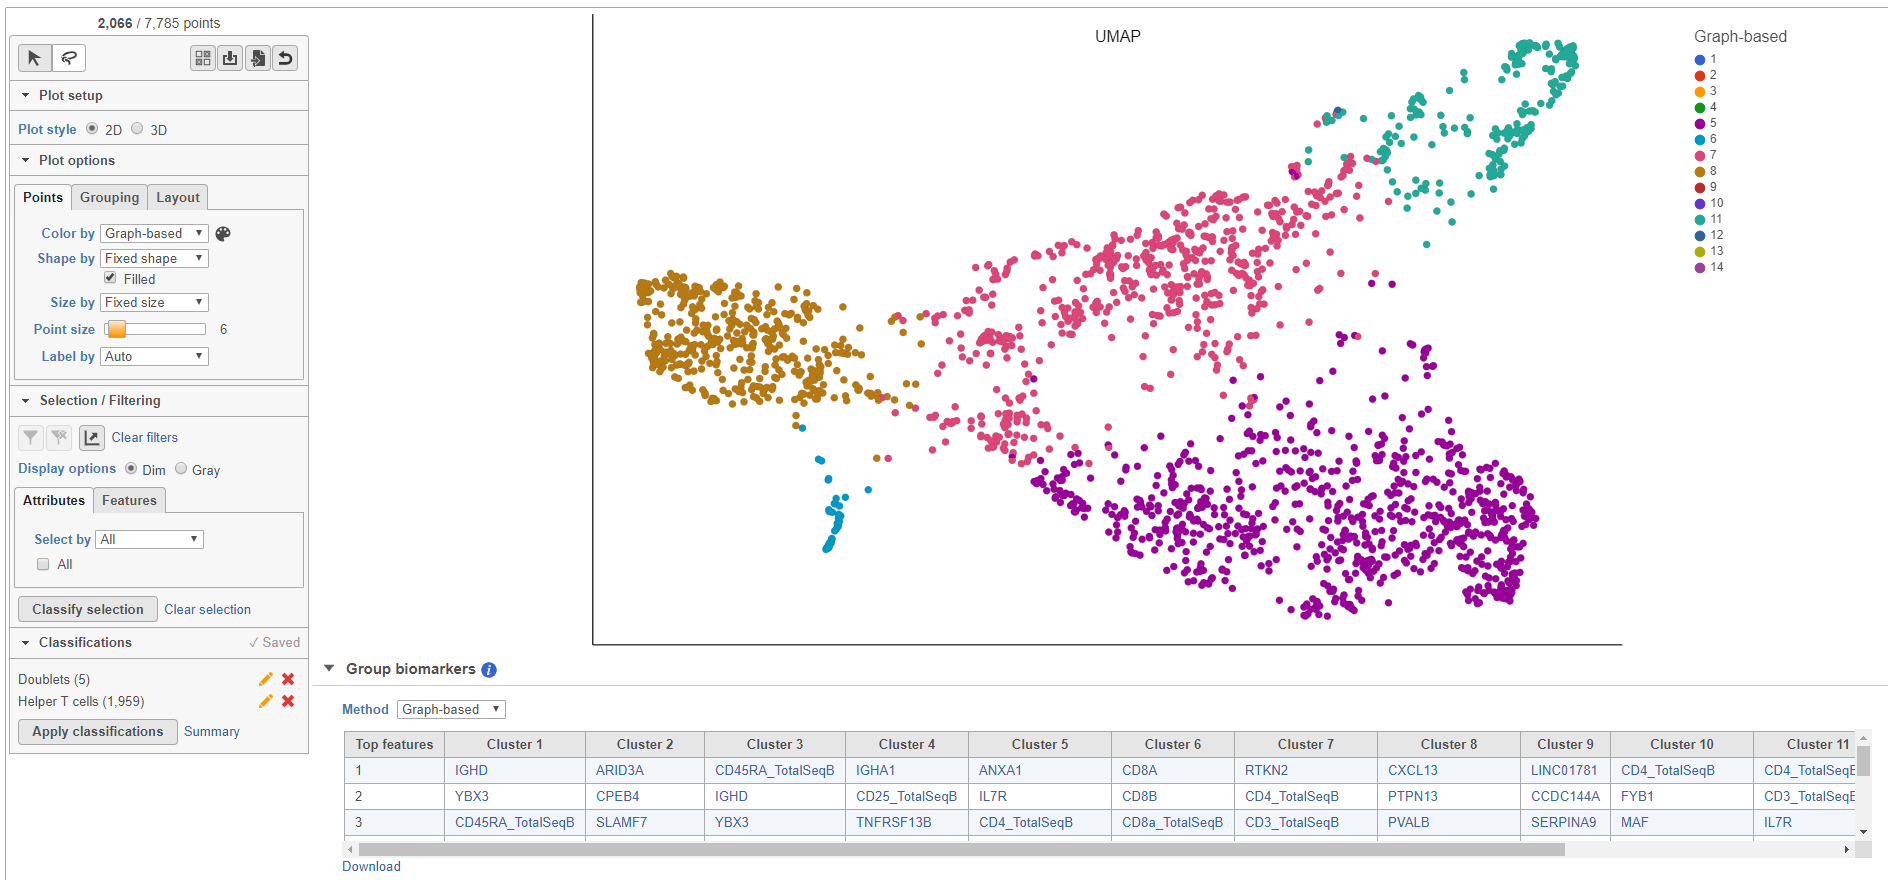
Page: Classifying Cells
|
|
PNG File Screenshot 2023-09-25 at 10.09.30.png |
346 kB |
Matteo Luberti |
Sep 25, 2023 04:14 |
Sep 25, 2023 04:14 |
|
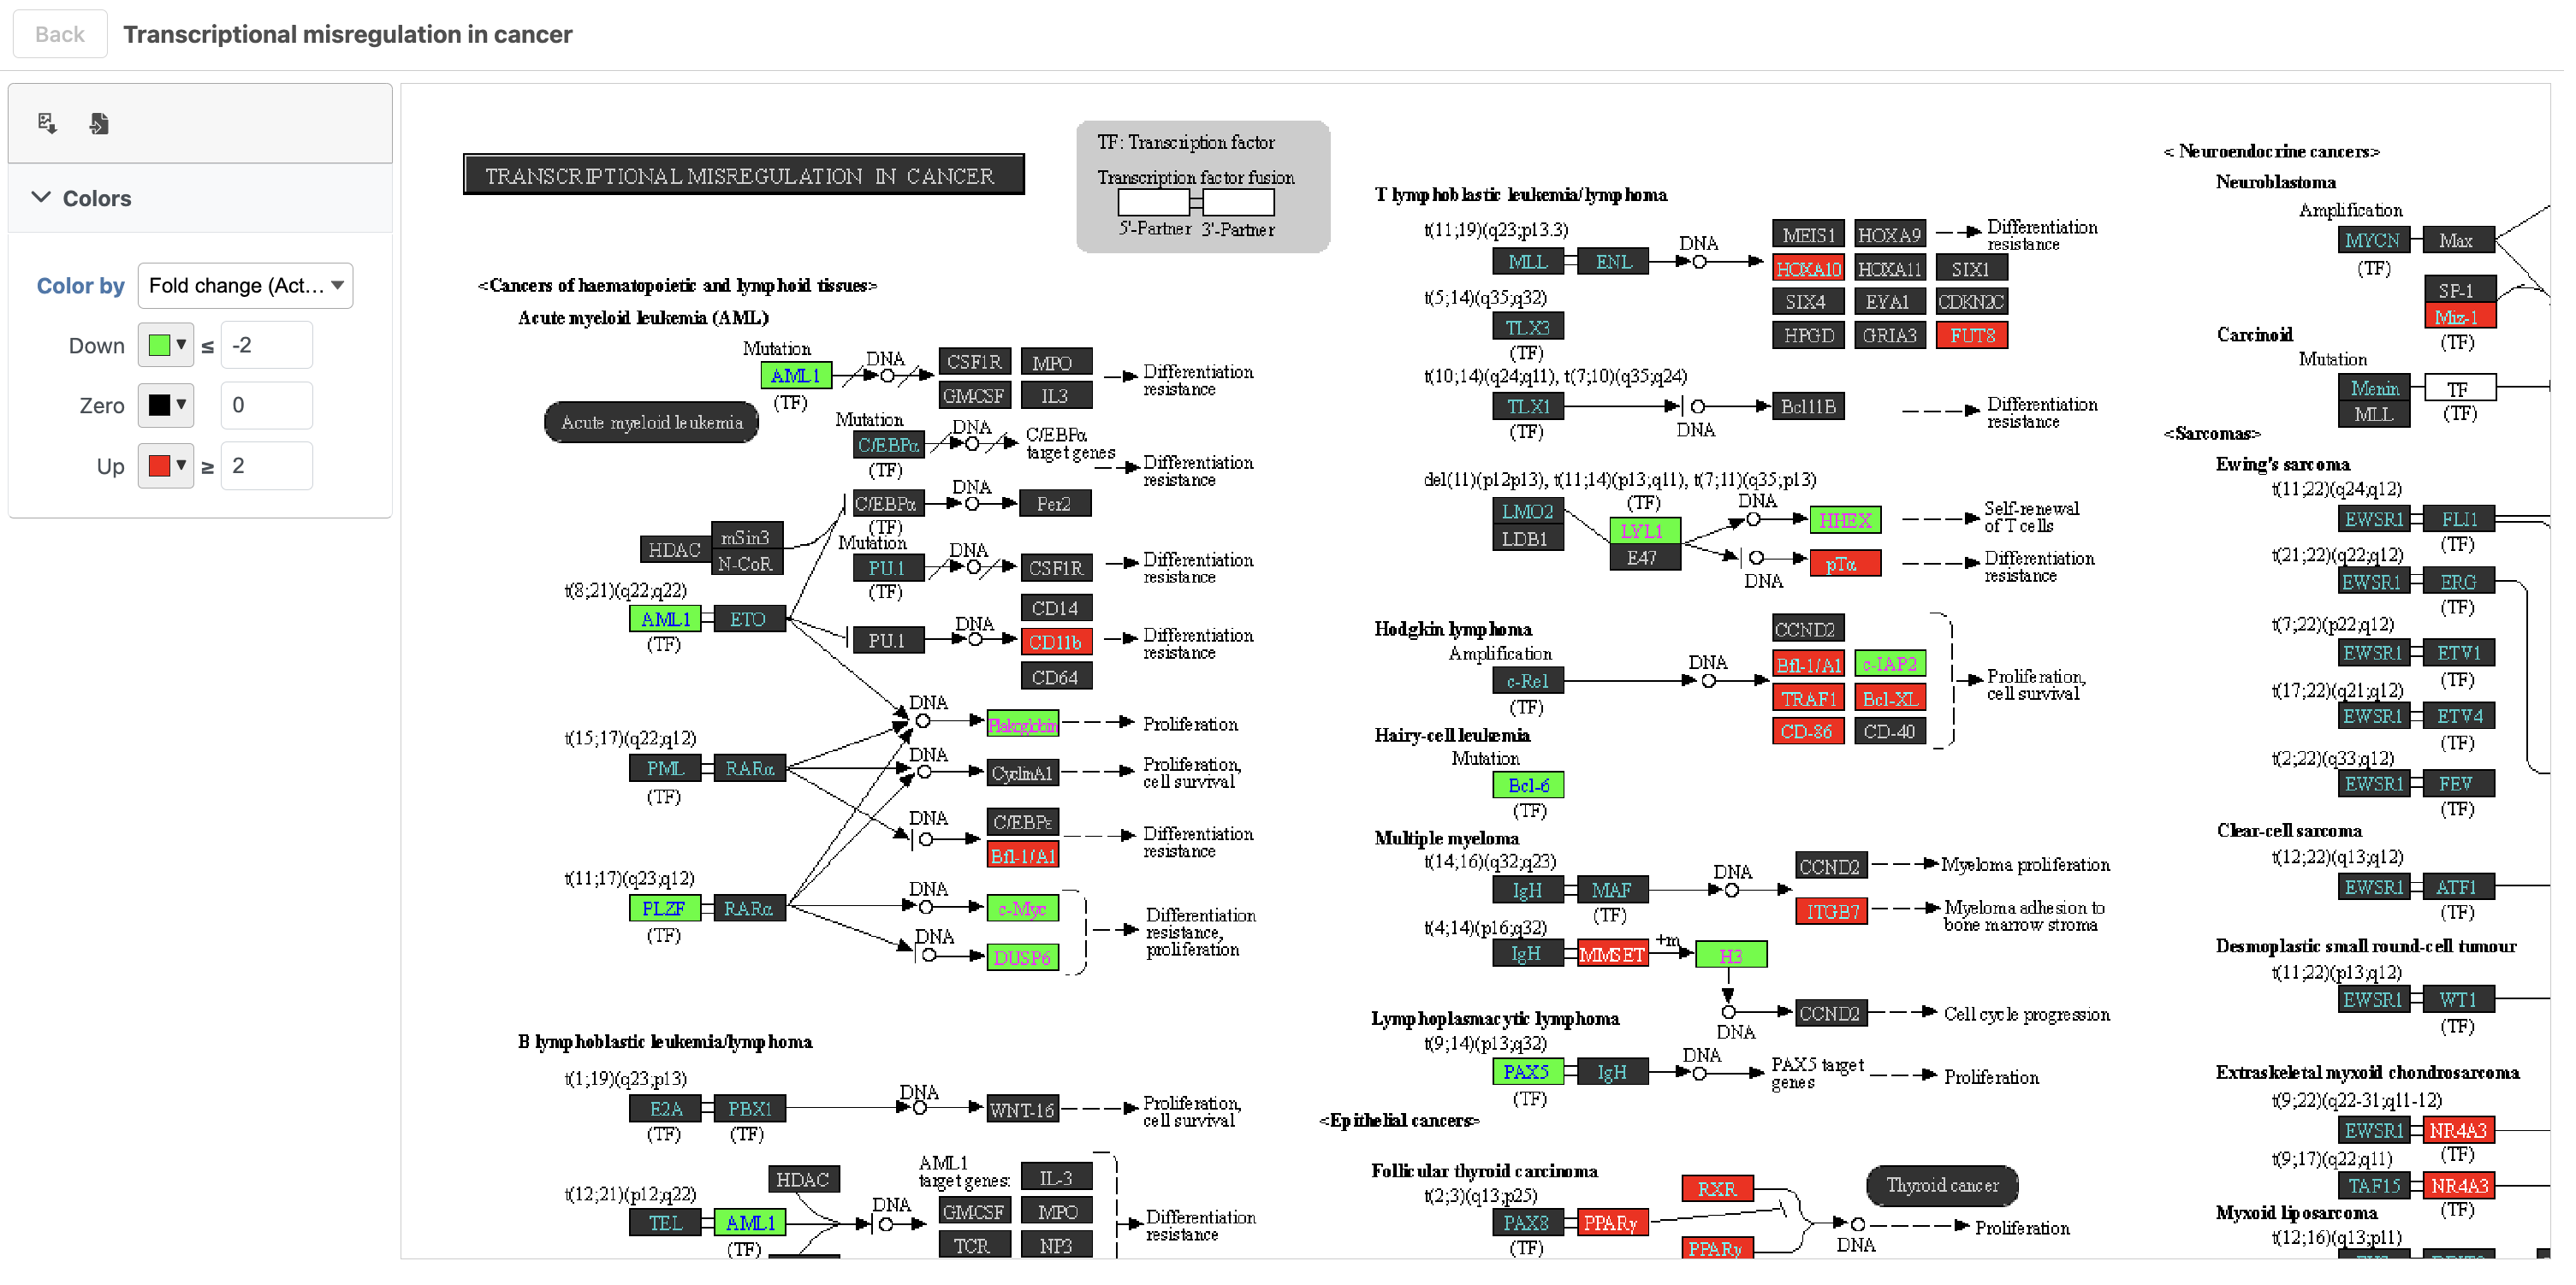
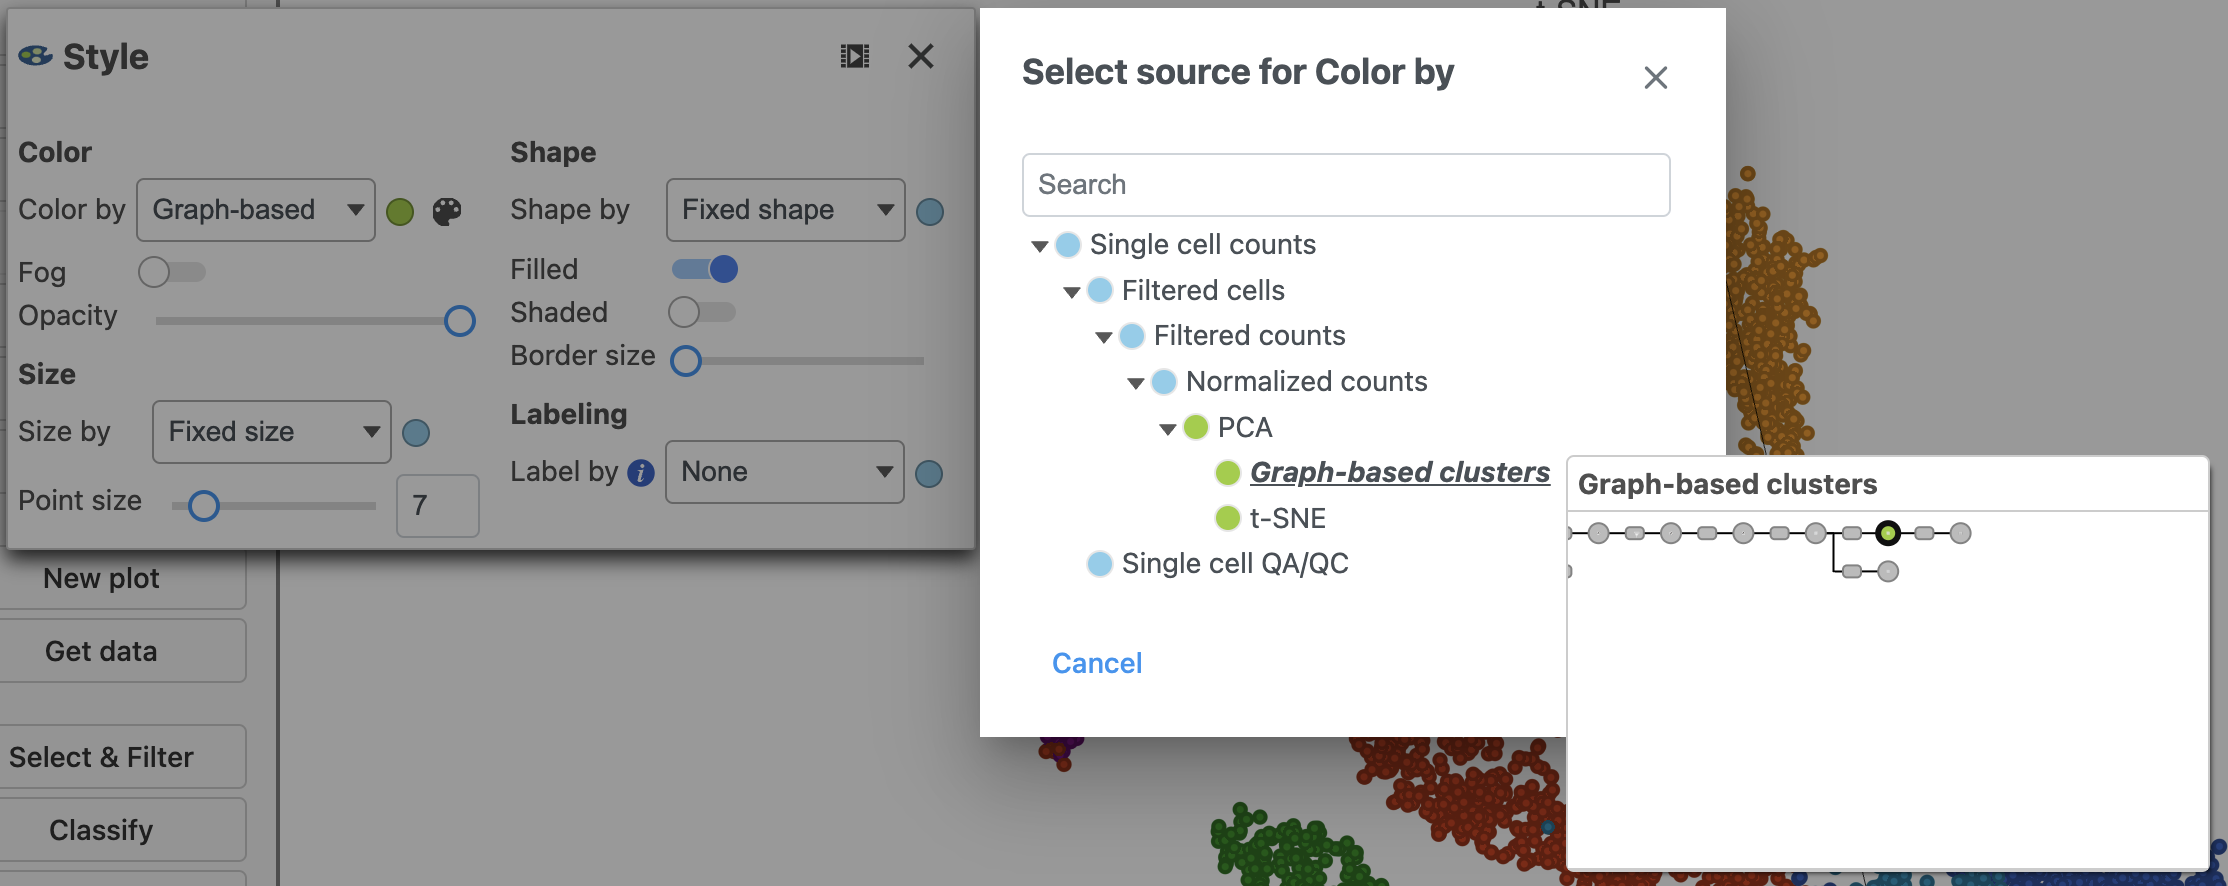
Page: Differentially Expressed Proteins and Genes
|
|
PNG File image2022-11-15_10-13-43.png |
346 kB |
Alex Rutkovsky |
Nov 15, 2022 09:13 |
Nov 15, 2022 09:13 |
|
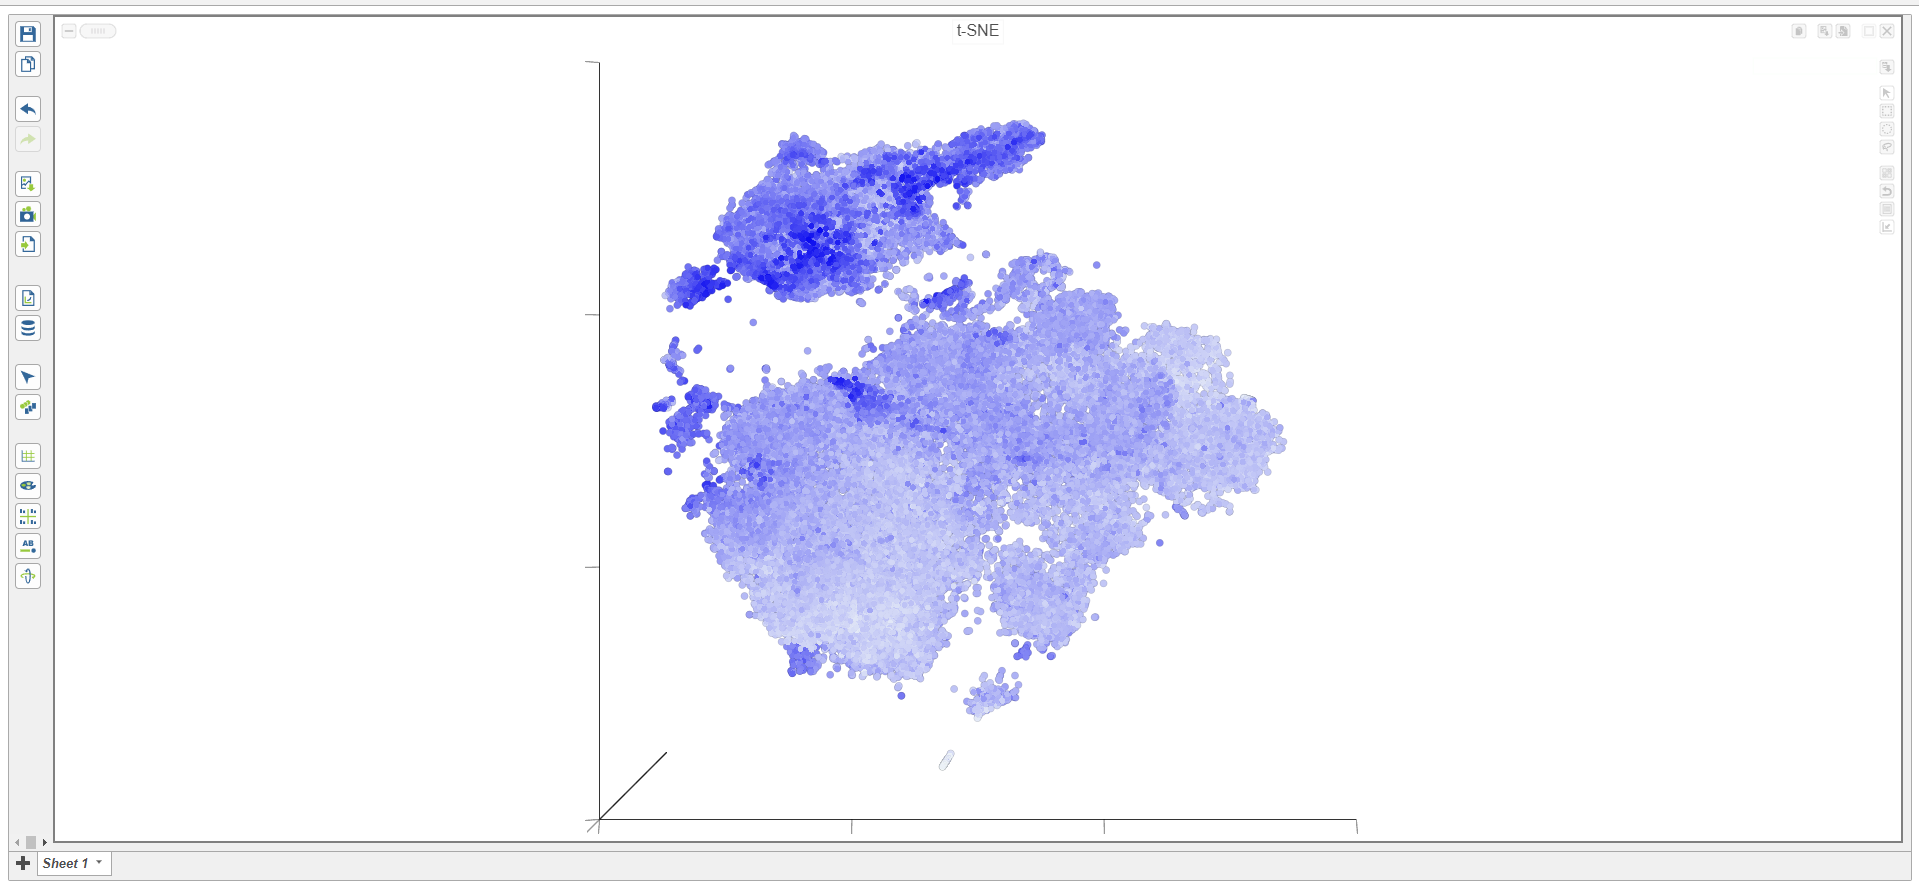
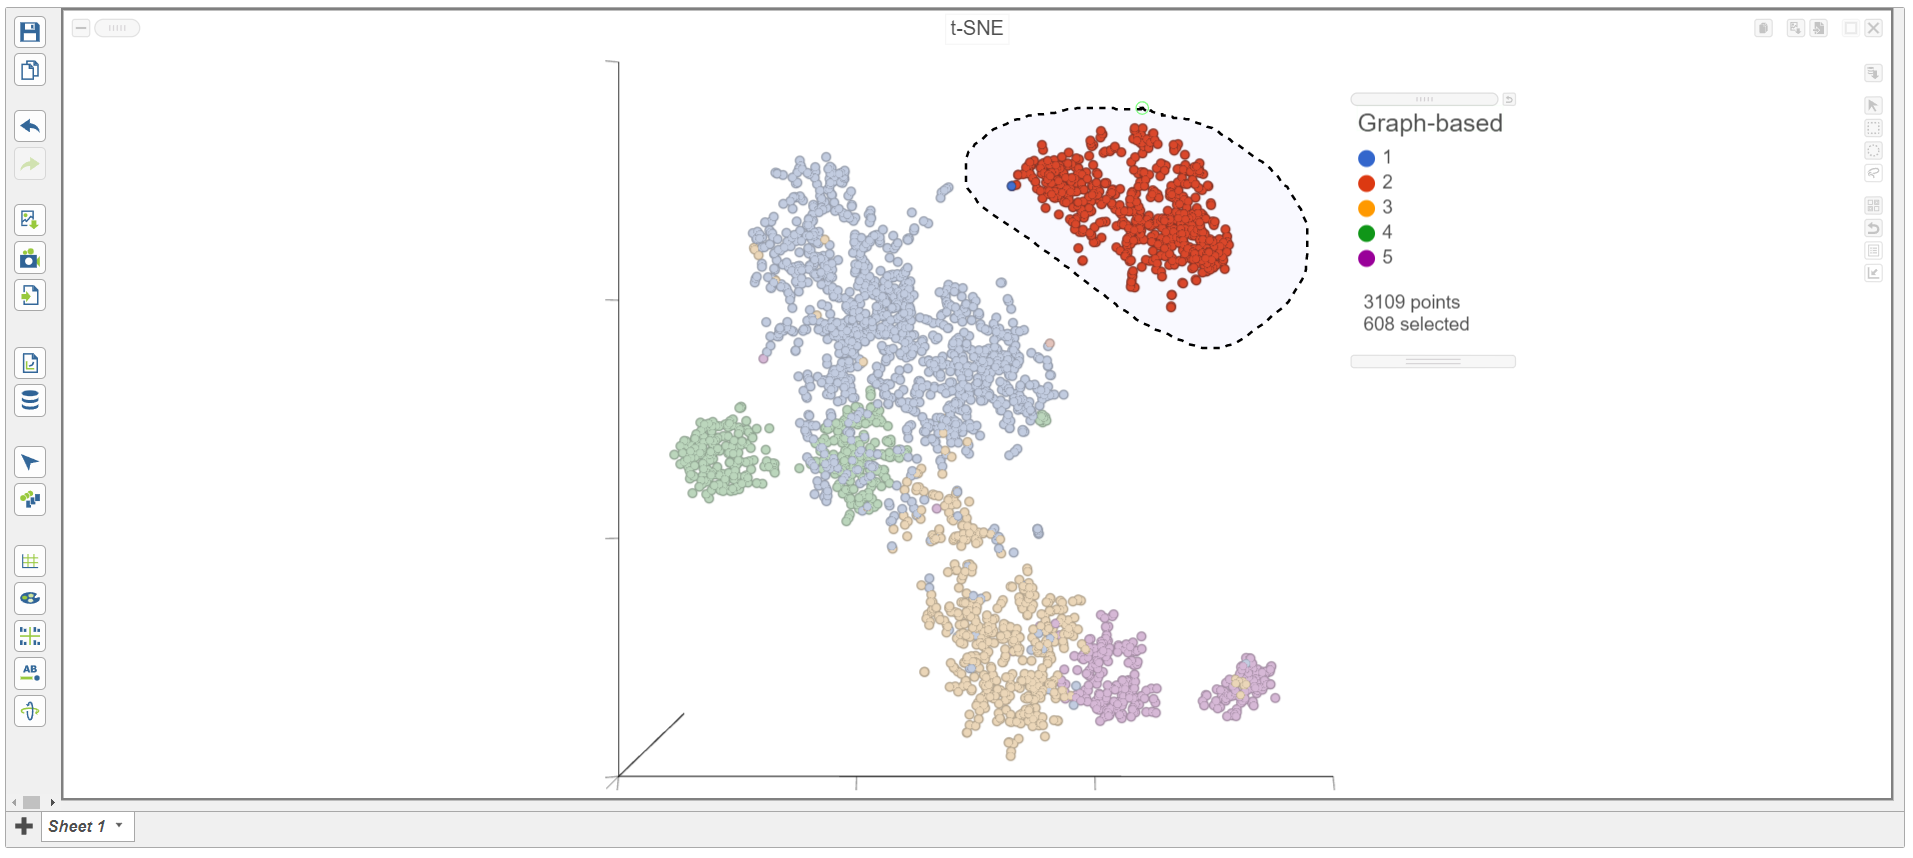
Page: t-SNE
|
|
PNG File image2022-11-15_10-14-7.png |
346 kB |
Alex Rutkovsky |
Nov 15, 2022 09:14 |
Nov 15, 2022 09:14 |
|
Page: t-SNE
|
|
PNG File Select cells.png |
341 kB |
Simit Patel |
Jun 10, 2020 11:29 |
Jun 10, 2020 11:29 |
|
Page: Getting started with the tutorial data set
|
|
PNG File Select cells.png |
341 kB |
Alex Rutkovsky |
Jul 07, 2023 11:29 |
Jul 07, 2023 11:29 |
|
Page: Start with pre-processed Space Ranger output files
|
|
PNG File Select cells.png |
341 kB |
Alex Rutkovsky |
Jul 12, 2023 07:38 |
Jul 12, 2023 07:38 |
|
Page: Import 10x Genomics Xenium Analyzer output
|
|
PNG File Screenshot 2023-09-15 at 15.33.50.png |
340 kB |
Matteo Luberti |
Sep 15, 2023 09:33 |
Sep 15, 2023 09:33 |
|
Page: Analyzing Single Cell RNA-Seq Data
|
|
PDF File bubble.pdf |
339 kB |
Alex Rutkovsky |
Apr 22, 2022 10:08 |
Apr 22, 2022 10:08 |
|
Page: Hierarchical Clustering
|
|
PNG File gsa_shrinkage_plot_2by40_threshold_low.png |
339 kB |
Cherry Ignacio |
Jan 12, 2018 13:47 |
Jan 12, 2018 14:07 |
|
Page: Single Cell Scaling
|
|
PNG File gsa_shrinkage_plot_2by40_threshold_low.png |
339 kB |
Xiaowen Wang |
Dec 28, 2018 11:04 |
Dec 28, 2018 11:05 |
|
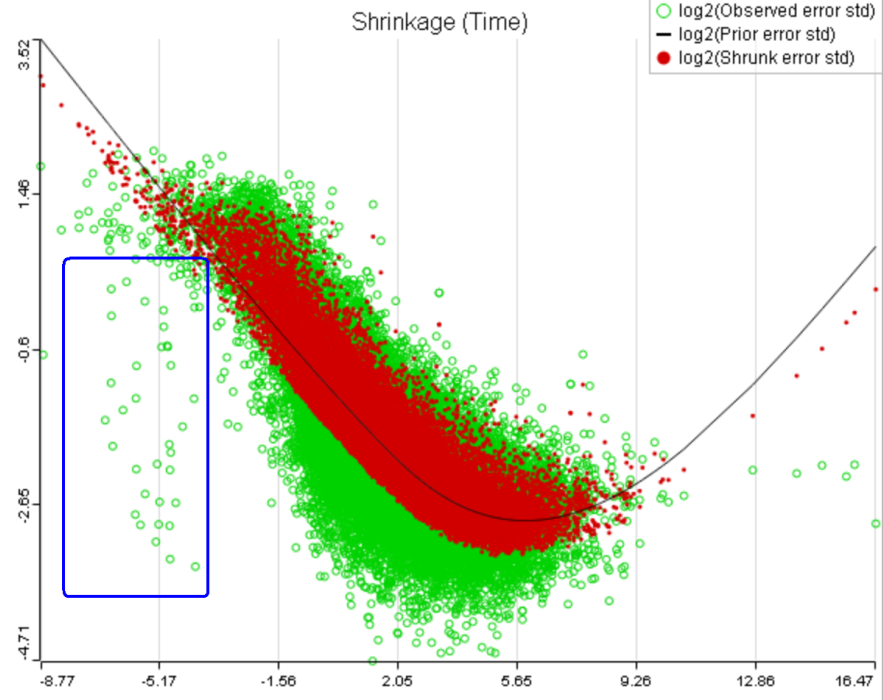
Page: Mapping error statistics
|
|
PNG File gsa_shrinkage_plot_2by40_threshold_low.png |
339 kB |
admin |
Jun 09, 2016 10:19 |
Jul 19, 2016 14:30 |
|
Page: Gene-specific Analysis
|
|
PNG File Screenshot 2023-08-09 at 14.35.00.png |
339 kB |
Matteo Luberti |
Aug 09, 2023 09:51 |
Aug 09, 2023 09:51 |
|
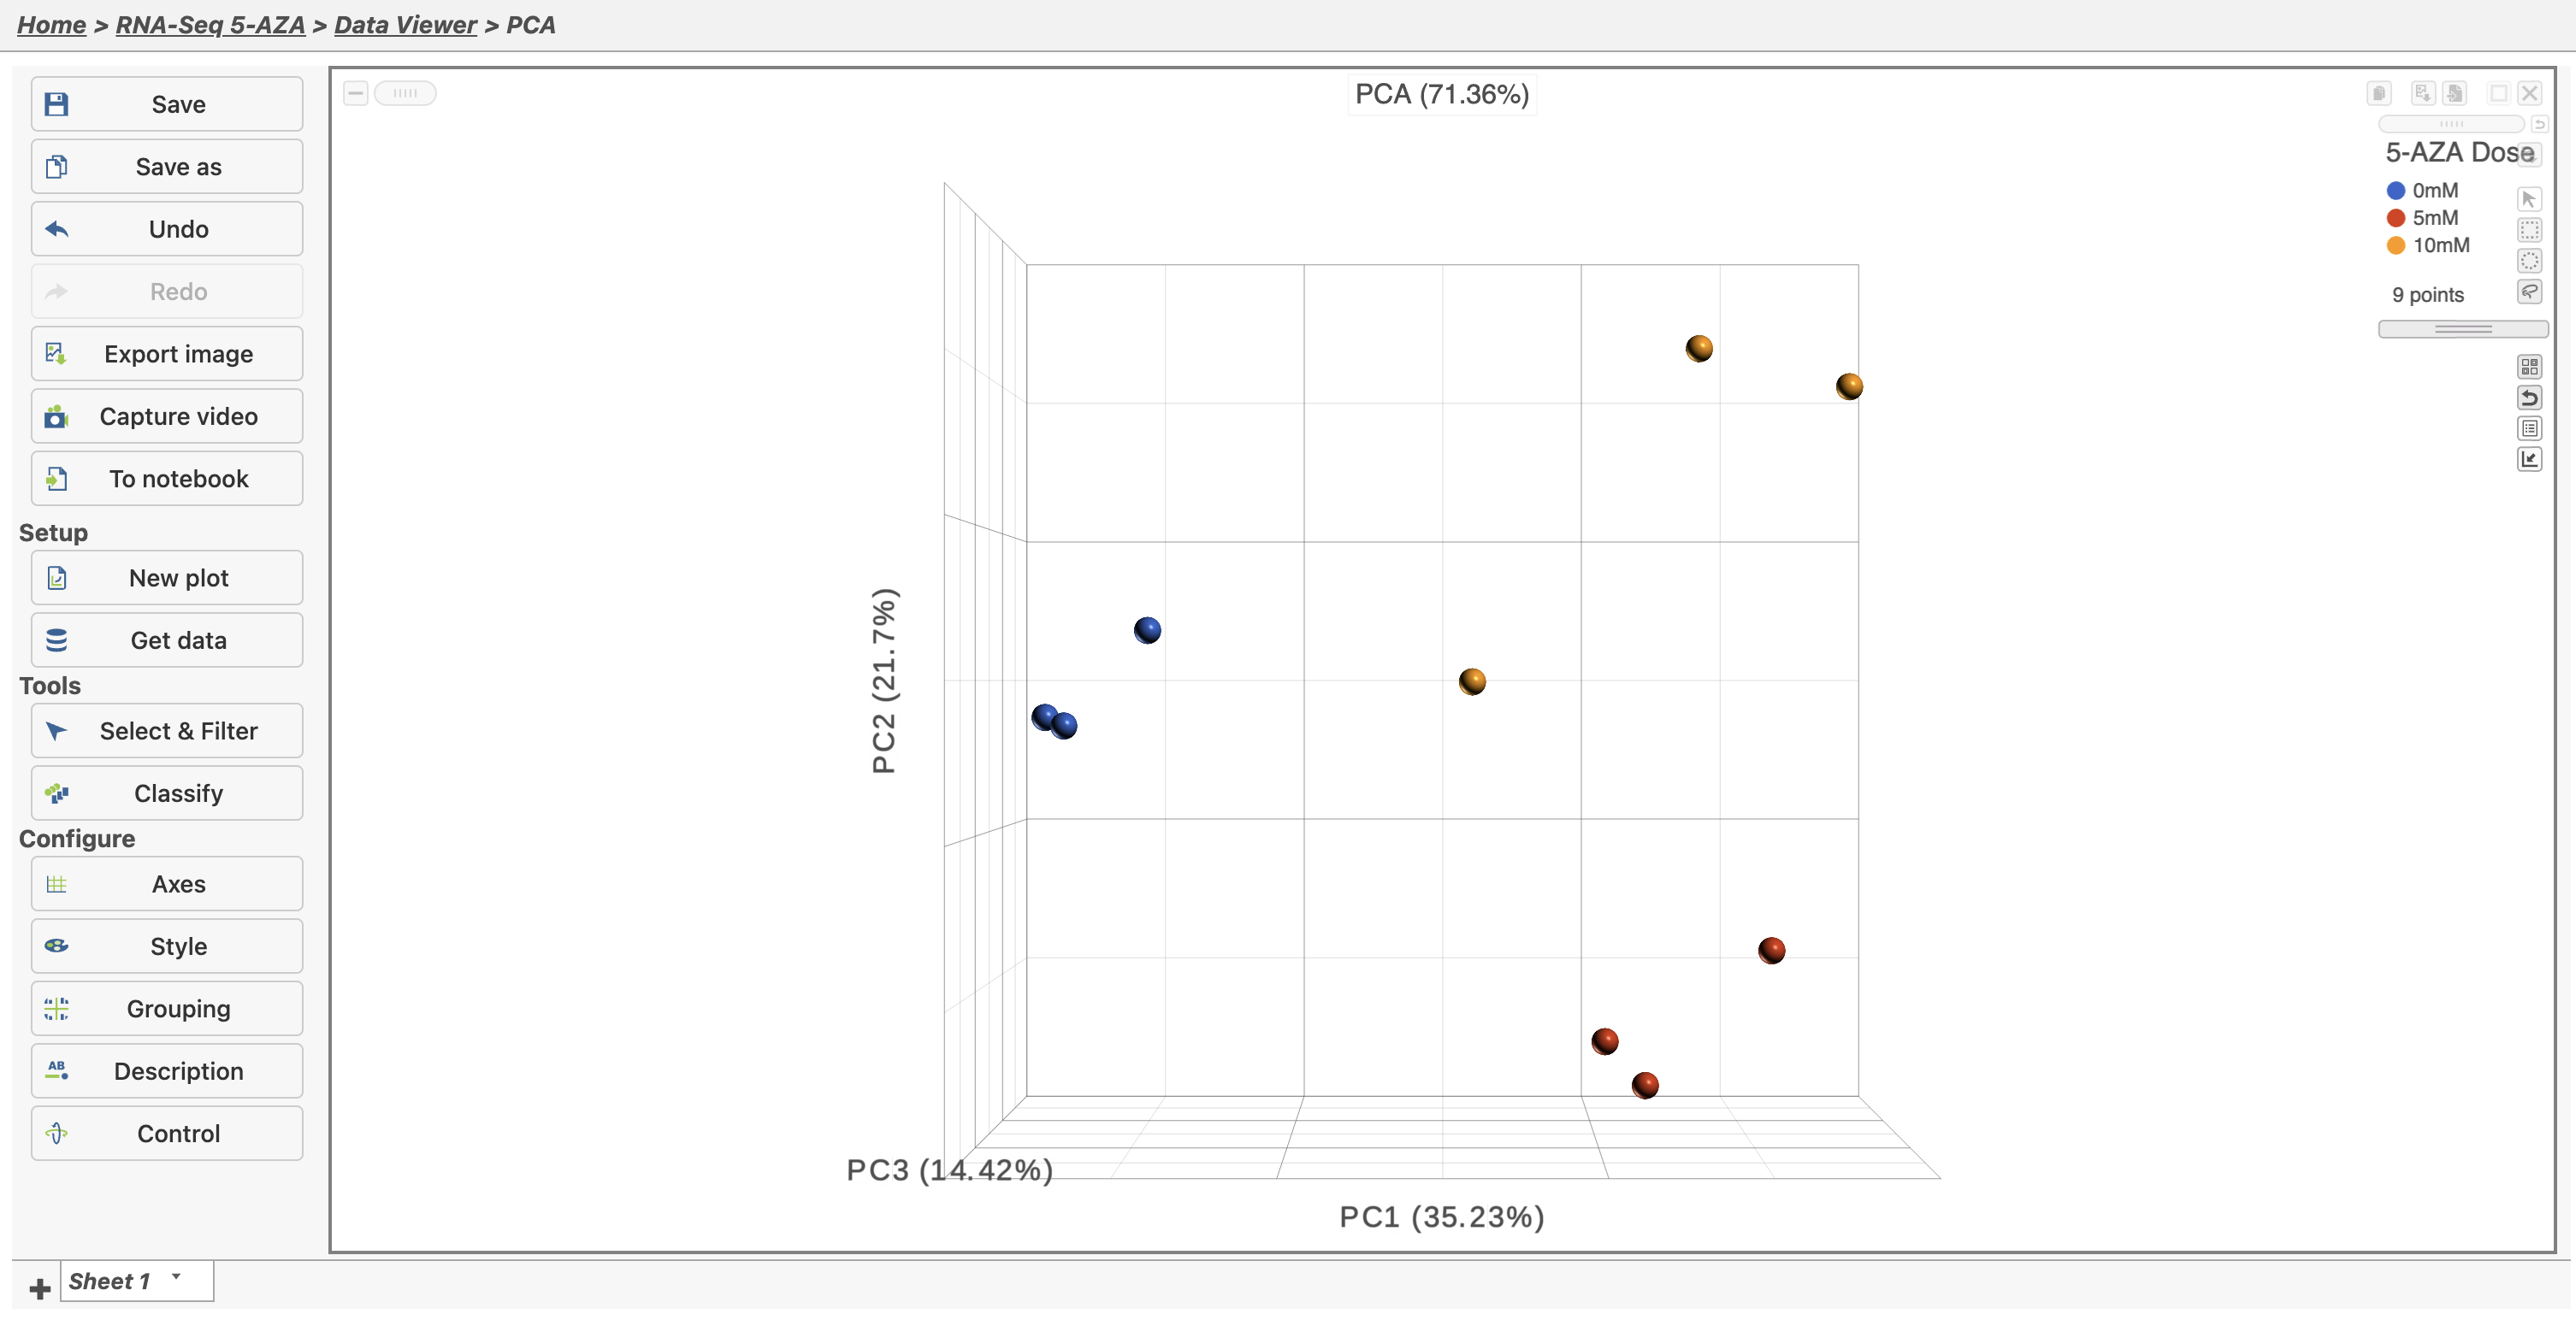
Page: Exploring the data set with PCA
|
|
PNG File image2019-5-24 11:6:1.png |
336 kB |
Paul Fullerton |
May 24, 2019 11:06 |
May 24, 2019 11:06 |
|
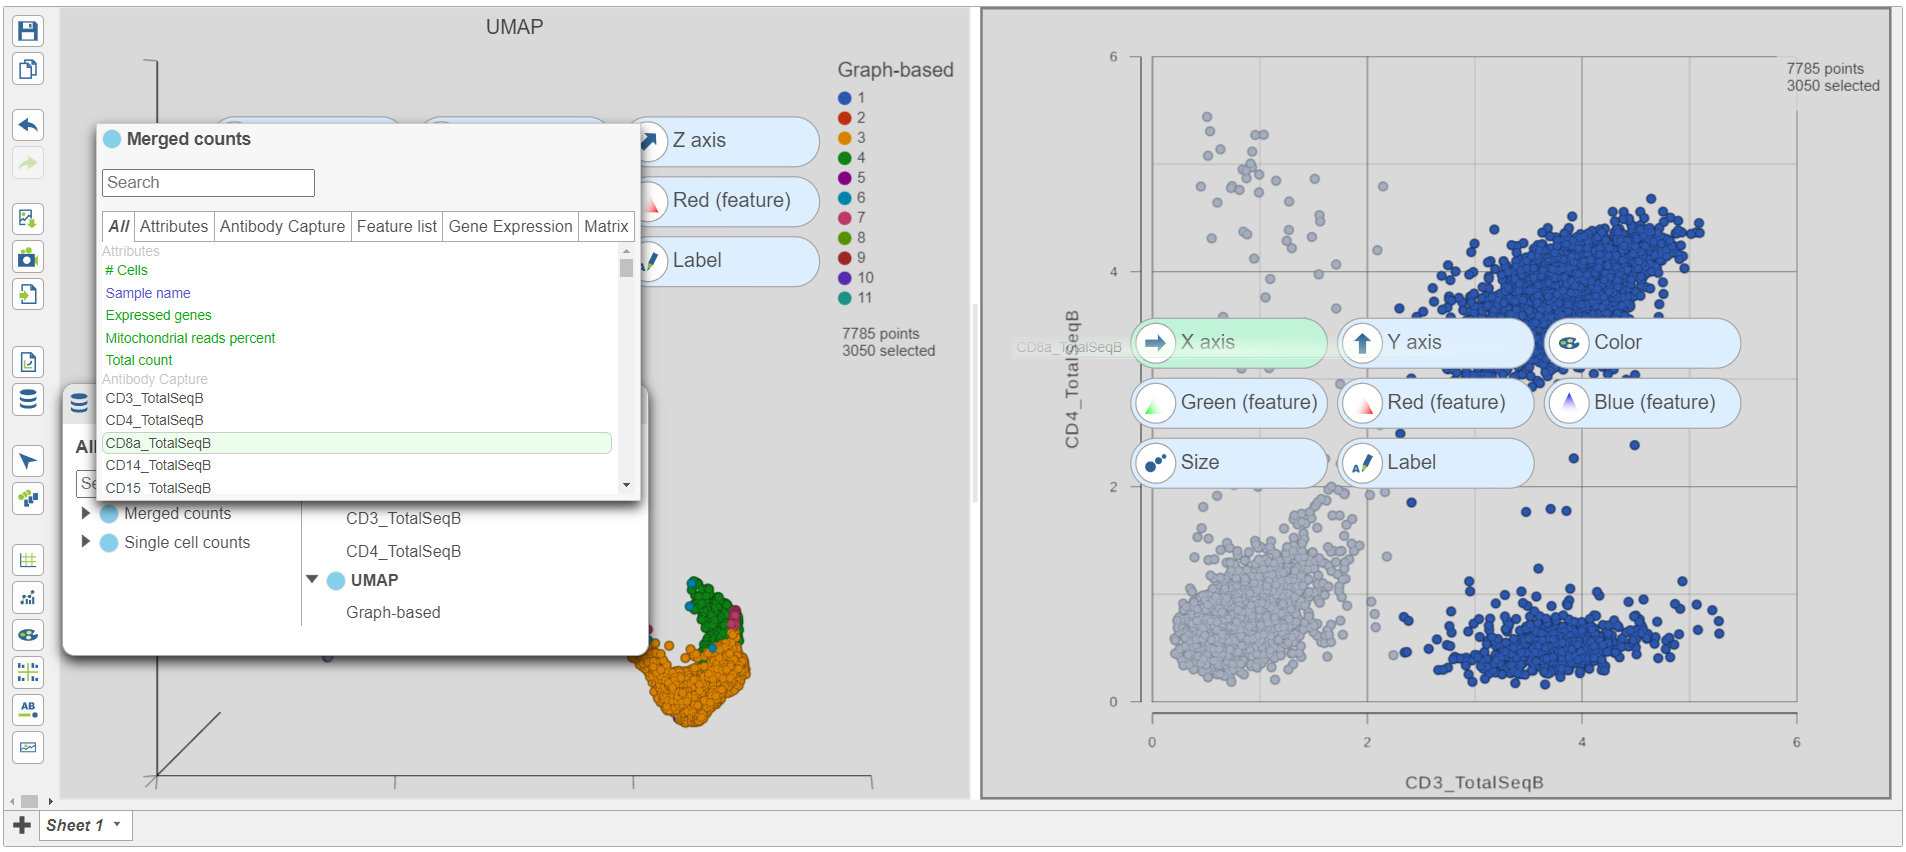
Page: Analyzing CITE-Seq Data
|
|
PNG File Fig 19.png |
336 kB |
Zhengbin Liu |
Aug 30, 2022 16:48 |
Aug 30, 2022 16:48 |
|
Page: Analyzing Single Cell ATAC-Seq data
|
|
PNG File image2022-8-29_18-9-30.png |
336 kB |
Alex Rutkovsky |
Aug 29, 2022 17:09 |
Aug 29, 2022 17:09 |
|
Page: Analyzing Single Cell RNA-Seq Data
|
|
PNG File image2019-5-15 15:48:51.png |
336 kB |
Paul Fullerton |
May 15, 2019 15:48 |
May 15, 2019 15:48 |
|
Page: Analyzing CITE-Seq Data
|
|
PNG File image2019-5-21 16:33:52.png |
334 kB |
Paul Fullerton |
May 21, 2019 16:33 |
May 21, 2019 16:33 |
|
Page: Analyzing CITE-Seq Data
|
|
PNG File Screenshot 2023-09-15 at 15.32.10.png |
333 kB |
Matteo Luberti |
Sep 15, 2023 09:32 |
Sep 15, 2023 09:32 |
|
Page: Analyzing Single Cell RNA-Seq Data
|