| Name
|
Size
|
Creator |
Creation Date
|
Last Modification Date
|
Labels |
Attached To |
|
PNG File norm_to_pair.png |
17 kB |
Xiaowen Wang |
Dec 05, 2023 11:56 |
Dec 05, 2023 11:56 |
|
Page: Impute low expression
|
|
PNG File norm_to_pair.png |
17 kB |
Xiaowen Wang |
Dec 24, 2018 15:36 |
Dec 24, 2018 15:36 |
|
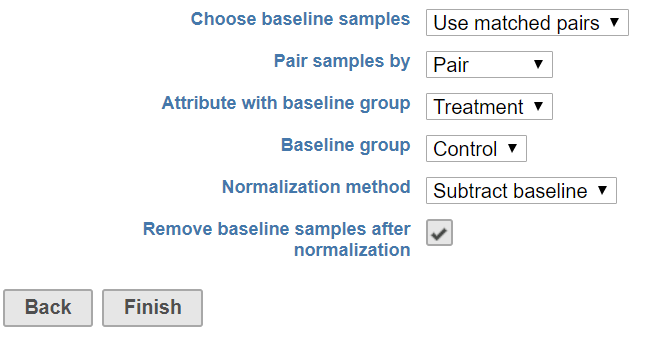
Page: Normalize to baseline
|
|
PNG File image2024-1-24_14-58-21.png |
17 kB |
Alex Rutkovsky |
Jan 24, 2024 13:58 |
Jan 24, 2024 13:58 |
|
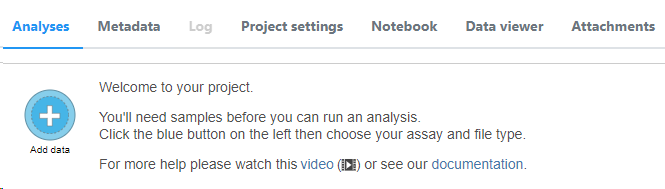
Page: Creating a New Project
|
|
PNG File chromosome_isoform_proportion_track2.png |
17 kB |
admin |
Jul 07, 2016 14:05 |
Jul 18, 2016 16:48 |
|
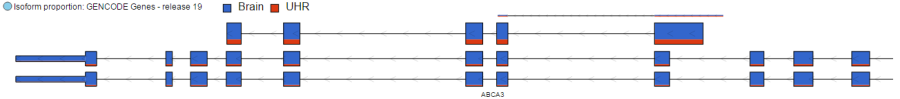
Page: Visualizing the Results Using Data Tracks
|
|
PNG File image2019-5-15 14:25:55.png |
17 kB |
Paul Fullerton |
May 15, 2019 14:25 |
May 15, 2019 14:25 |
|
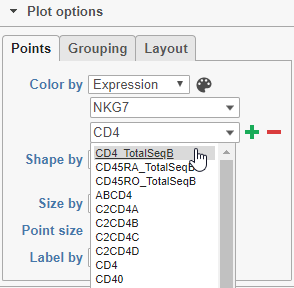
Page: Analyzing CITE-Seq Data
|
|
PNG File image2022-8-30_12-40-37.png |
17 kB |
Alex Rutkovsky |
Aug 30, 2022 11:40 |
Aug 30, 2022 11:40 |
|
Page: Classify cells from multiple samples using t-SNE
|
|
PNG File image2022-8-30_12-40-37.png |
17 kB |
Alex Rutkovsky |
Jul 12, 2023 07:38 |
Jul 12, 2023 07:38 |
|
Page: Process Xenium data
|
|
PNG File image2022-8-30_12-40-37.png |
17 kB |
Alex Rutkovsky |
Jul 07, 2023 11:29 |
Jul 07, 2023 11:29 |
|
Page: Start with 10x Genomics Visium fastq files
|
|
PNG File image2022-6-3_14-17-53.png |
17 kB |
Alex Rutkovsky |
Jun 03, 2022 13:17 |
Jun 03, 2022 13:17 |
|
Page: Data Viewer
|
|
PNG File 2021-09-24 13_03_30-Data viewer - Partek Flow.png |
17 kB |
Ivan Lukic |
Sep 24, 2021 07:02 |
Sep 24, 2021 07:02 |
|
Page: Hierarchical Clustering
|
|
PNG File image2022-8-30_12-6-10.png |
17 kB |
Alex Rutkovsky |
Aug 30, 2022 11:06 |
Aug 30, 2022 11:06 |
|
Page: Classify cells from multiple samples using t-SNE
|
|
PNG File image2022-8-30_12-6-10.png |
17 kB |
Alex Rutkovsky |
Jul 12, 2023 07:38 |
Jul 12, 2023 07:38 |
|
Page: Process Xenium data
|
|
PNG File image2022-8-30_12-6-10.png |
17 kB |
Alex Rutkovsky |
Jul 07, 2023 11:29 |
Jul 07, 2023 11:29 |
|
Page: Start with 10x Genomics Visium fastq files
|
|
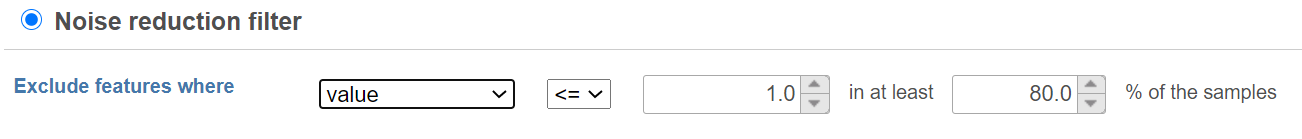
PNG File image2020-12-22_15-59-24.png |
17 kB |
Xiaowen Wang |
Dec 22, 2020 15:59 |
Dec 22, 2020 15:59 |
|
Page: Filter features
|
|
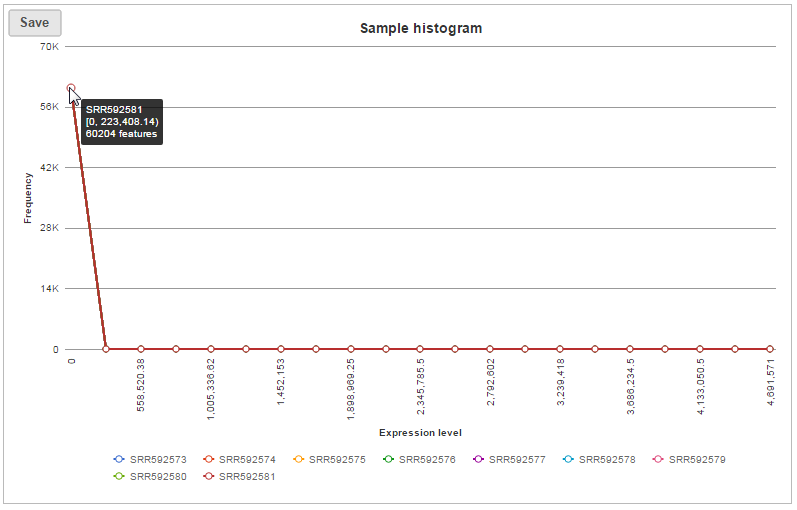
PNG File quantification_histogram.png |
17 kB |
Xiaowen Wang |
Dec 24, 2018 11:42 |
Dec 24, 2018 11:44 |
|
Page: Quantify regions
|
|
PNG File quantification_histogram.png |
17 kB |
admin |
Jun 09, 2016 08:46 |
Jun 22, 2016 16:57 |
|
Page: Quantify to annotation model (Partek E/M)
|
|
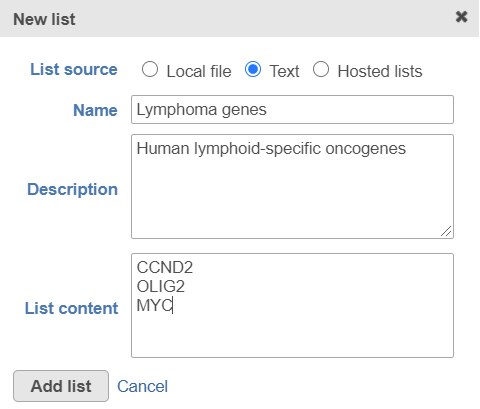
PNG File image2021-2-2_11-51-7.png |
17 kB |
Xiaowen Wang |
Feb 02, 2021 11:51 |
Feb 02, 2021 11:51 |
|
Page: Lists
|
|
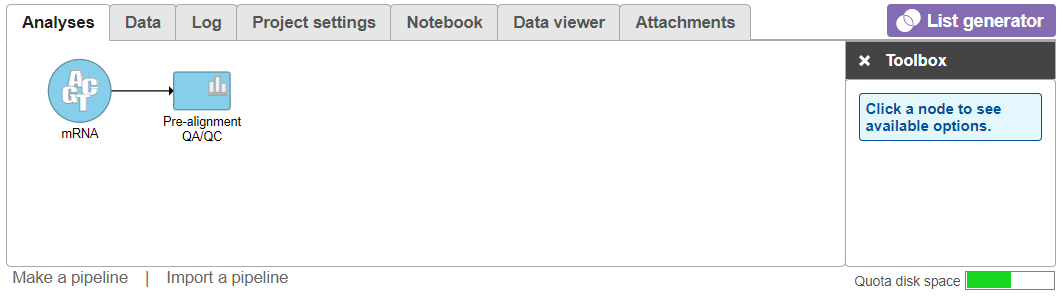
PNG File 2021-02-12 10_44_40-RNA-Seq 5-AZA_2 - Partek Flow.… |
17 kB |
Ivan Lukic |
Feb 12, 2021 03:45 |
Feb 12, 2021 03:45 |
|
Page: Running pre-alignment QA/QC
|
|
PNG File image2018-3-21 14:11:55.png |
17 kB |
Paul Fullerton |
Mar 21, 2018 14:11 |
Mar 21, 2018 14:11 |
|
Page: Compare expression between cell types with multiple samples
|
|
PNG File image2018-3-21 14:11:55.png |
17 kB |
Alex Rutkovsky |
Jul 12, 2023 07:38 |
Jul 12, 2023 07:38 |
|
Page: Make comparisons using Compute biomarkers and Biological interpretation
|