| Name
|
Size
|
Creator |
Creation Date
|
Last Modification Date
|
Labels |
Attached To |
|
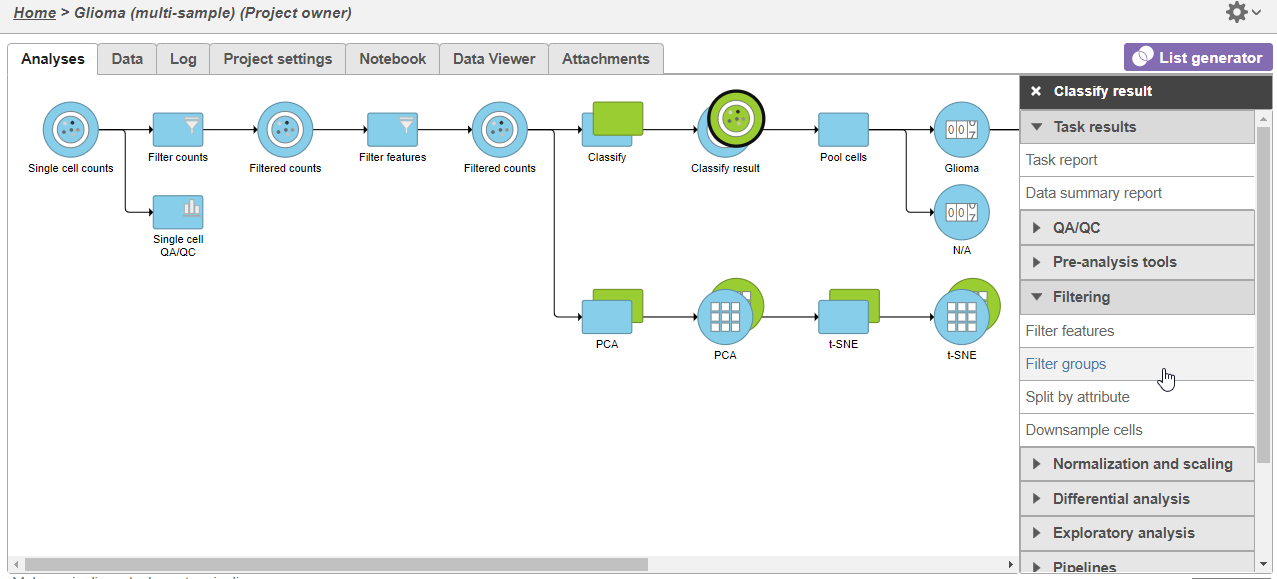
PNG File FIlter_goups_task.png |
55 kB |
Alex Rutkovsky |
Jul 12, 2023 07:38 |
Jul 12, 2023 07:38 |
|
Page: Make comparisons using Compute biomarkers and Biological interpretation
|
|
PNG File FIlter_goups_task.png |
55 kB |
Alex Rutkovsky |
Jul 07, 2023 11:29 |
Jul 07, 2023 11:29 |
|
Page: Spatial data analysis steps
|
|
PNG File image2018-12-11 12:31:36.png |
55 kB |
Paul Fullerton |
Dec 11, 2018 12:31 |
Dec 11, 2018 12:31 |
|
Page: Single-cell QA/QC
|
|
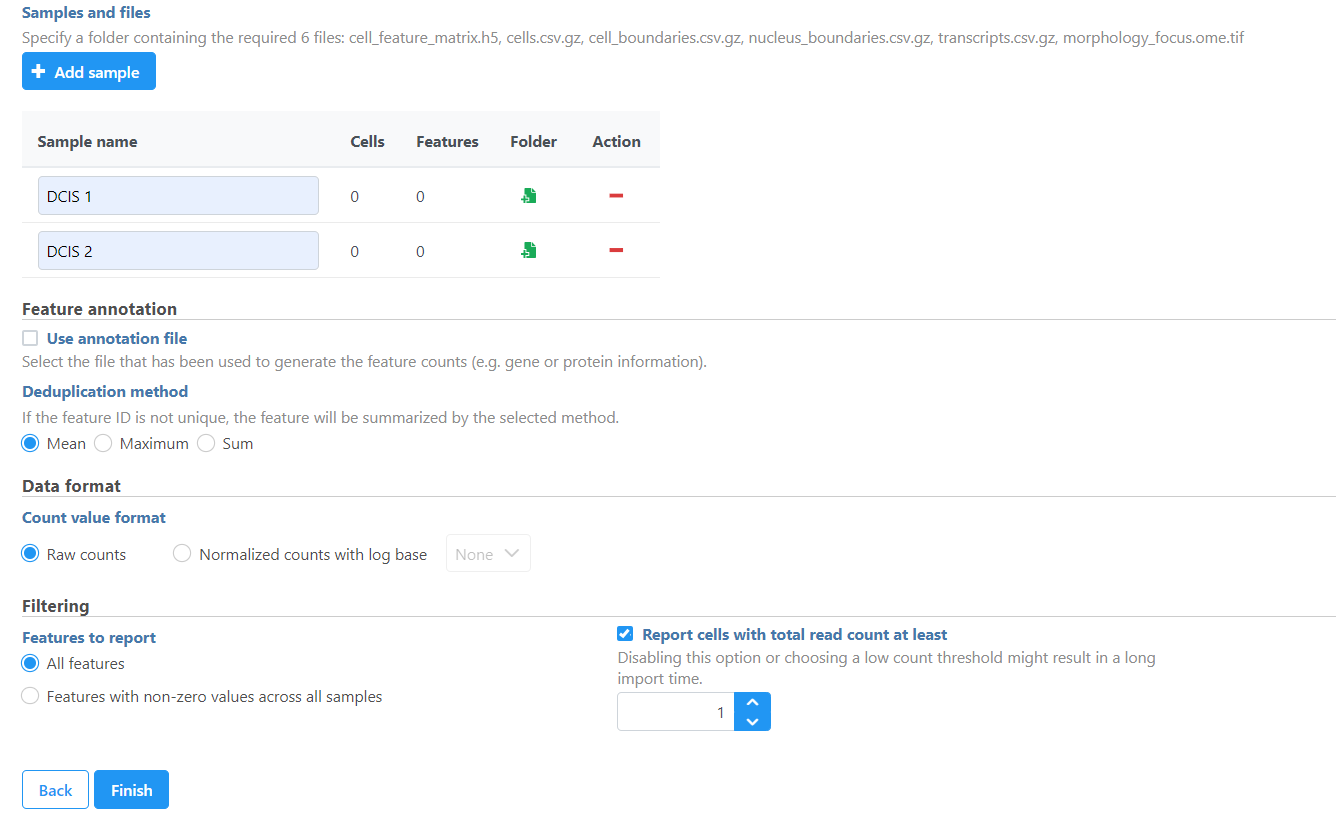
PNG File image2024-2-14_23-37-43.png |
55 kB |
Jinfang Chai |
Feb 14, 2024 09:37 |
Feb 14, 2024 09:37 |
|
Page: Import 10x Genomics Xenium Analyzer output
|
|
PNG File image2018-4-4 11:24:17.png |
55 kB |
Paul Fullerton |
Apr 04, 2018 11:24 |
Apr 04, 2018 11:24 |
|
Page: Viewing DESeq2 results and creating a gene list
|
|
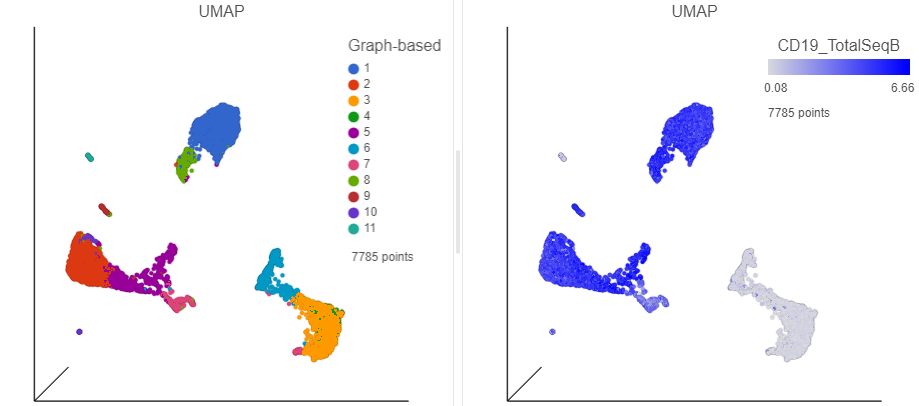
PNG File Color_by_CD19.png |
55 kB |
Simit Patel |
Jul 01, 2020 09:29 |
Jul 01, 2020 09:29 |
|
Page: Classifying Cells
|
|
PNG File image2022-8-29_15-17-58.png |
55 kB |
Alex Rutkovsky |
Aug 29, 2022 14:17 |
Aug 29, 2022 14:17 |
|
Page: Analyzing Single Cell RNA-Seq Data
|
|
PNG File image2022-8-29_15-18-15.png |
55 kB |
Alex Rutkovsky |
Aug 29, 2022 14:18 |
Aug 29, 2022 14:18 |
|
Page: Analyzing Single Cell RNA-Seq Data
|
|
PNG File image2018-2-16 14:30:46.png |
55 kB |
Paul Fullerton |
Feb 16, 2018 14:30 |
Feb 16, 2018 14:30 |
|
Page: Compare expression between cell types with multiple samples
|
|
PNG File image2018-2-16 14:30:46.png |
55 kB |
Alex Rutkovsky |
Jul 12, 2023 07:38 |
Jul 12, 2023 07:38 |
|
Page: Make comparisons using Compute biomarkers and Biological interpretation
|
|
PNG File image2018-2-16 14:30:46.png |
55 kB |
Alex Rutkovsky |
Jul 07, 2023 11:29 |
Jul 07, 2023 11:29 |
|
Page: Spatial data analysis steps
|
|
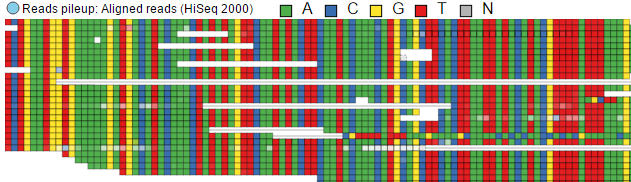
PNG File chromosome_pileup_colored_base.png |
55 kB |
admin |
Jul 07, 2016 14:17 |
Jul 18, 2016 16:52 |
|
Page: Customizing the View
|
|
PNG File image2023-7-21_16-57-47.png |
55 kB |
Alex Rutkovsky |
Jul 21, 2023 15:57 |
Jul 21, 2023 15:57 |
|
Page: Process Xenium data
|
|
PNG File image2023-7-20_12-51-39.png |
55 kB |
Alex Rutkovsky |
Jul 20, 2023 11:51 |
Jul 20, 2023 11:51 |
|
Page: Import 10x Genomics Xenium Analyzer output
|
|
PNG File image2018-2-15 17:15:53.png |
55 kB |
Alex Rutkovsky |
Jul 12, 2023 07:38 |
Jul 12, 2023 07:38 |
|
Page: Perform Exploratory analysis
|
|
PNG File image2018-2-15 17:15:53.png |
55 kB |
Alex Rutkovsky |
Jul 07, 2023 11:29 |
Jul 07, 2023 11:29 |
|
Page: View tissue images
|
|
PNG File image2018-1-15 14:47:10.png |
55 kB |
Paul Fullerton |
Jan 15, 2018 14:47 |
Jan 15, 2018 14:47 |
|
Page: Pool cells
|
|
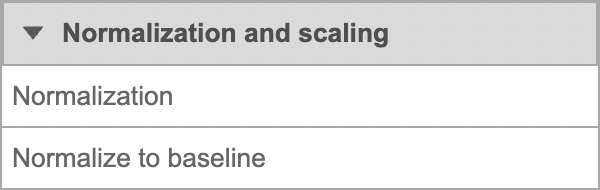
PNG File Screenshot 2022-12-20 at 17.02.08.png |
55 kB |
Matteo Luberti |
Dec 20, 2022 11:02 |
Dec 20, 2022 11:02 |
|
Page: Normalization
|
|
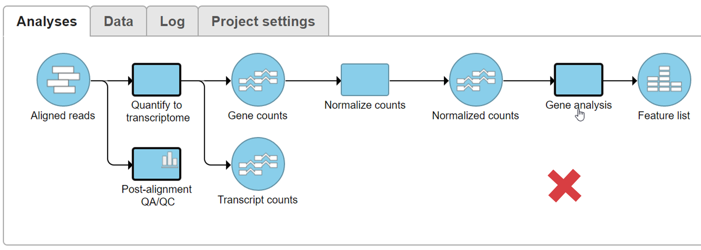
PNG File make_a_pipeline_subset2.png |
55 kB |
admin |
Jun 10, 2016 09:53 |
Jul 18, 2016 10:39 |
|
Page: Making a Pipeline
|
|
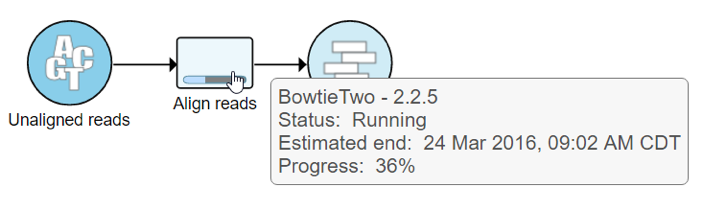
PNG File hover_over_task_version.png |
55 kB |
admin |
Jun 09, 2016 11:23 |
Jul 18, 2016 06:49 |
|
Page: Task Management
|