Pool cells combines RNA-Seq data from all cells of a particular cell type classification for each sample. In essence, Pool cells creates virtual bulk RNA-Seq data from single cell RNA-Seq data. Because it is virtual bulk RNA-Seq data, all the same tasks that can be performed on bulk RNA-Seq gene counts data in Partek Flow can be performed on the output of Pool cells.
Pool cells makes it easy to compare gene expression for a cell type of interest between experimental groups.
Running Pool cells
Before running Pool cells, you must classify the cells. To run Pool cells, select the data node with your classified cells and select Pool cells from the QA/QC section of the task menu (Figure 1).
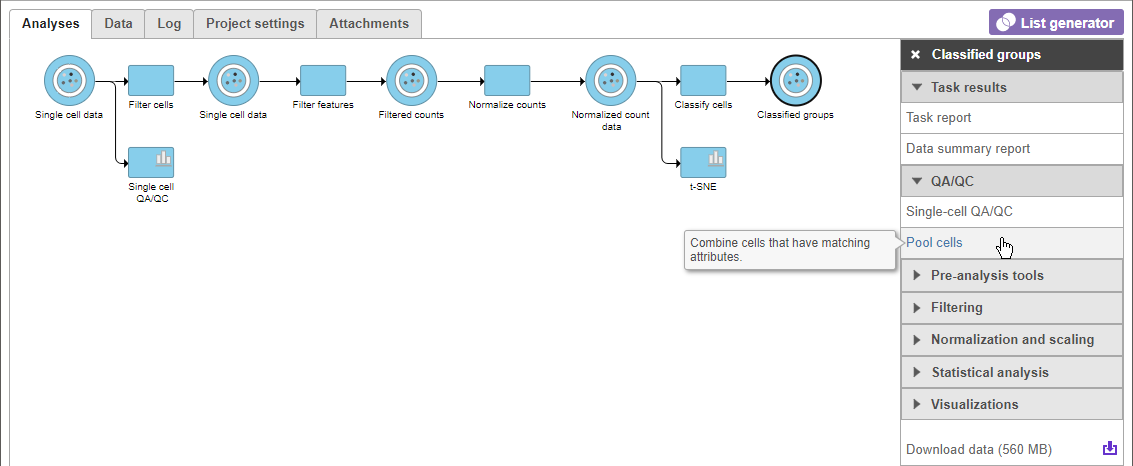
Figure 1. Invoking Pool cells
Options for Pool cells are Sum, Maximum, Mean, and Median. Expression values for cells from the same sample with the same cell type classification will be merged using the chosen pooling method (Figure 2). Sum is selected by default. After choosing a pooling method, select Finish to run the Pool cells task.

Figure 2. Choosing the pooling method
Ouput of Pool cells
Pool cells generates a counts data node for each classified cell type in the data set (Figure 3).
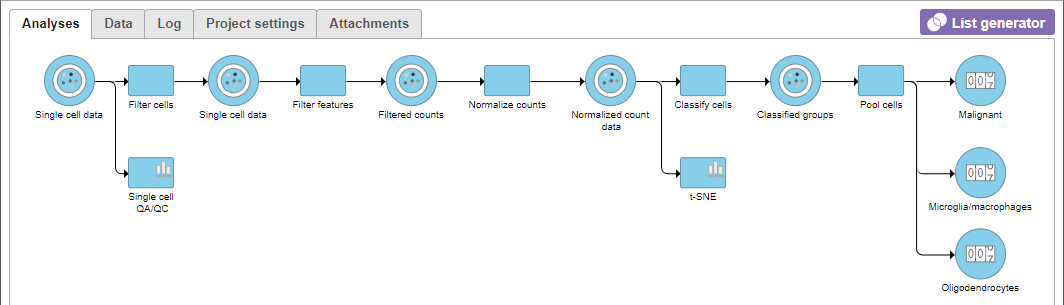
Figure 3. Output of Pool cells. This data set had 3 cell types, Malignant, Microglia/macrophages, and Oligodendrocytes. Pool cells has creates a counts data node for each cell type.
Each counts data node is equivalent to simulated bulk RNA-Seq counts data for a cell type. The same tasks that can be performed on bulk RNA-Seq counts data can be performed on Pool cells output data nodes, including normalization, filtering, PCA, and differential expression analysis.
The counts data of a cell type for each sample can be downloaded by clicking the counts data node and selecting Download data from the task menu. The counts data text file lists each sample and its pooled counts values (sum, maximum, mean, or median) for each feature (gene/transcript) in alphabetical order (Figure 4).
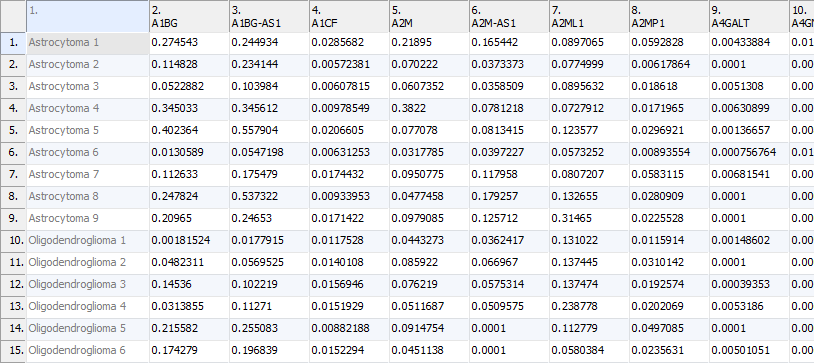
Figure 4. Pool cells counts data can be downloaded as a tab-delimited text file. The downloaded text file can be opened in any spreadsheet viewing program or text editor.
Additional Assistance
If you need additional assistance, please visit our support page to submit a help ticket or find phone numbers for regional support.


| Your Rating: |
|
Results: |

|
36 | rates |
Overview
Content Tools