| Name
|
Size
|
Creator |
Creation Date
|
Last Modification Date
|
Labels |
Attached To |
|
PNG File image2018-1-29 17:13:51.png |
114 kB |
Paul Fullerton |
Jan 29, 2018 17:13 |
Jan 29, 2018 17:13 |
|
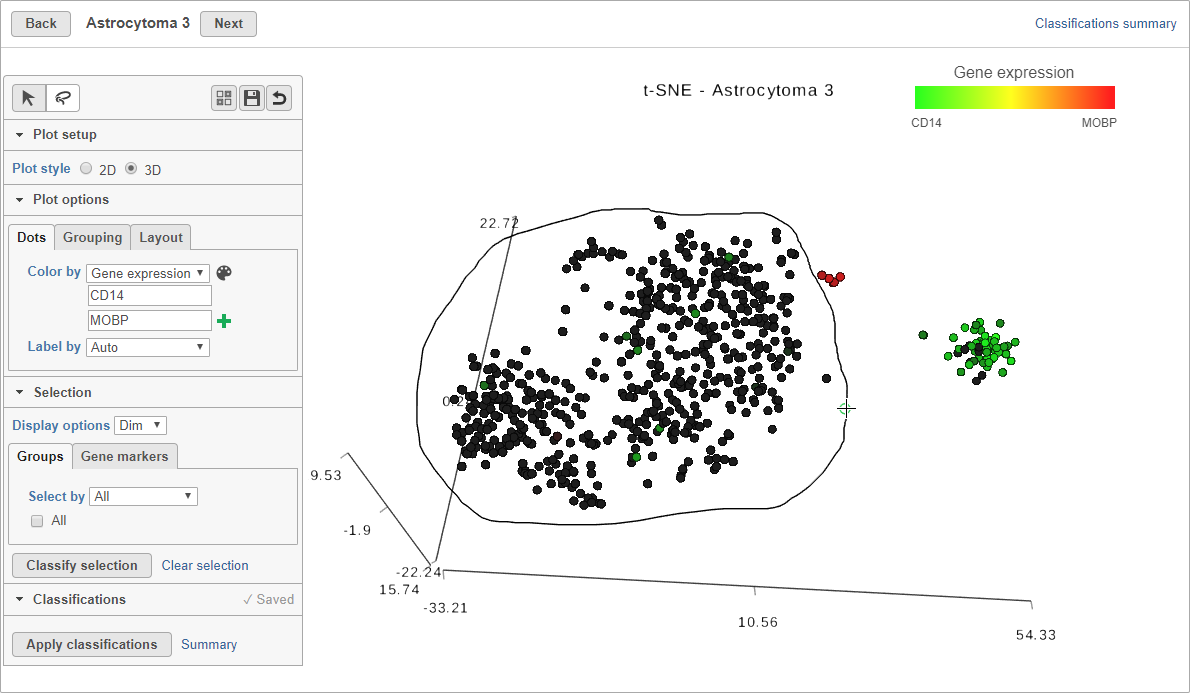
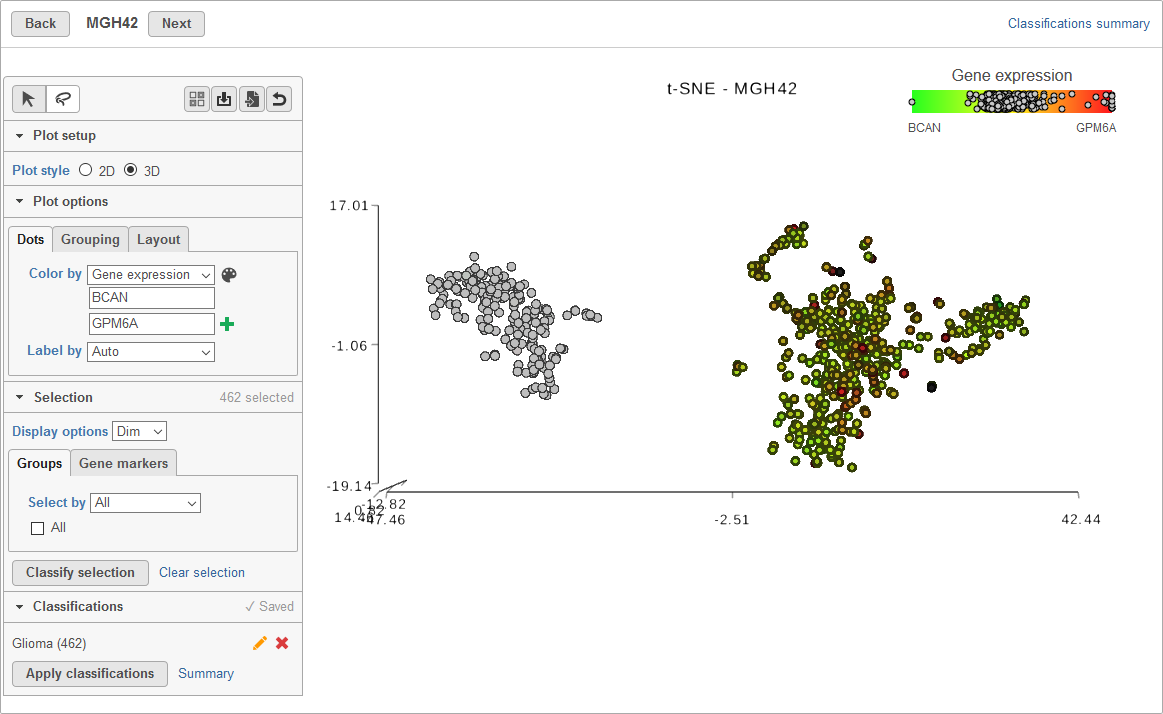
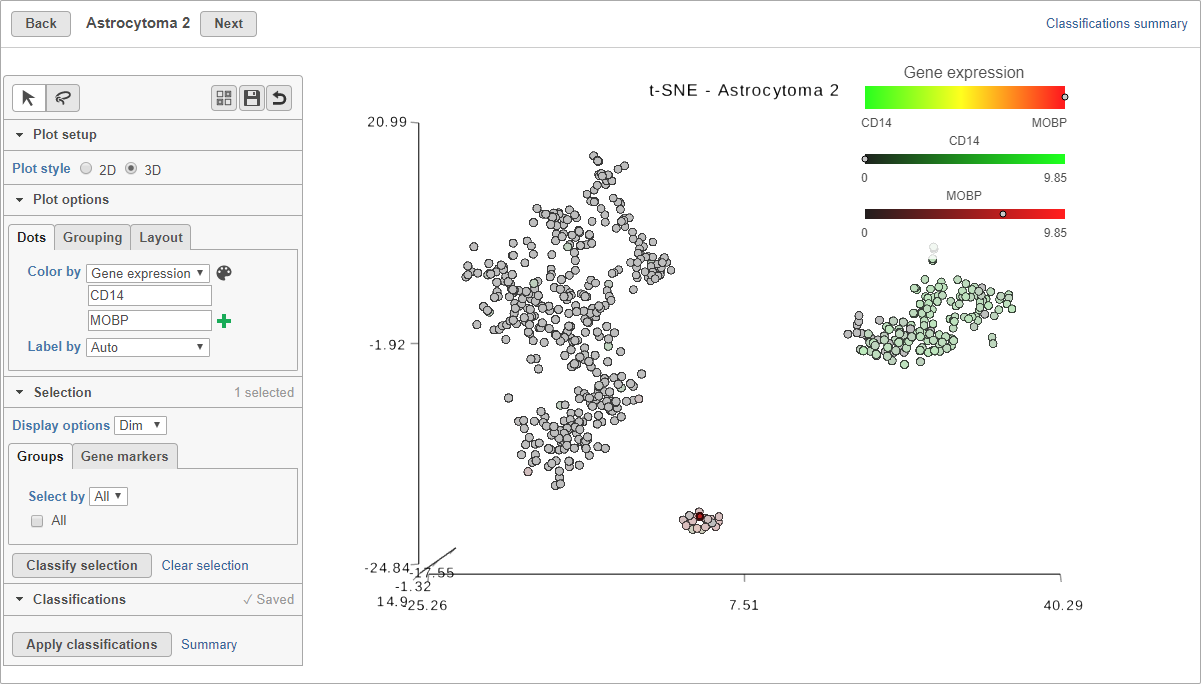
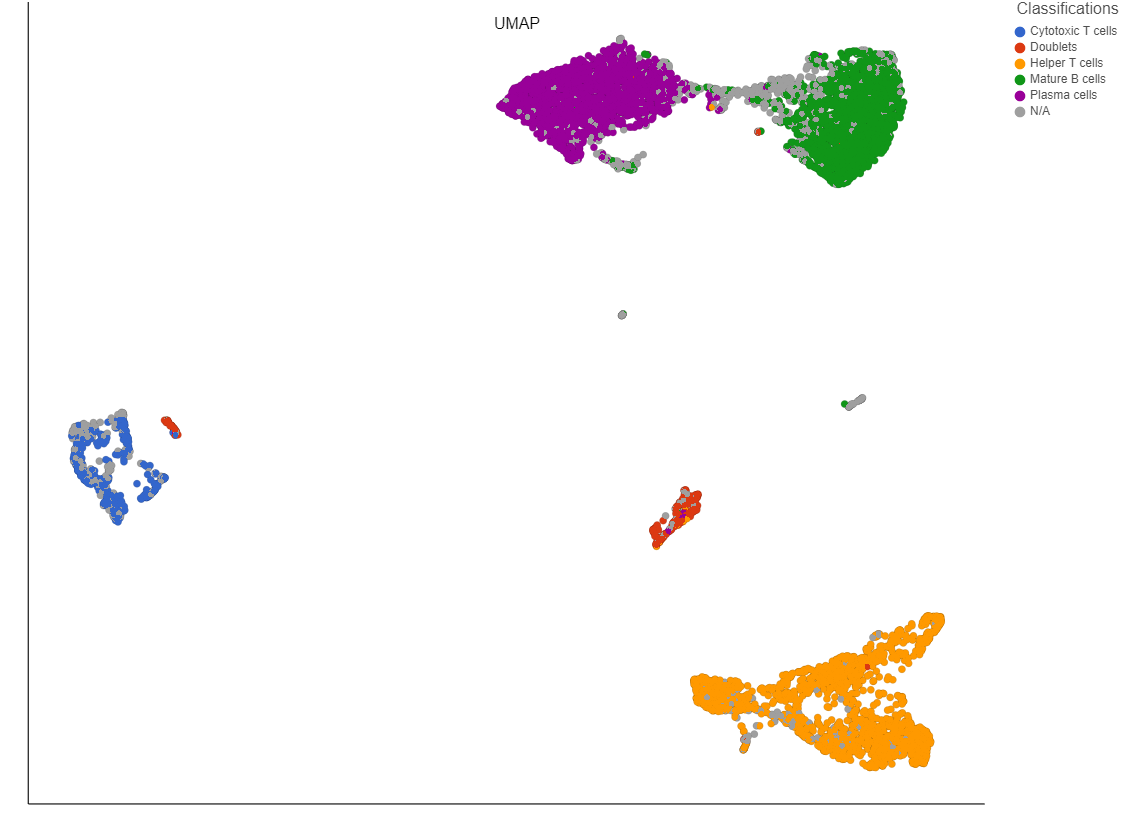
Page: Classify cells from multiple samples using t-SNE
|
|
PNG File image2018-1-29 17:13:51.png |
114 kB |
Alex Rutkovsky |
Jul 12, 2023 07:38 |
Jul 12, 2023 07:38 |
|
Page: Process Xenium data
|
|
PNG File image2018-1-29 17:13:51.png |
114 kB |
Alex Rutkovsky |
Jul 07, 2023 11:29 |
Jul 07, 2023 11:29 |
|
Page: Start with 10x Genomics Visium fastq files
|
|
PNG File image2017-10-17 12:44:29.png |
114 kB |
admin |
Jun 14, 2022 13:27 |
Jun 14, 2022 13:27 |
|
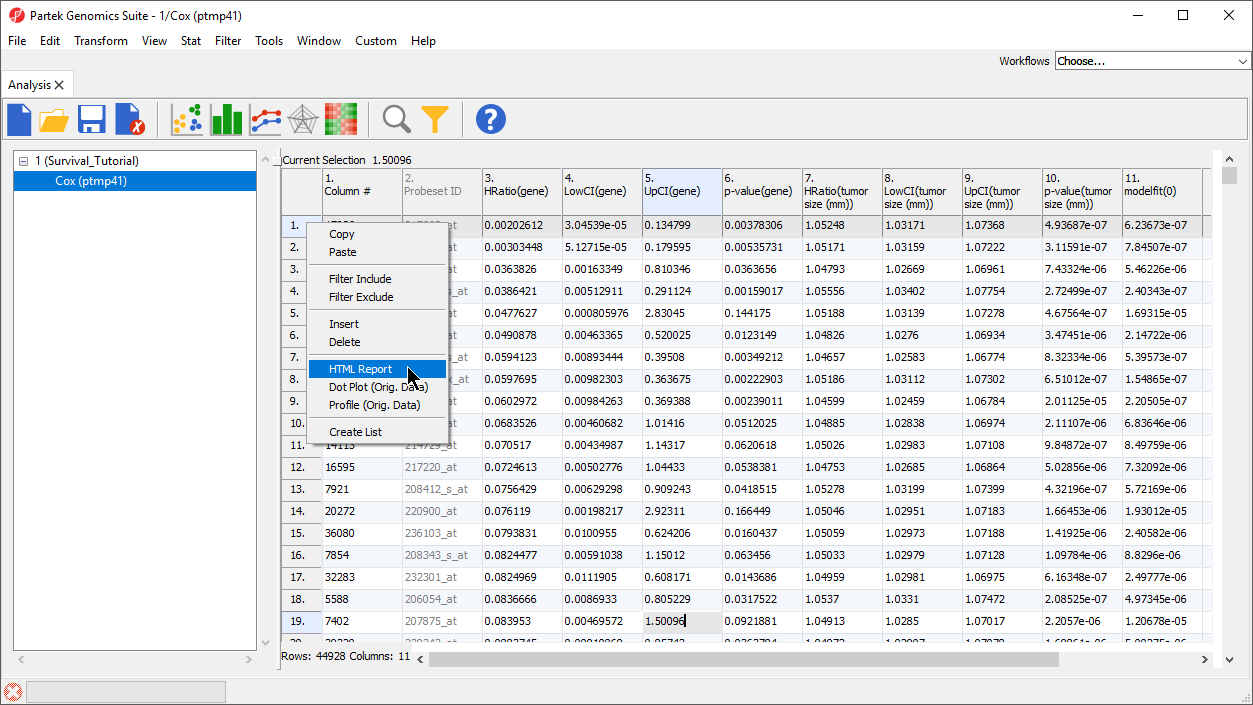
Page: Survival Analysis with Cox regression and Kaplan-Meier analysis - Partek Flow
|
|
PNG File image2018-2-15 12:14:36.png |
114 kB |
Paul Fullerton |
Feb 15, 2018 12:14 |
Feb 15, 2018 12:14 |
|
Page: Classify cells from multiple samples using t-SNE
|
|
PNG File image2018-2-15 12:14:36.png |
114 kB |
Alex Rutkovsky |
Jul 12, 2023 07:38 |
Jul 12, 2023 07:38 |
|
Page: Process Xenium data
|
|
PNG File image2018-2-15 12:14:36.png |
114 kB |
Alex Rutkovsky |
Jul 07, 2023 11:29 |
Jul 07, 2023 11:29 |
|
Page: Start with 10x Genomics Visium fastq files
|
|
PNG File image2018-1-29 16:54:7.png |
113 kB |
Paul Fullerton |
Jan 29, 2018 16:54 |
Jan 29, 2018 16:54 |
|
Page: Classify cells from multiple samples using t-SNE
|
|
PNG File image2018-1-29 16:54:7.png |
113 kB |
Alex Rutkovsky |
Jul 12, 2023 07:38 |
Jul 12, 2023 07:38 |
|
Page: Process Xenium data
|
|
PNG File image2018-1-29 16:54:7.png |
113 kB |
Alex Rutkovsky |
Jul 07, 2023 11:29 |
Jul 07, 2023 11:29 |
|
Page: Start with 10x Genomics Visium fastq files
|
|
PNG File image2019-5-21 16:17:38.png |
113 kB |
Paul Fullerton |
May 21, 2019 16:17 |
May 21, 2019 16:17 |
|
Page: Analyzing CITE-Seq Data
|
|
PNG File Screenshot 2023-09-21 at 18.00.32.png |
113 kB |
Matteo Luberti |
Sep 21, 2023 12:00 |
Sep 21, 2023 12:00 |
|
Page: Differentially Expressed Proteins and Genes
|
|
PNG File Trajectory result - 3D Scatter plot (1).png |
113 kB |
Ivan Lukic |
Feb 26, 2021 04:53 |
Feb 26, 2021 04:53 |
|
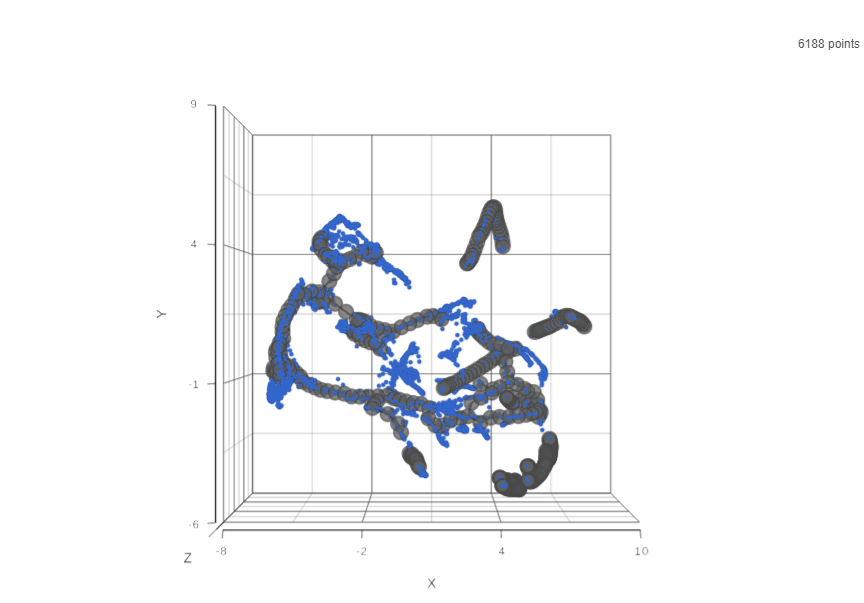
Page: Trajectory Analysis (Monocle 3)
|
|
PNG File Screenshot 2023-08-21 at 14.38.29.png |
113 kB |
Matteo Luberti |
Aug 21, 2023 08:42 |
Aug 21, 2023 08:42 |
|
Page: Getting started with the tutorial data set
|
|
PNG File Screenshot 2023-09-25 at 10.33.06.png |
112 kB |
Matteo Luberti |
Sep 25, 2023 04:34 |
Sep 25, 2023 04:34 |
|
Page: Performing differential expression analysis with DESeq2
|
|
PNG File add_more_files_existing.png |
112 kB |
admin |
Jun 10, 2016 11:33 |
Jul 18, 2016 16:33 |
|
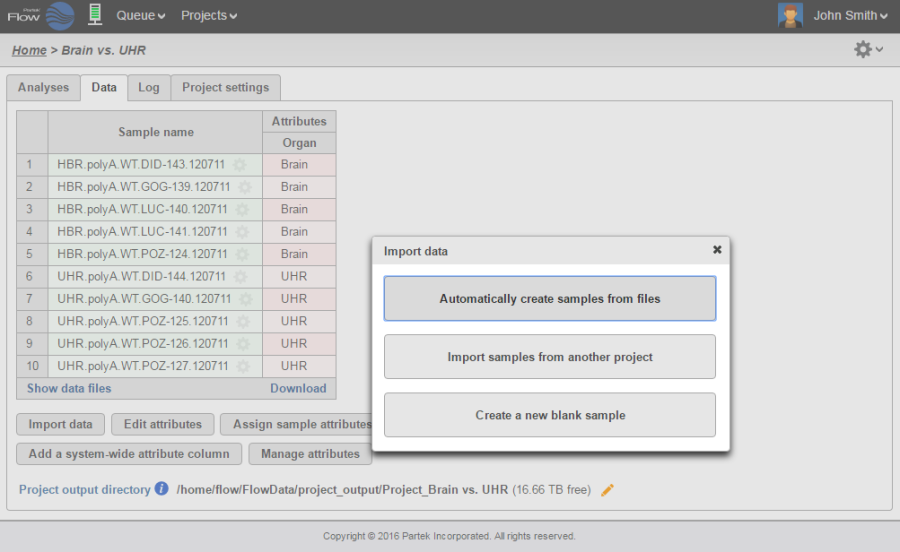
Page: The Metadata Tab
|
|
PNG File image2022-8-2_9-38-26.png |
112 kB |
Alex Rutkovsky |
Aug 02, 2022 08:38 |
Aug 02, 2022 08:38 |
|
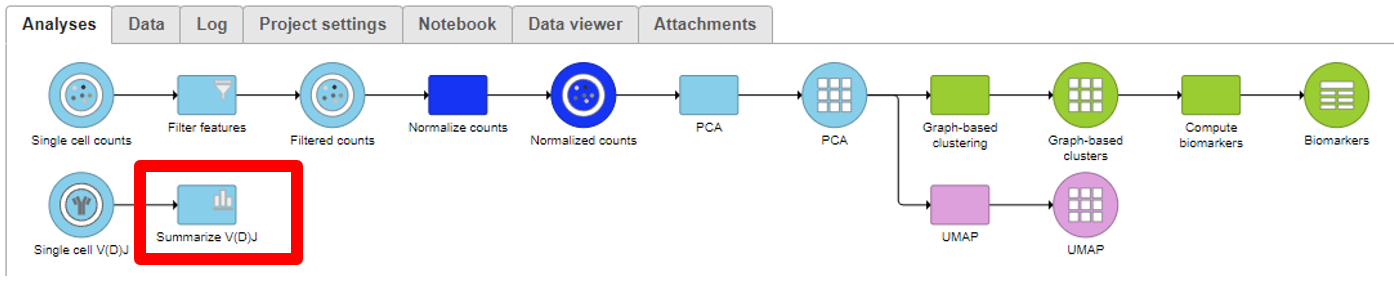
Page: V(D)J Analysis
|
|
PNG File image2018-11-8 14:24:20.png |
112 kB |
Zhengbin Liu |
Aug 30, 2022 13:44 |
Aug 30, 2022 13:44 |
|
Page: Analyzing Single Cell ATAC-Seq data
|
|
PNG File image2018-11-8 14:24:20.png |
112 kB |
Paul Fullerton |
Nov 08, 2018 14:24 |
Nov 08, 2018 14:24 |
|
Page: Analyzing Single Cell RNA-Seq Data
|
|
PNG File image2018-1-29 17:10:55.png |
112 kB |
Paul Fullerton |
Jan 29, 2018 17:10 |
Jan 29, 2018 17:10 |
|
Page: Classify cells from multiple samples using t-SNE
|