| Name
|
Size
|
Creator |
Creation Date
|
Last Modification Date
|
Labels |
Attached To |
|
PDF File Import GEO Experiment.pdf |
965 kB |
admin |
Sep 08, 2017 12:58 |
Sep 08, 2017 12:58 |
|
Page: NCBI GEO Importer
|
|
PNG File WebinarAd_5.29.png |
906 kB |
admin |
May 02, 2018 15:35 |
May 02, 2018 15:35 |
|
Home page: Partek Genomics Suite Documentation
|
|
PNG File figure14.png |
857 kB |
Paul Fullerton |
Jun 23, 2017 09:41 |
Jun 23, 2017 09:41 |
|
Page: Exploring gene expression data
|
|
PNG File figure18.png |
844 kB |
Paul Fullerton |
Jun 23, 2017 09:42 |
Jun 23, 2017 09:42 |
|
Page: Identifying differentially expressed genes using ANOVA
|
|
PNG File figure33.png |
830 kB |
Paul Fullerton |
Jun 23, 2017 09:45 |
Jun 23, 2017 09:45 |
|
Page: Performing hierarchical clustering
|
|
PNG File figure33.png |
830 kB |
Paul Fullerton |
Jul 21, 2017 09:22 |
Jul 21, 2017 09:23 |
|
Page: Adding gene annotations
|
|
PDF File Visualizations of Next Generation Sequencing Data.… |
823 kB |
admin |
Sep 08, 2017 13:02 |
Sep 08, 2017 13:02 |
|
Page: Visualizing NGS Data
|
|
PNG File figure12.png |
756 kB |
Paul Fullerton |
Jun 23, 2017 09:40 |
Jun 23, 2017 09:40 |
|
Page: Exploring gene expression data
|
|
PDF File Gene-Leve Analysis of Exon Array Data.pdf |
755 kB |
admin |
Sep 08, 2017 12:58 |
Sep 08, 2017 12:58 |
|
Page: Gene-level Analysis of Exon Array
|
|
PDF File Using the Trio Workflow.pdf |
689 kB |
admin |
Sep 08, 2017 13:04 |
Sep 08, 2017 13:04 |
|
Page: Trio/Duo Analysis
|
|
PNG File image2017-10-27 17:9:30.png |
683 kB |
Paul Fullerton |
Oct 27, 2017 17:09 |
Oct 27, 2017 17:09 |
|
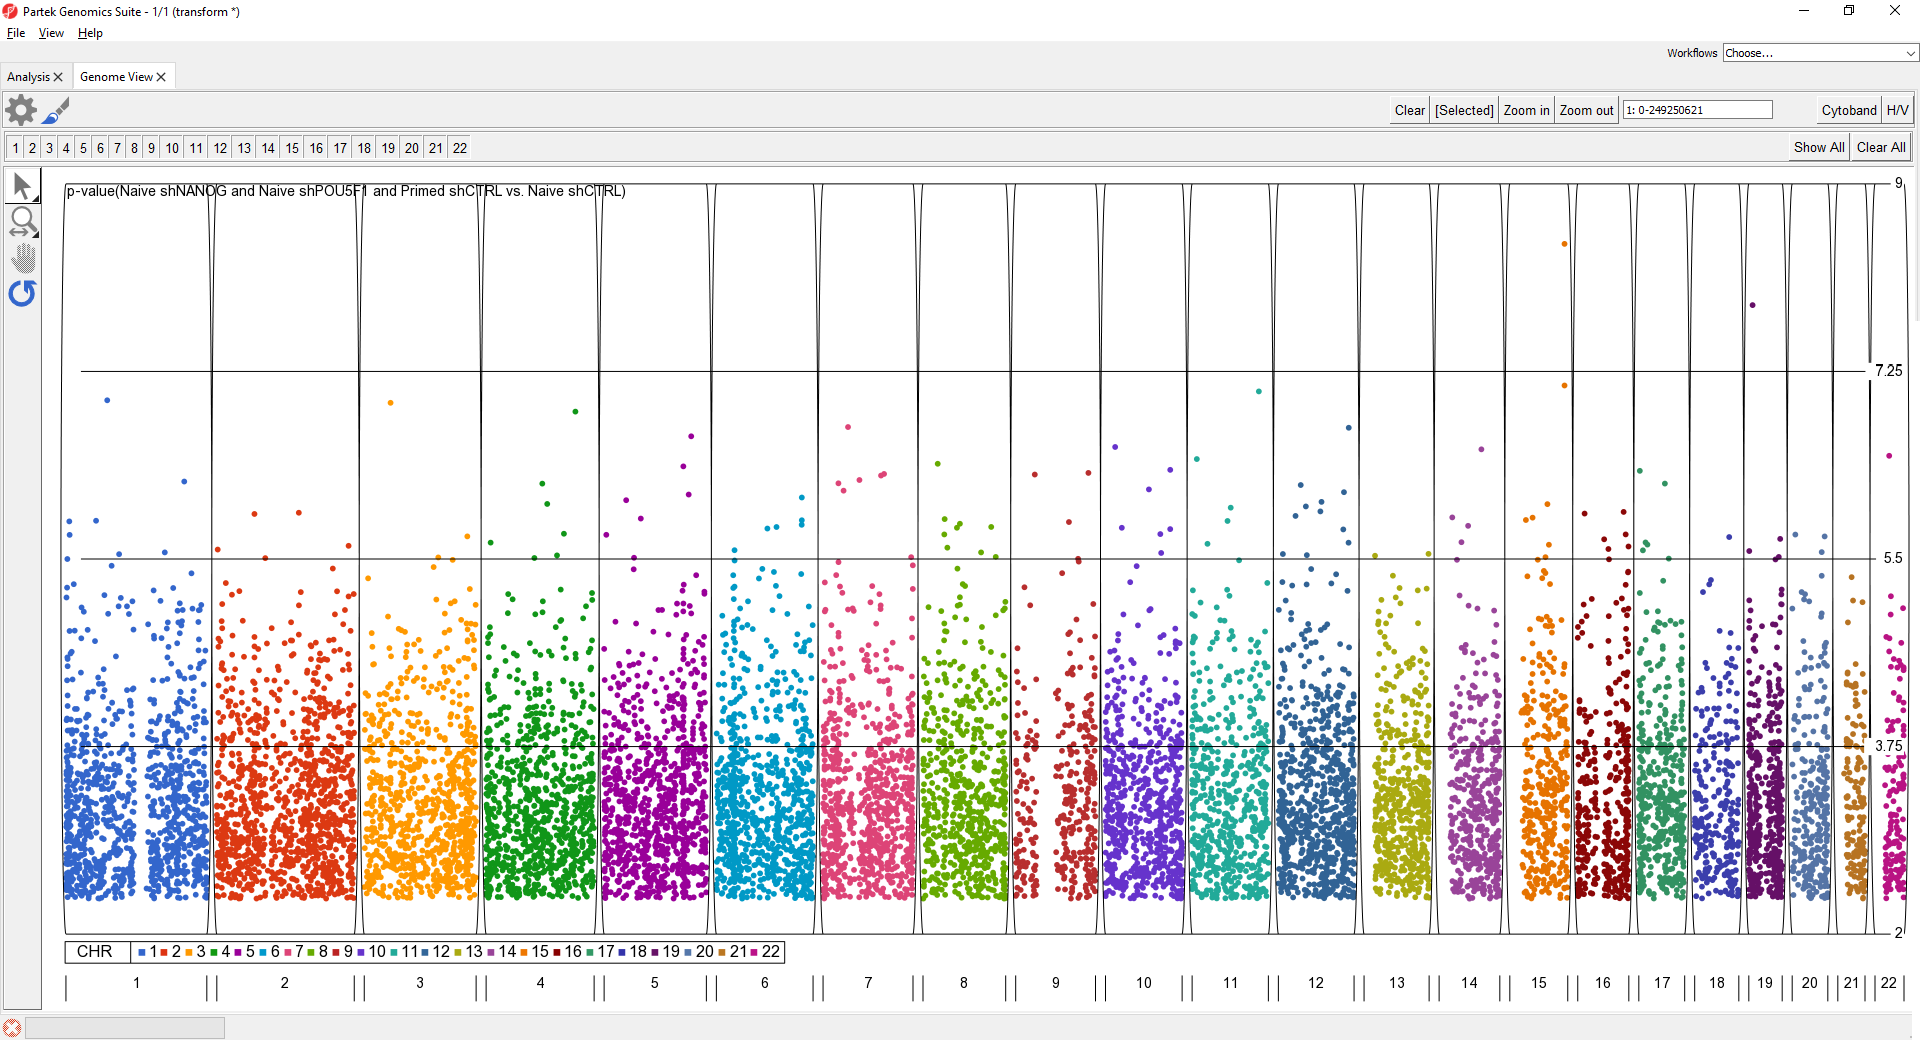
Page: Manhattan Plot
|
|
PNG File figure5.png |
631 kB |
Paul Fullerton |
Jun 23, 2017 09:38 |
Jun 23, 2017 09:38 |
|
Page: Importing Affymetrix CEL files
|
|
PDF File Methylation User Guide.pdf |
582 kB |
admin |
Sep 08, 2017 13:02 |
Sep 08, 2017 13:02 |
|
Page: Methylation Workflows
|
|
PNG File figure17.png |
543 kB |
Paul Fullerton |
Jun 23, 2017 09:42 |
Jun 23, 2017 09:42 |
|
Page: Identifying differentially expressed genes using ANOVA
|
|
PNG File figure19.png |
543 kB |
Paul Fullerton |
Jun 23, 2017 09:43 |
Jun 23, 2017 09:43 |
|
Page: Identifying differentially expressed genes using ANOVA
|
|
PNG File Figure 9 (part 3).png |
508 kB |
Paul Fullerton |
Jun 20, 2017 13:25 |
Jun 20, 2017 14:22 |
|
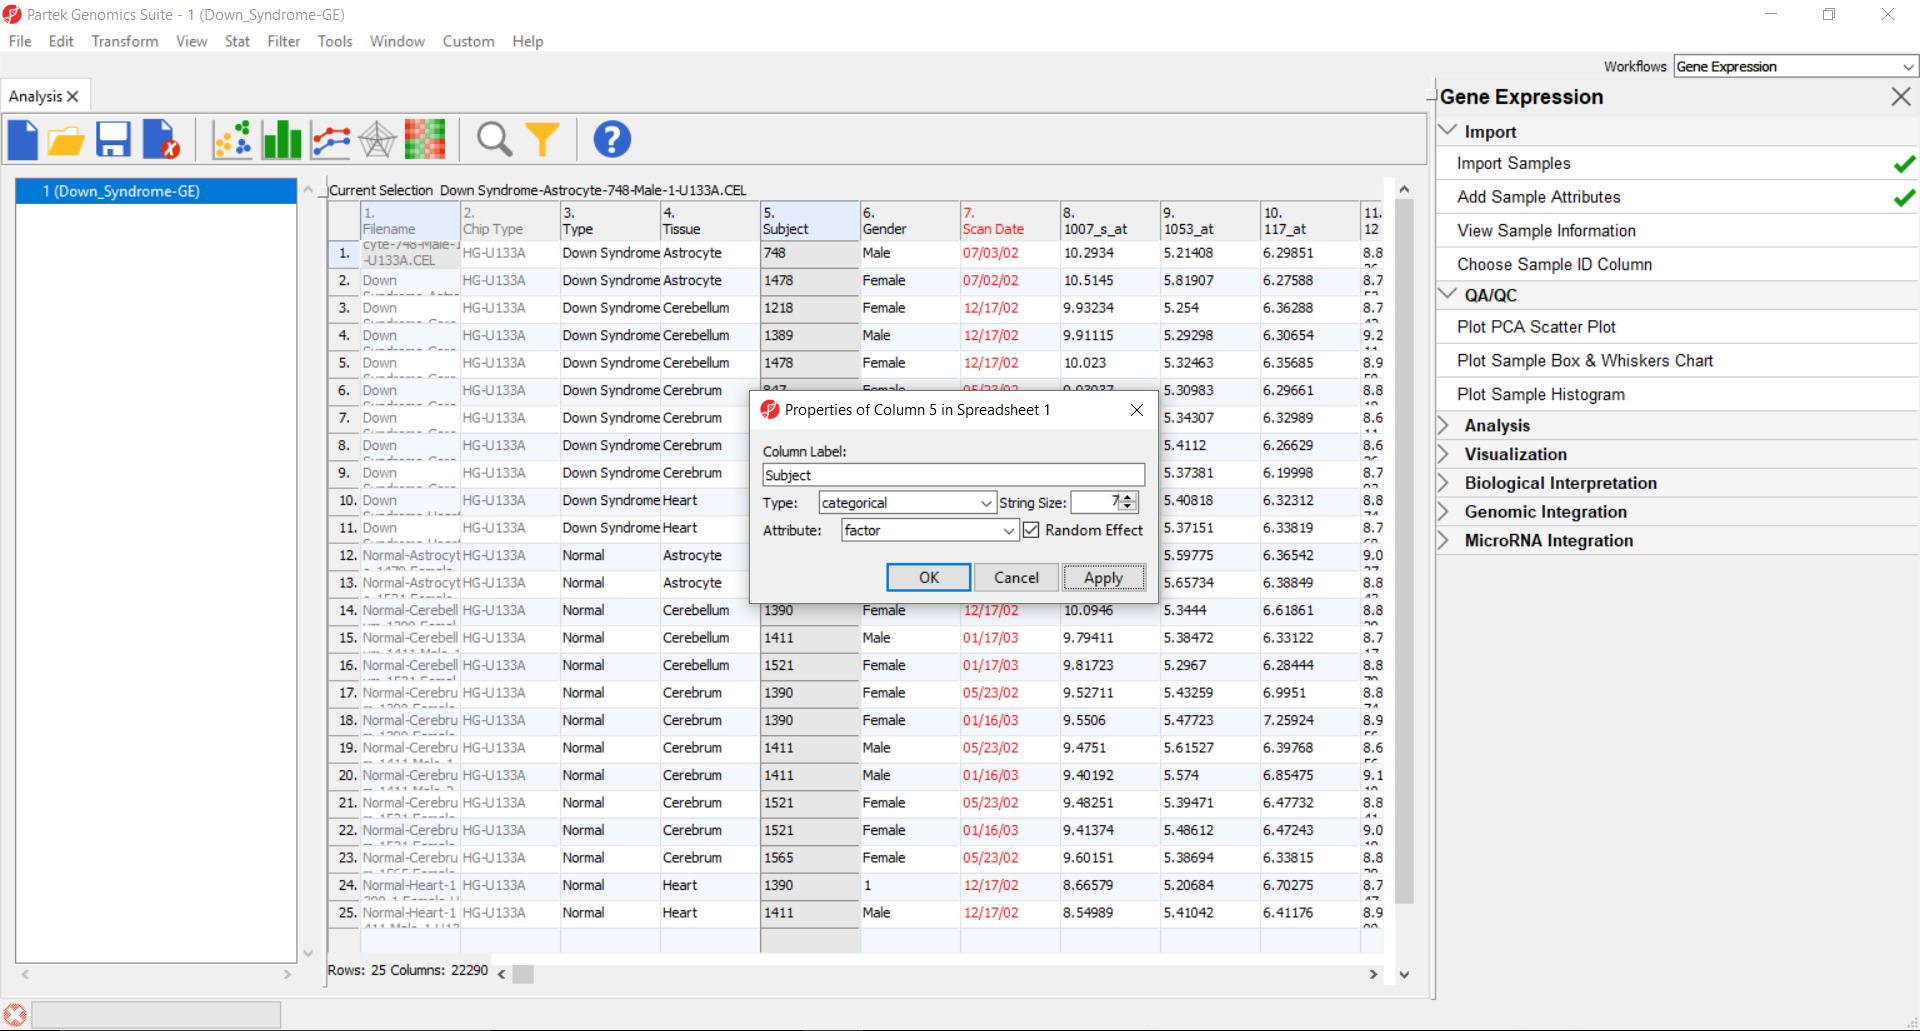
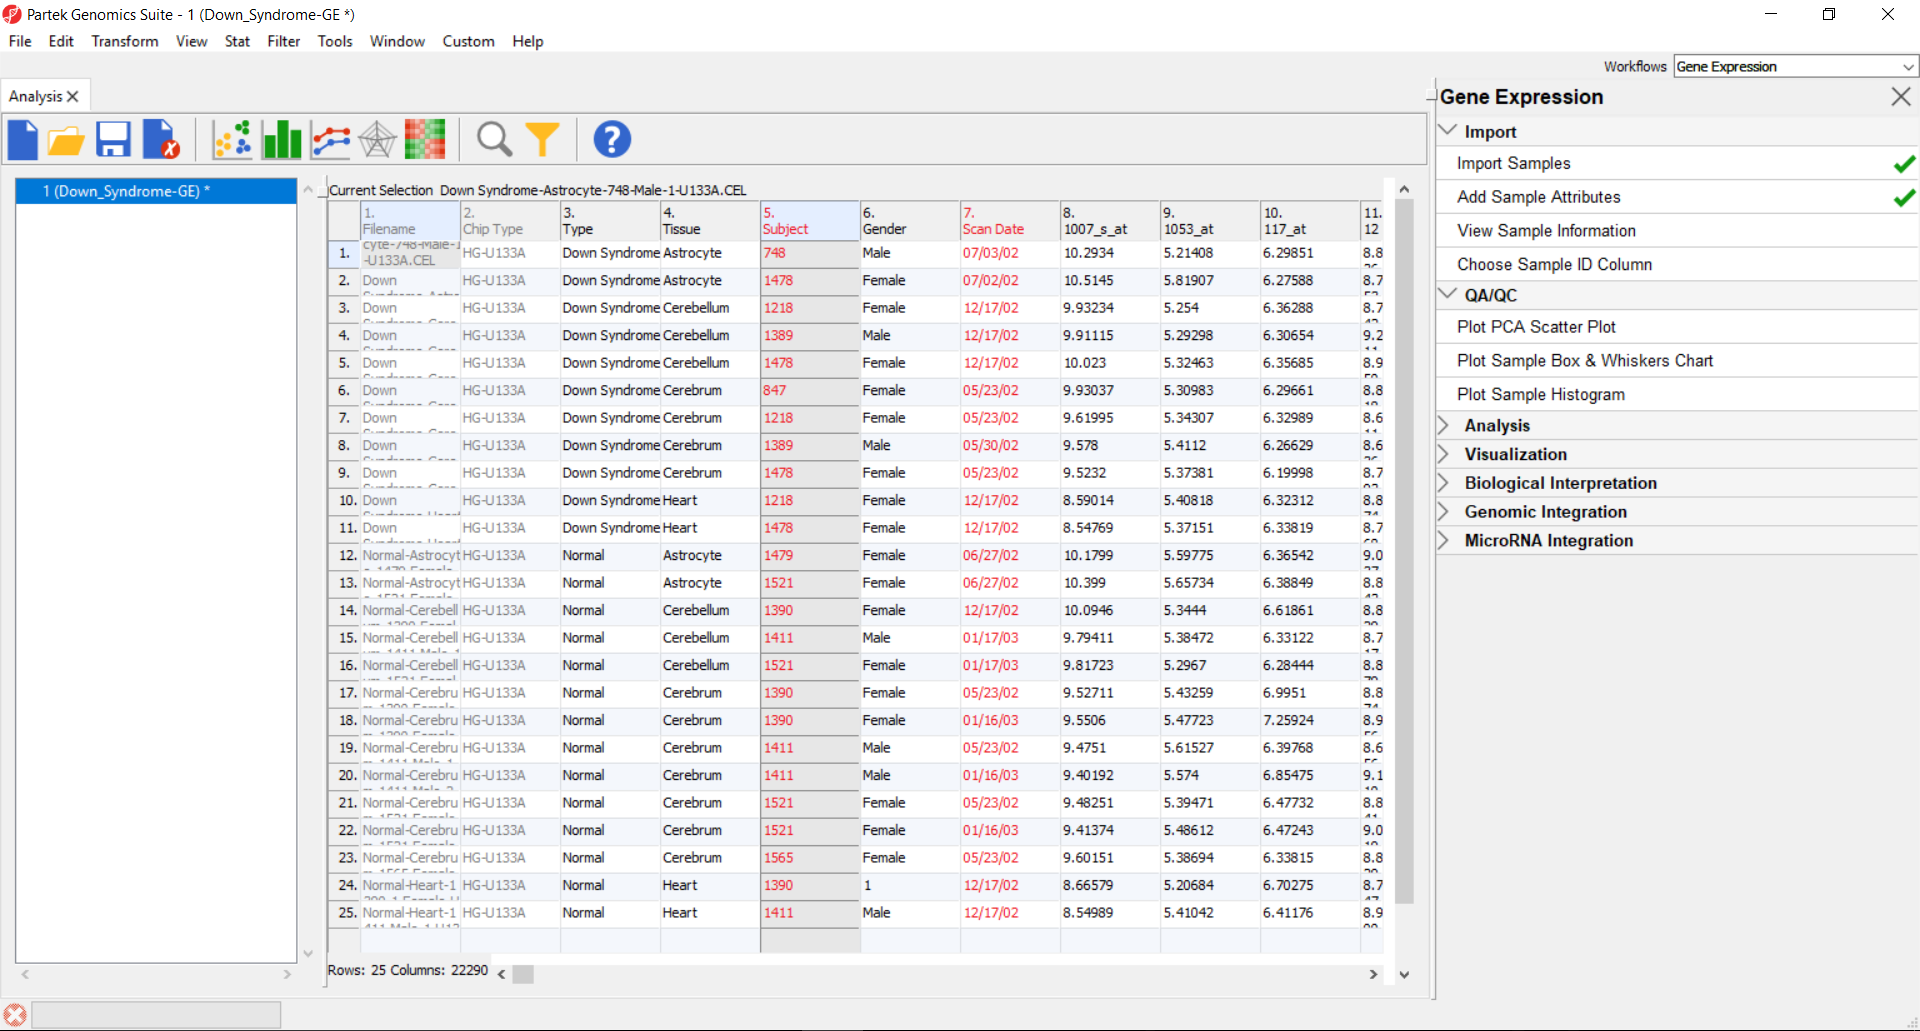
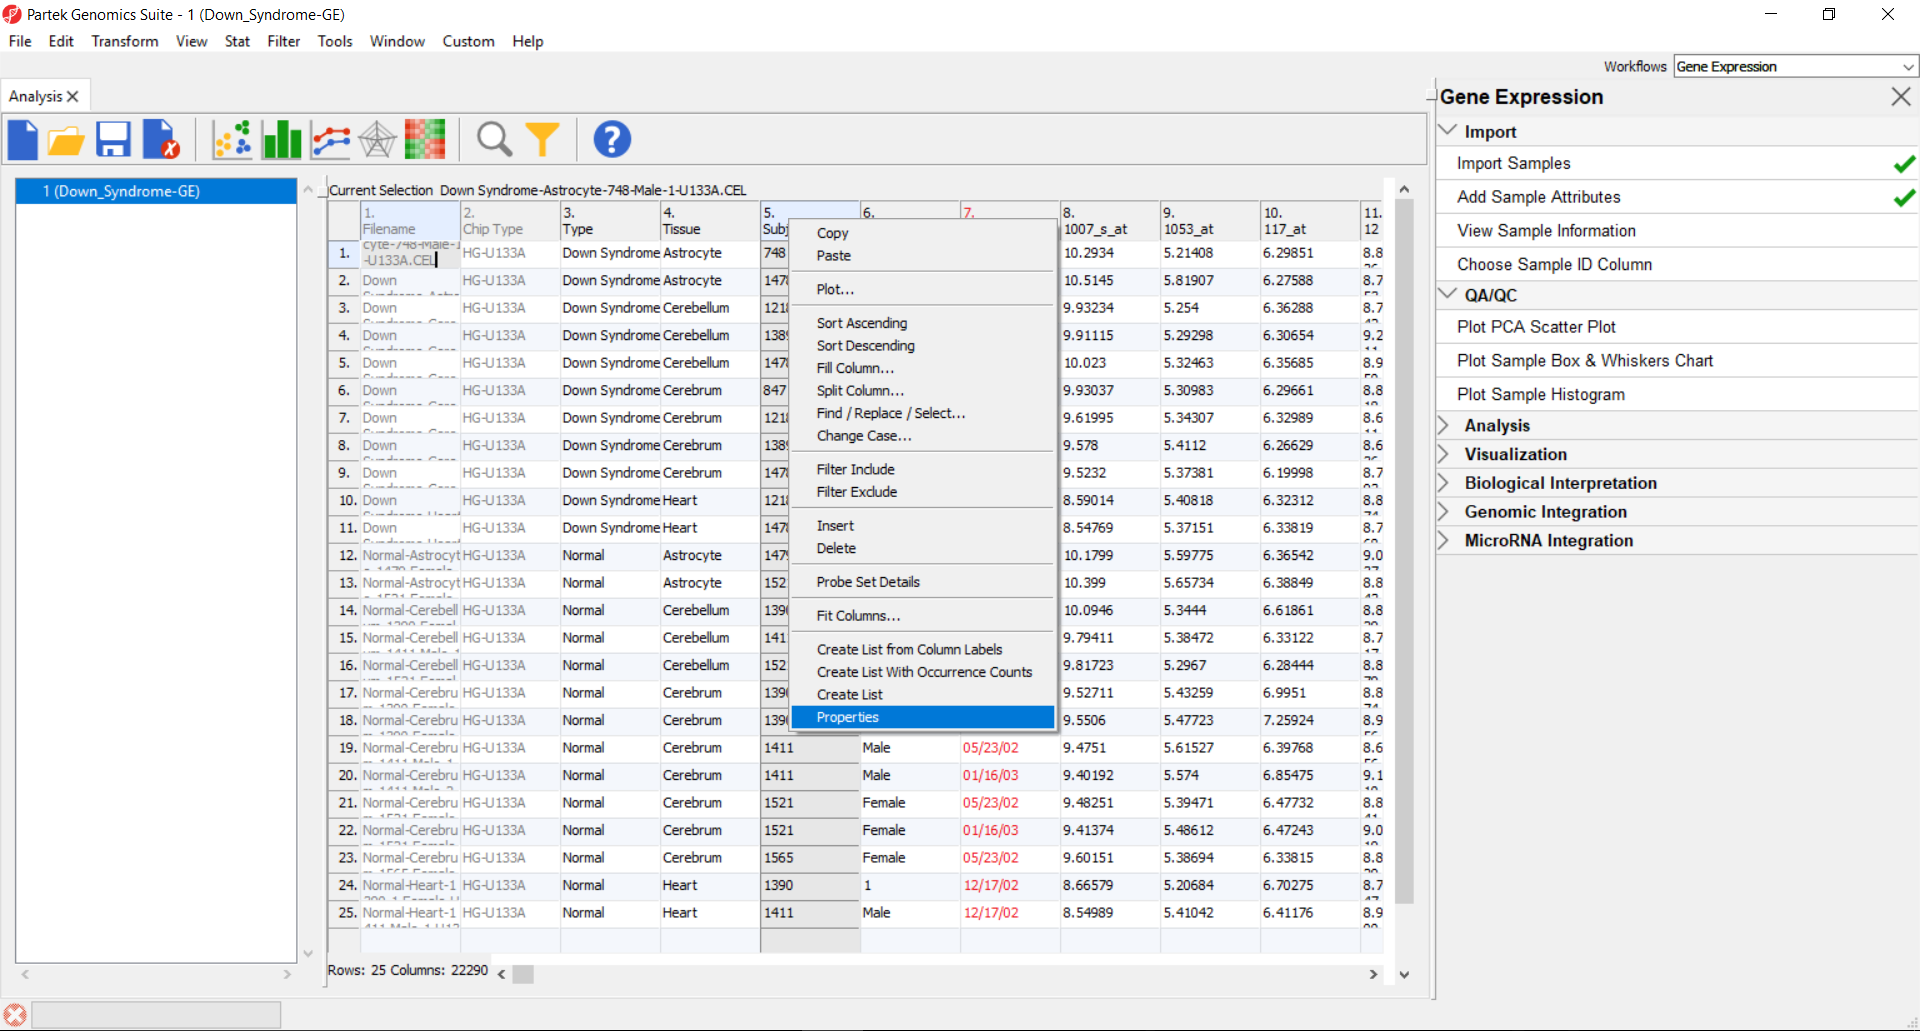
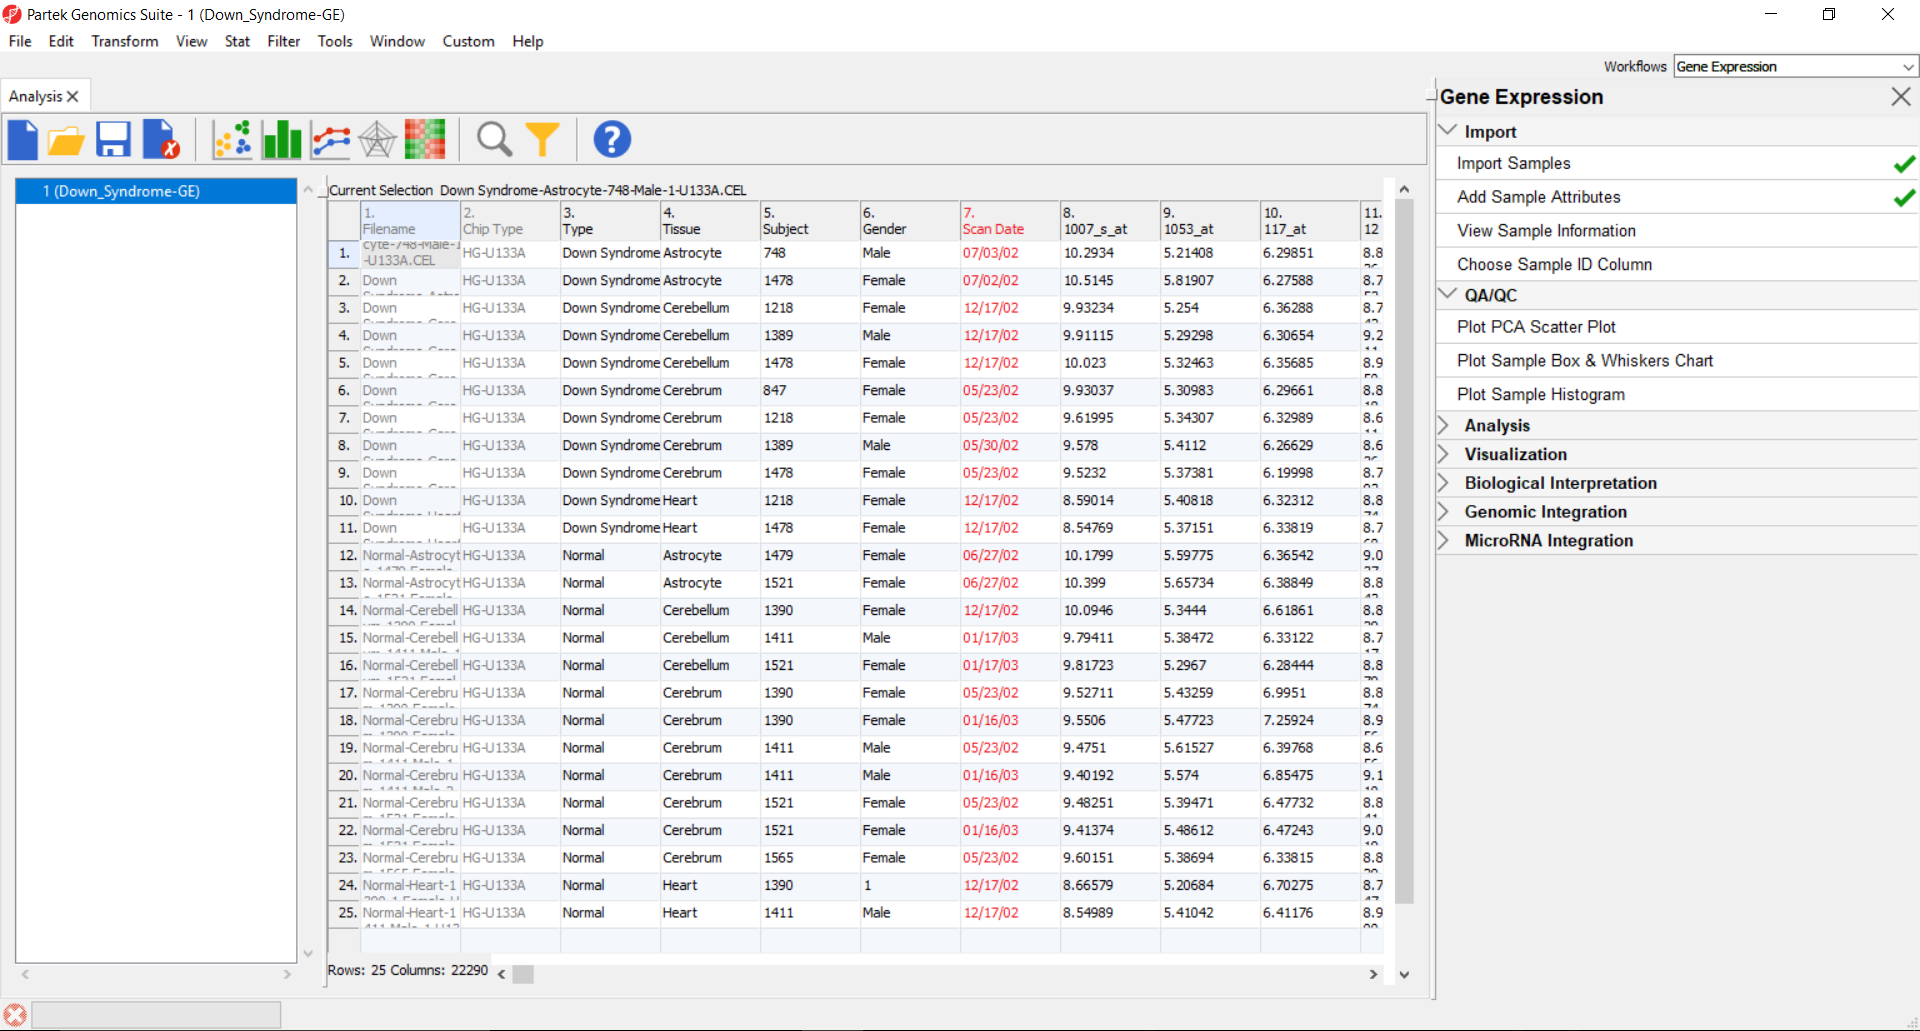
Page: Adding sample information
|
|
PNG File Figure 9 (part 4).png |
505 kB |
Paul Fullerton |
Jun 20, 2017 13:25 |
Jun 20, 2017 14:22 |
|
Page: Adding sample information
|
|
PNG File Figure 9 (part 2).png |
499 kB |
Paul Fullerton |
Jun 20, 2017 13:25 |
Jun 20, 2017 14:22 |
|
Page: Adding sample information
|
|
PNG File Figure 9 (part 1).png |
493 kB |
Paul Fullerton |
Jun 20, 2017 13:25 |
Jun 20, 2017 14:22 |
|
Page: Adding sample information
|
|
PNG File 2017-06-30 14_59_17-UCSC Genome Browser Home.png |
381 kB |
Paul Fullerton |
Jun 30, 2017 15:14 |
Jun 30, 2017 16:03 |
|
Page: Visualize methylation at each locus
|