| Name
|
Size
|
Creator |
Creation Date
|
Last Modification Date
|
Labels |
Attached To |
|
PNG File image2022-8-16_21-13-46.png |
378 kB |
Alex Rutkovsky |
Aug 16, 2022 20:13 |
Aug 16, 2022 20:13 |
|
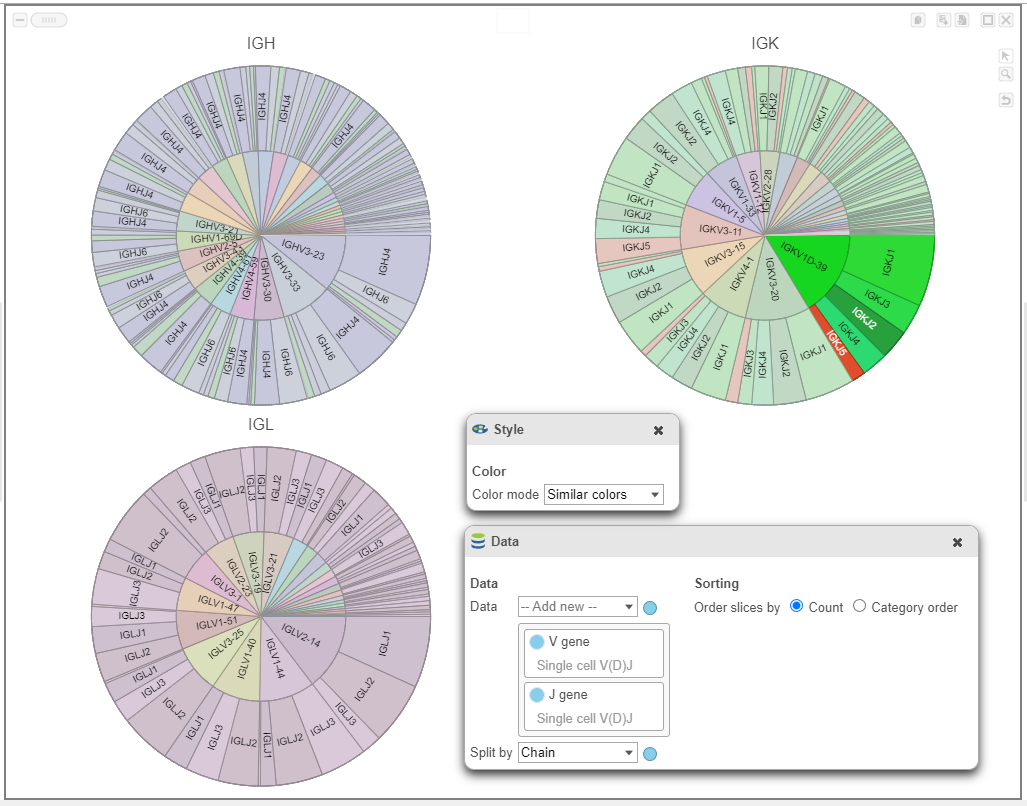
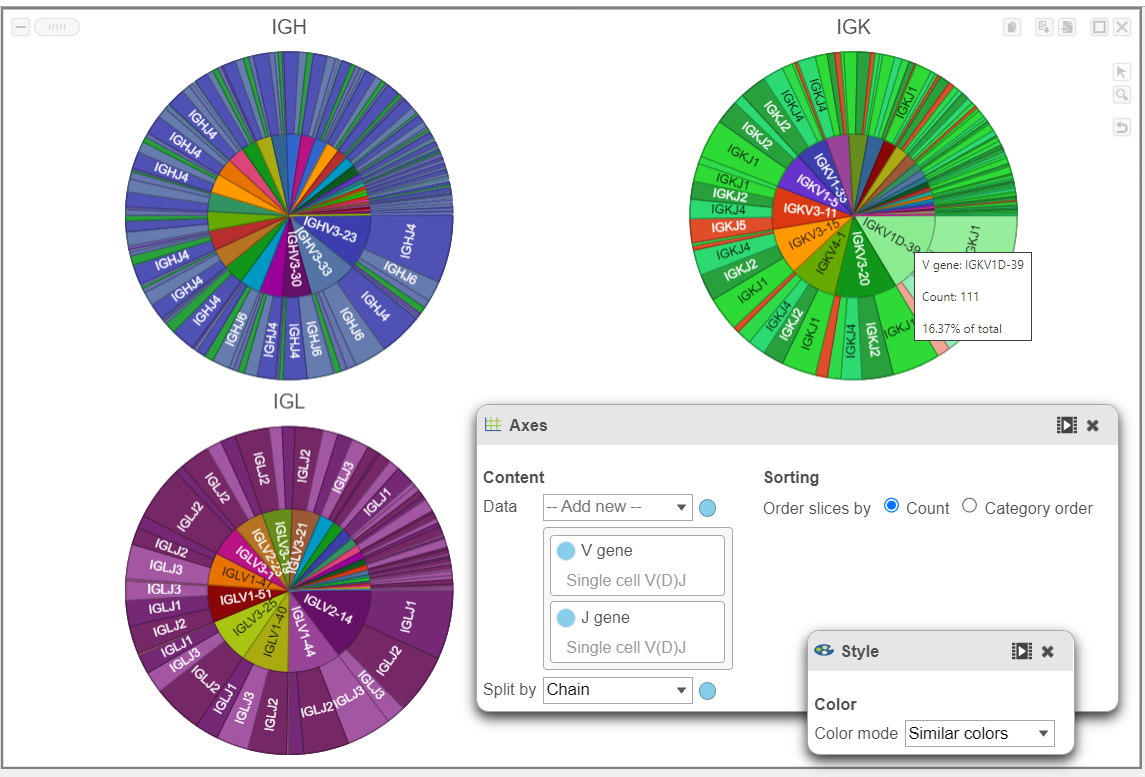
Page: V(D)J Analysis
|
|
PNG File image2022-8-29_17-27-19.png |
378 kB |
Zhengbin Liu |
Aug 30, 2022 13:44 |
Aug 30, 2022 13:44 |
|
Page: Analyzing Single Cell ATAC-Seq data
|
|
PNG File image2022-8-29_17-27-19.png |
378 kB |
Alex Rutkovsky |
Aug 29, 2022 16:27 |
Aug 29, 2022 16:27 |
|
Page: Analyzing Single Cell RNA-Seq Data
|
|
PNG File image2022-8-17_11-6-46.png |
378 kB |
Alex Rutkovsky |
Aug 17, 2022 10:06 |
Aug 17, 2022 10:06 |
|
Page: V(D)J Analysis
|
|
PNG File image2022-8-29_23-49-50.png |
377 kB |
Alex Rutkovsky |
Aug 29, 2022 22:49 |
Aug 29, 2022 22:49 |
|
Page: Classifying Cells
|
|
PNG File Screenshot 2023-11-14 at 16.49.30.png |
374 kB |
Matteo Luberti |
Nov 14, 2023 10:49 |
Nov 14, 2023 10:49 |
|
Page: The Analyses Tab
|
|
PNG File Screenshot 2023-08-09 at 15.24.17.png |
374 kB |
Matteo Luberti |
Aug 09, 2023 09:58 |
Aug 09, 2023 09:58 |
|
Page: Performing biological interpretation
|
|
PNG File Screenshot 2023-11-14 at 16.46.48.png |
370 kB |
Matteo Luberti |
Nov 14, 2023 10:46 |
Nov 14, 2023 10:46 |
|
Page: The Analyses Tab
|
|
PNG File Screenshot 2022-12-21 at 16.43.09.png |
369 kB |
Matteo Luberti |
Dec 21, 2022 10:58 |
Dec 21, 2022 10:58 |
|
Page: Histograms
|
|
PNG File image2019-5-24 11:5:24.png |
369 kB |
Paul Fullerton |
May 24, 2019 11:05 |
May 24, 2019 11:05 |
|
Page: Analyzing CITE-Seq Data
|
|
PNG File image2022-8-16_21-11-53.png |
369 kB |
Alex Rutkovsky |
Aug 16, 2022 20:11 |
Aug 16, 2022 20:11 |
|
Page: V(D)J Analysis
|
|
PNG File image2018-2-16 14:50:46.png |
367 kB |
Paul Fullerton |
Feb 16, 2018 14:50 |
Feb 16, 2018 14:50 |
|
Page: Compare expression between cell types with multiple samples
|
|
PNG File image2018-2-16 14:50:46.png |
367 kB |
Alex Rutkovsky |
Jul 12, 2023 07:38 |
Jul 12, 2023 07:38 |
|
Page: Make comparisons using Compute biomarkers and Biological interpretation
|
|
PNG File image2018-2-16 14:50:46.png |
367 kB |
Alex Rutkovsky |
Jul 07, 2023 11:29 |
Jul 07, 2023 11:29 |
|
Page: Spatial data analysis steps
|
|
PNG File image2019-5-15 15:42:9.png |
367 kB |
Paul Fullerton |
May 15, 2019 15:42 |
May 15, 2019 15:42 |
|
Page: Analyzing CITE-Seq Data
|
|
PNG File image2018-2-16 14:51:4.png |
367 kB |
Paul Fullerton |
Feb 16, 2018 14:51 |
Feb 16, 2018 14:51 |
|
Page: Compare expression between cell types with multiple samples
|
|
PNG File image2018-2-16 14:51:4.png |
367 kB |
Alex Rutkovsky |
Jul 12, 2023 07:38 |
Jul 12, 2023 07:38 |
|
Page: Make comparisons using Compute biomarkers and Biological interpretation
|
|
PNG File image2018-2-16 14:51:4.png |
367 kB |
Alex Rutkovsky |
Jul 07, 2023 11:29 |
Jul 07, 2023 11:29 |
|
Page: Spatial data analysis steps
|
|
PNG File image2022-8-31_14-24-24.png |
366 kB |
Alex Rutkovsky |
Aug 31, 2022 13:24 |
Aug 31, 2022 13:24 |
|
Page: Compare expression between cell types with multiple samples
|
|
PNG File image2022-8-31_14-24-24.png |
366 kB |
Alex Rutkovsky |
Jul 12, 2023 07:39 |
Jul 12, 2023 07:39 |
|
Page: Make comparisons using Compute biomarkers and Biological interpretation
|