After alignment has completed, we can view the quality of alignment by performing post-alignment QA/QC.
- Click the Aligned reads data node
- Click QA/QC inthe task menu
- Click Post-alignment QA/QC from the QA/QC section of the task menu (Figure 1)
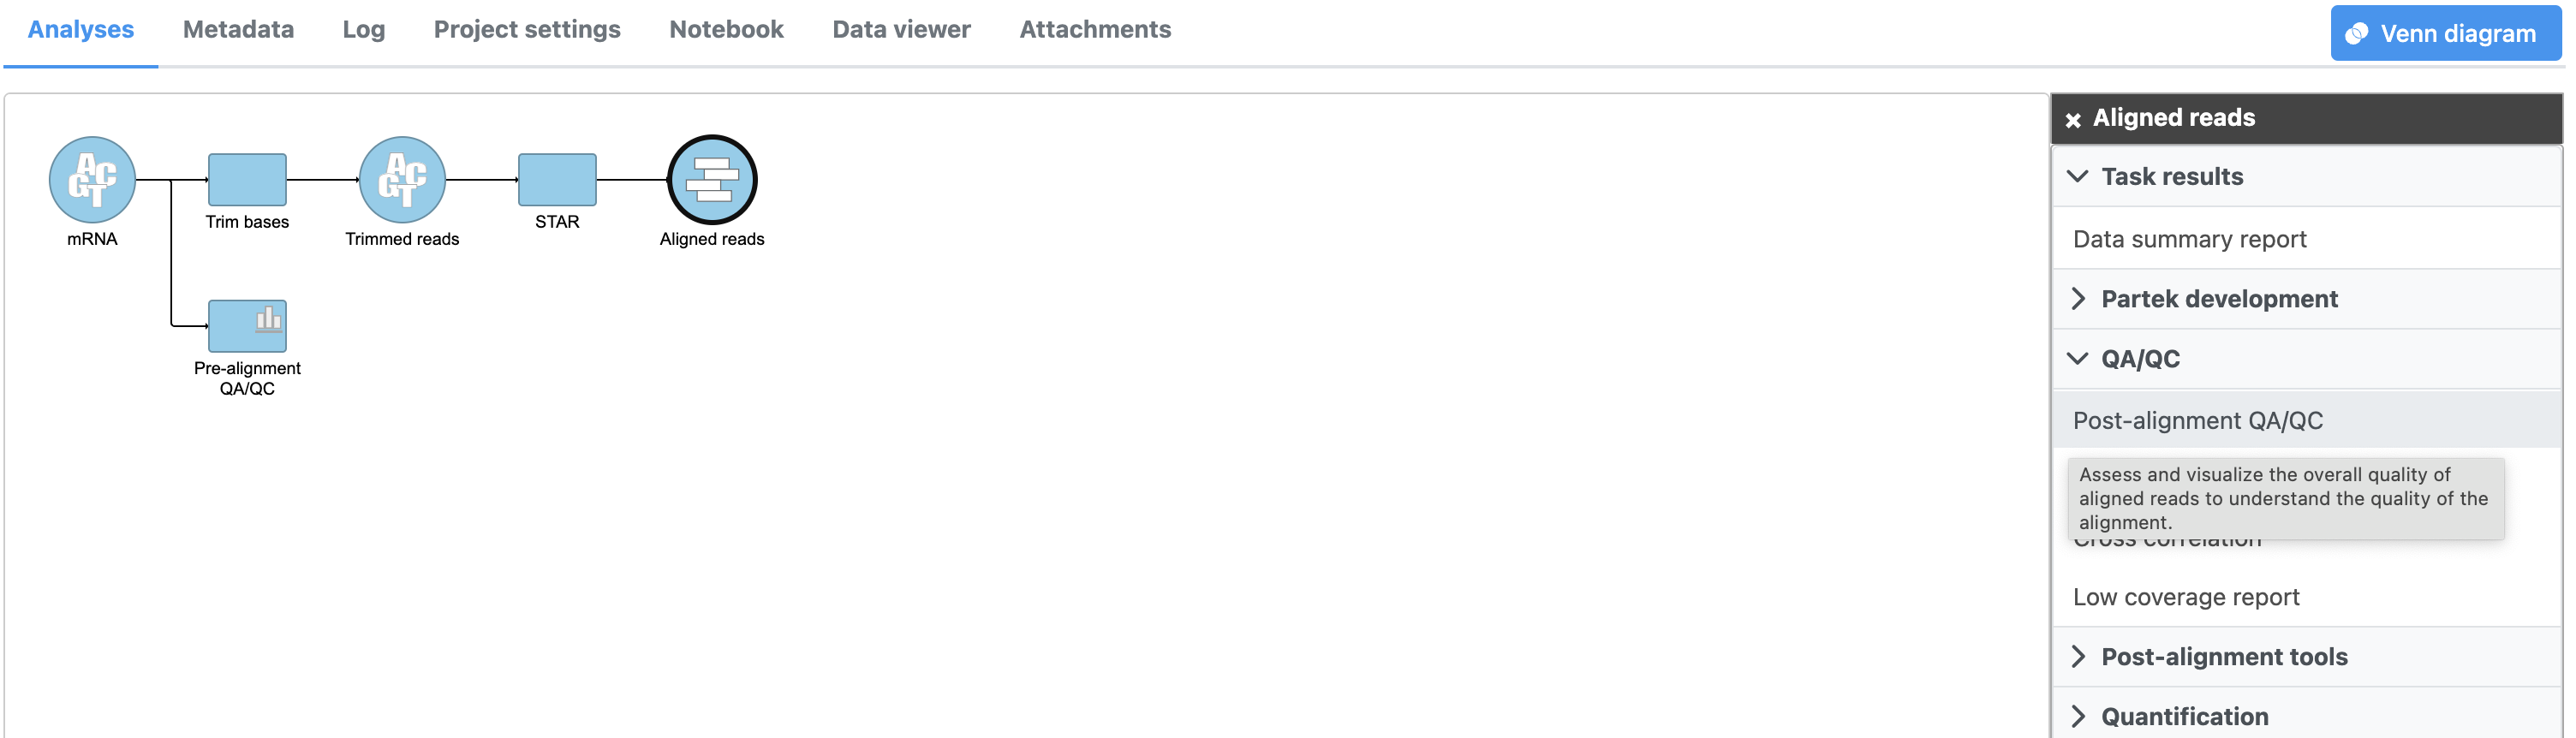
Figure 1. Invoking Post-alignment QA/QC
A Post-alignment QA/QC task node will be generated (Figure 2).
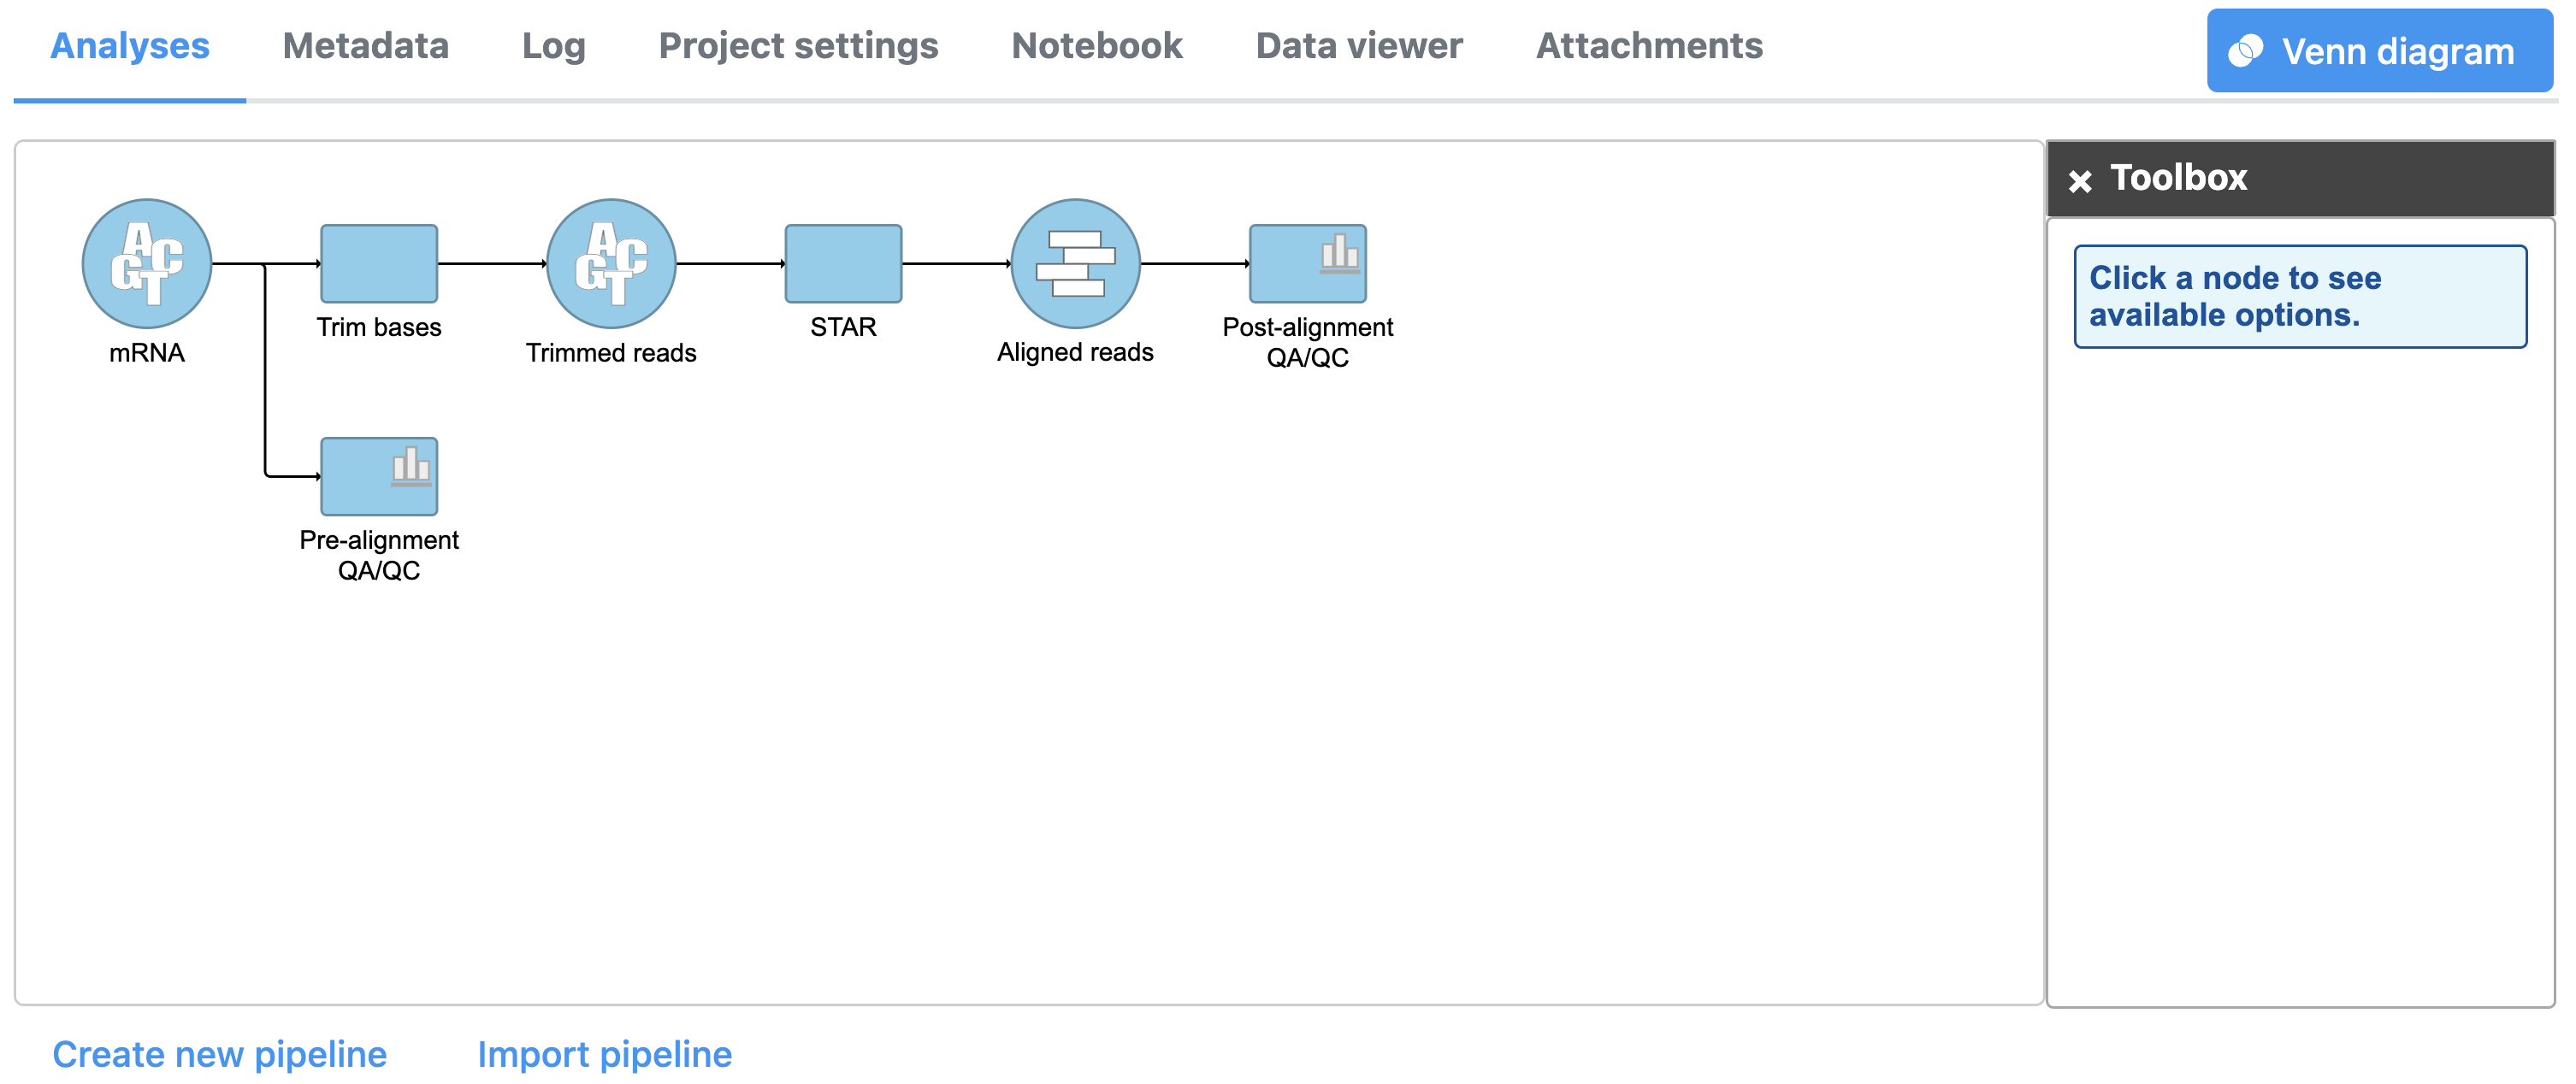
Figure 2. Post-alignment QA/QC task node
- Double-click the Post-alignment QA/QC task node to view the task report
Similar to the Pre-alignment QA/QC task report, general quality information about the whole data set is displayed and sample-level reports can be opened by clicking a sample name in the table.
The top two graphs in the data set view (Figure 3) show the alignment breakdown and coverage.
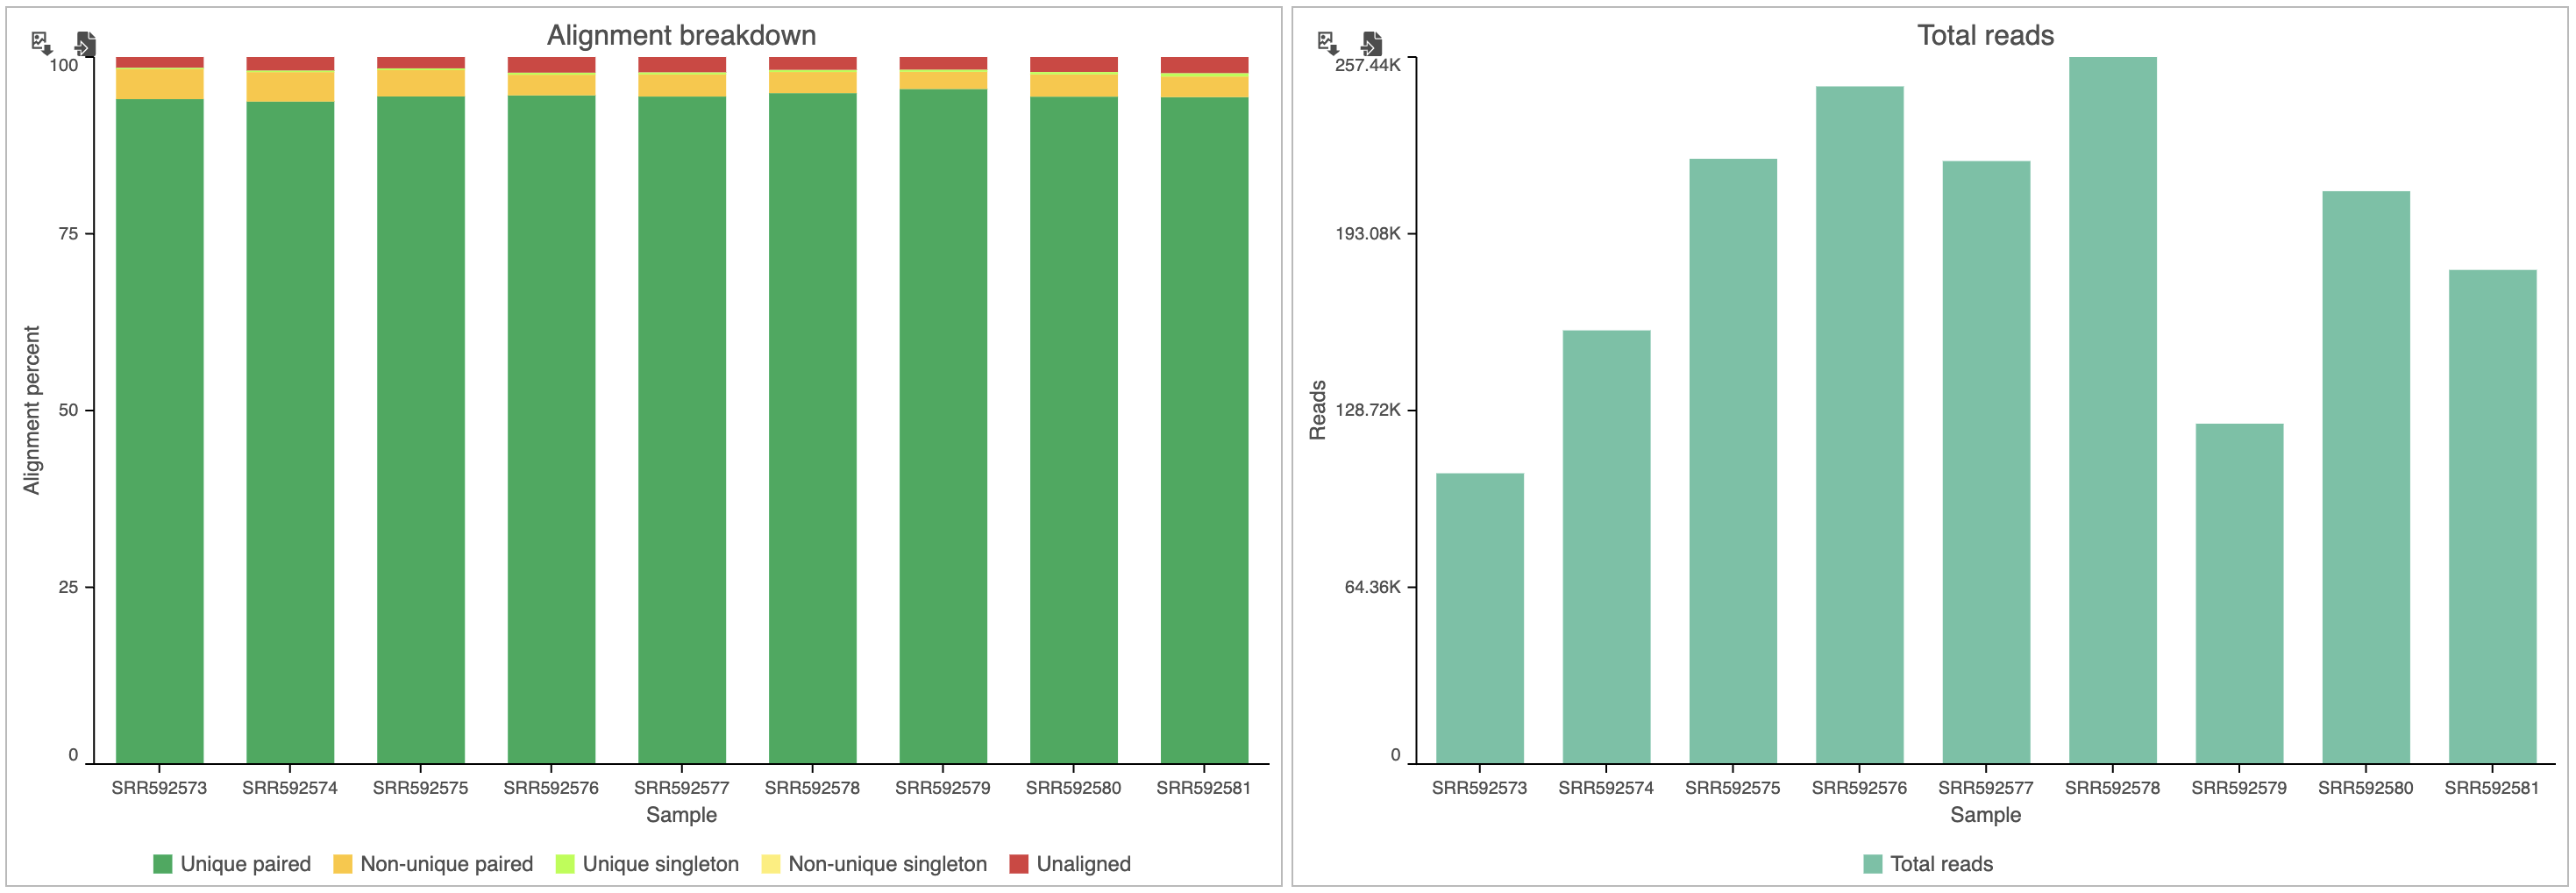
Figure 3. Alignment statistics for the data set
From these graphs, we can see that more than 95% of reads were aligned, but the total number of reads for each sample varies. Normalizing for the variability in total read counts will be addressed in a later section of the tutorial.
For more information about the graphs and information presented in the Post-alignment QA/QC task report, see the Post-alignment QA/QC user guide.
Additional Assistance
If you need additional assistance, please visit our support page to submit a help ticket or find phone numbers for regional support.


| Your Rating: |
|
Results: |

|
30 | rates |
Overview
Content Tools