Post-alignment QA/QC is available for data nodes containing aligned reads (Aligned reads) and has no special control dialog. Similar to the pre-alignment QA/QC report, the post-alignment contains two tiers, i.e. project-level report and sample-level report.
The project-level report starts with a summary table (Figure 1). Unlike pre-alignment QA/QC report, each row now corresponds to a sample (sample names are hyperlinks to sample-level report). Table allows for a quick comparison across all the samples within the project. Any outlying sample can, therefore, easily be spotted.
Note that the summary table reflects the underlying chemistry. While Figure 1 shows a summary table for single-end sequencing, an example table for paired-end sequencing is given in Figure 2. Common features are discussed first.
The first two columns contain total number of reads (Total reads) and total number of alignments (Total alignments). Theoretically, for single-end chemistry, total number of reads equals total number of alignments. For double-end reads, theoretical result is to have twice as many alignments as reads (the term “read” refers to the fragment being sequenced, and since each fragment is sequenced from two directions, one can expect to get two alignments per fragment). When counting the actual number of alignments (Total alignments), however, reads that align more than once (multimappers) are also taken into account. Next, the Aligned column contains the fraction of all the reads that were aligned to the reference assembly.
The Coverage column shows the fraction (%) of the reference assembly that was sequenced and the average sequencing coverage (×) of the covered regions is in the Avg. coverage depth column. The Avg. quality is mapping quality, as reported by the aligner (not all aligners support this metric). Avg. length is the average read length and average read quality is given in Avg. quality column. Finally, %GC is the fraction of G or C calls.
In addition, the Post-alignment QA/QC report for single-end reads (Figure 1) contains the Unique column. This refers to the fraction of uniquely aligned reads.
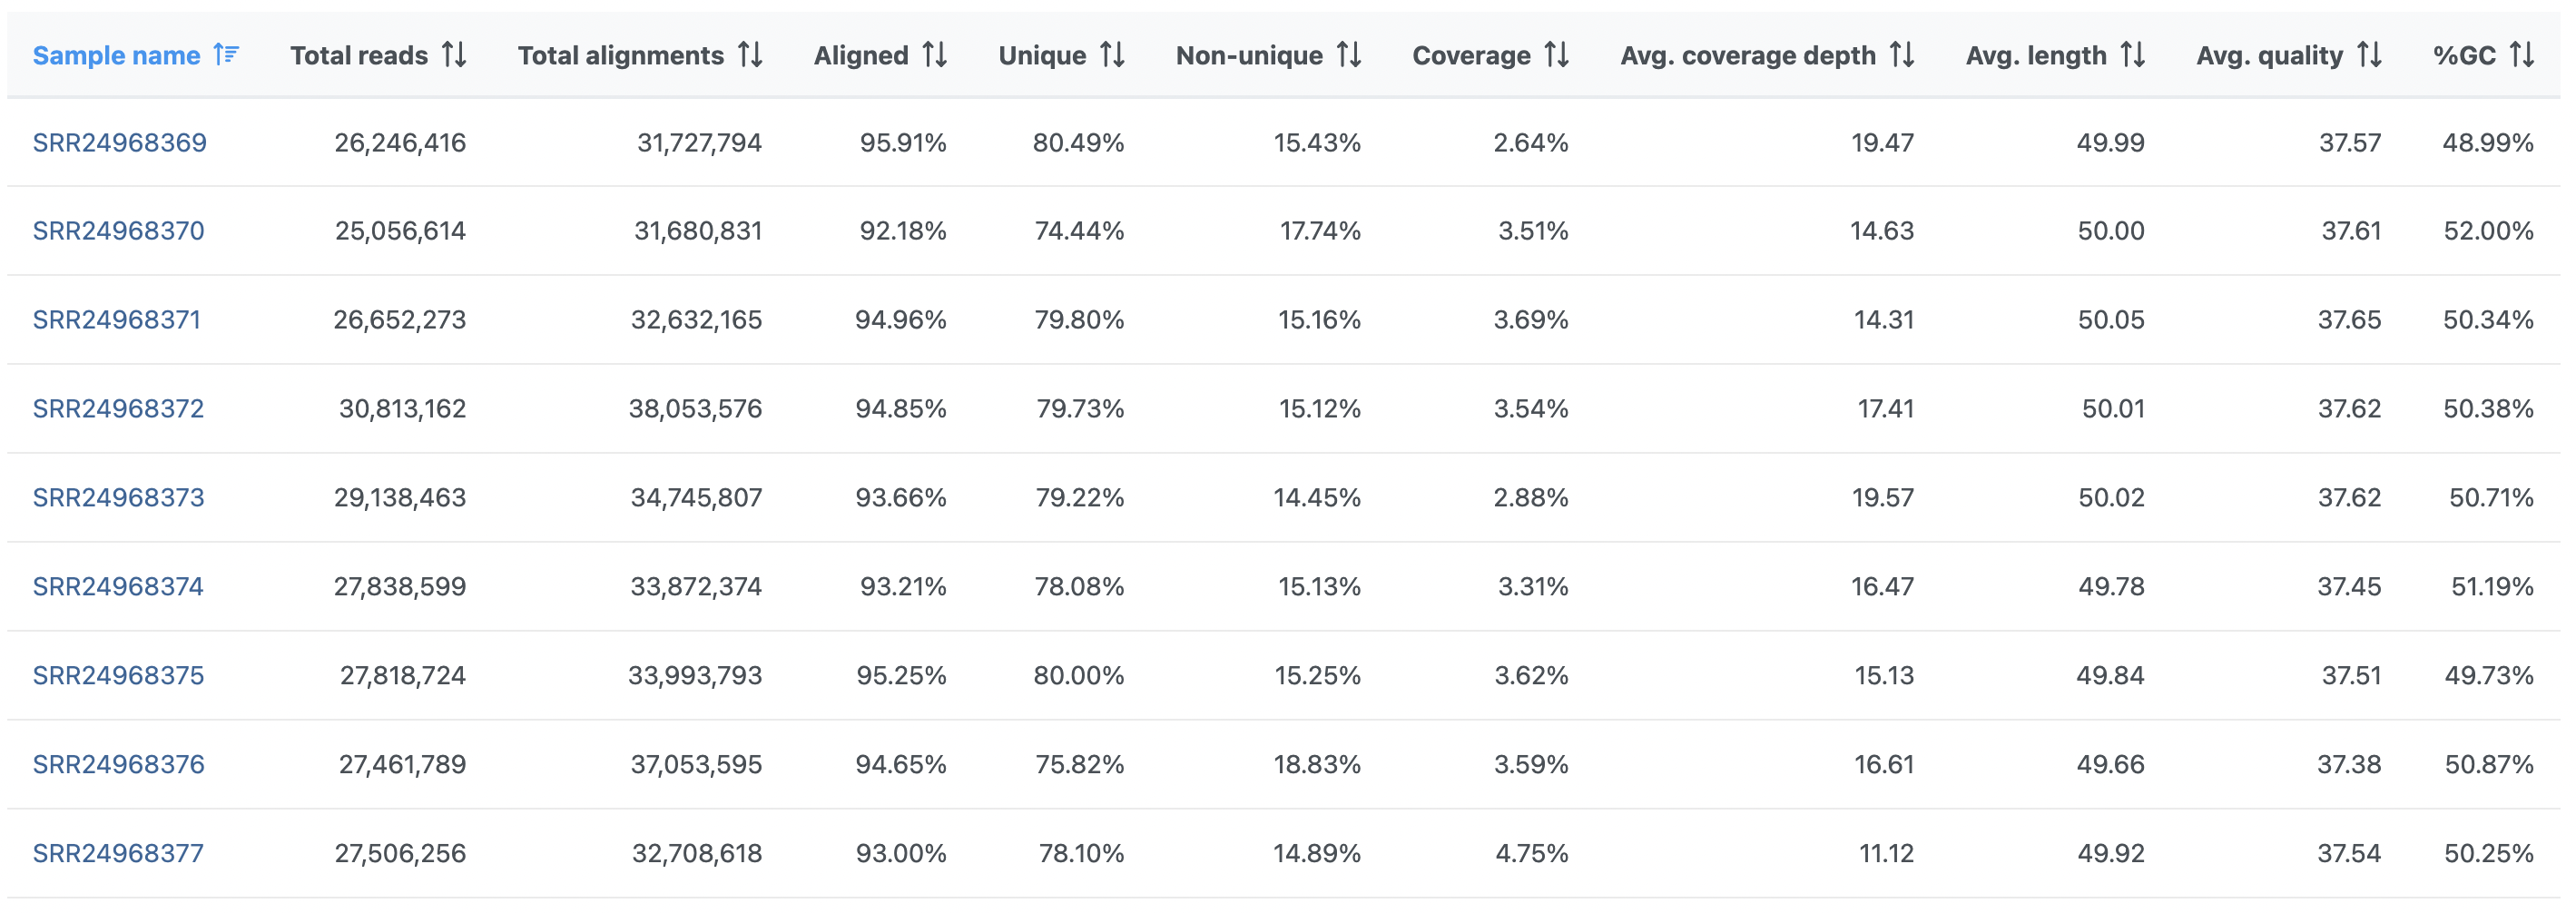
Figure 1. Post-alignment QA/QC output table for single-end sequencing
On the other hand, the Post-alignment QA/QC report for paired-end reads (Figure 2) contains these columns:
- Unique singleton
- fraction of alignments corresponding to the reads where only one of the paired reads can be uniquely aligned
- Unique paired
- fraction of alignments corresponding to the reads where both of the paired reads can be uniquely aligned
- Non-unique singleton
- fraction of singletons that align to multiple locations
- Non-unique paired
- fraction of paired reads that align to multiple locations
Note: for paired-end reads, if one end is aligned, the mate is not aligned, the alignment rate calculating will include the read as the numerator, also since the mate is not aligned, we will also include this read in the unaligned data node (if the generate unaligned reads data node option is selected) for 2nd stage alignment, this will generate discrepancy between total reads and "unaligned reads + total reads * alignment rate", because reads with only one mate aligned are counted twice.
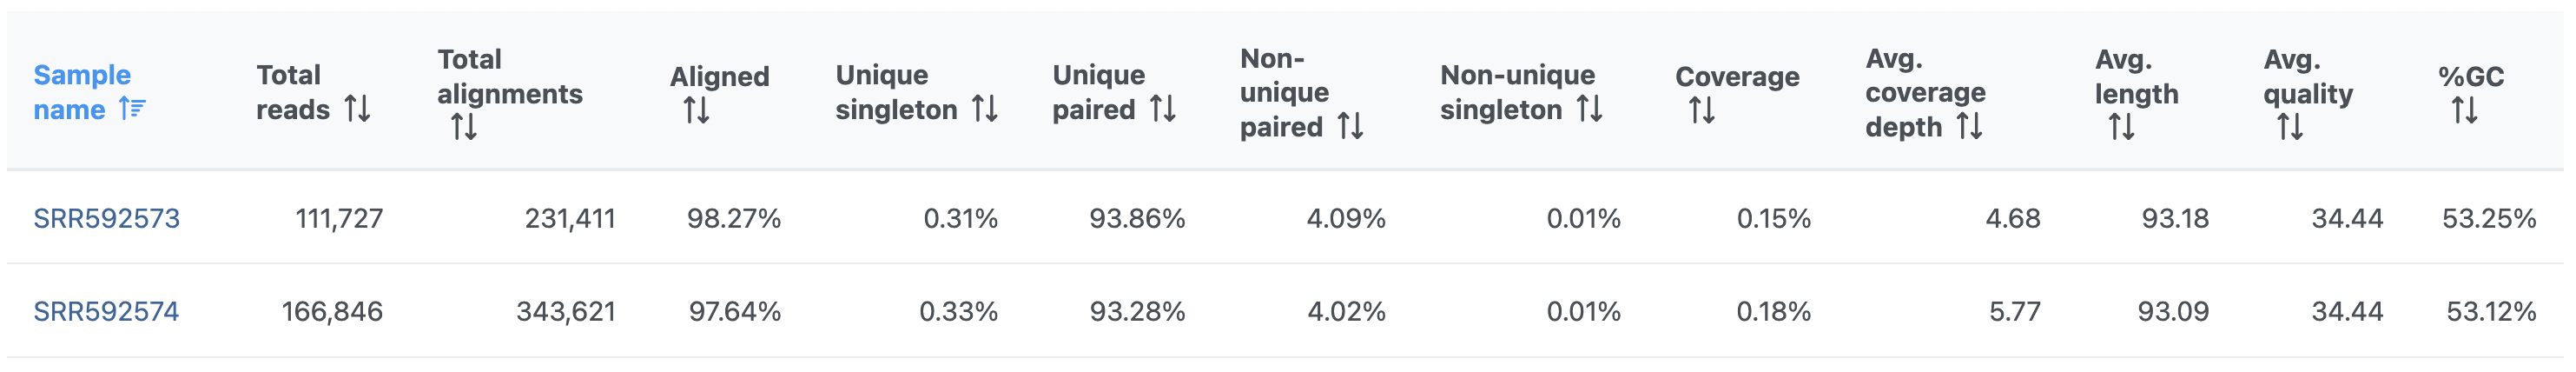
Figure 2. Post-alignment QA/QC output table for paired-end sequencing
In addition to the summary table, several graphs are plotted to give a comparison across multiple samples in the project. Those graphs are Alignment breakdown, Coverage, Genomic Coverage, Average base quality per position, Average base quality score per read, and Average alignments per read. Two of those (Average base quality plots) have already been described.
The alignment breakdown chart (Figure 3) presents each sample as a column, and has two vertical axes (i.e. Alignment percent and Total reads). The percentage of reads with different alignment outcomes (Unique paired, Unique singleton, Non-unique, Unaligned) is represented by the left-side y-axis and visualized by stacked columns. The total number of reads in each sample is given using the black line and shown on the right-side y-axis.
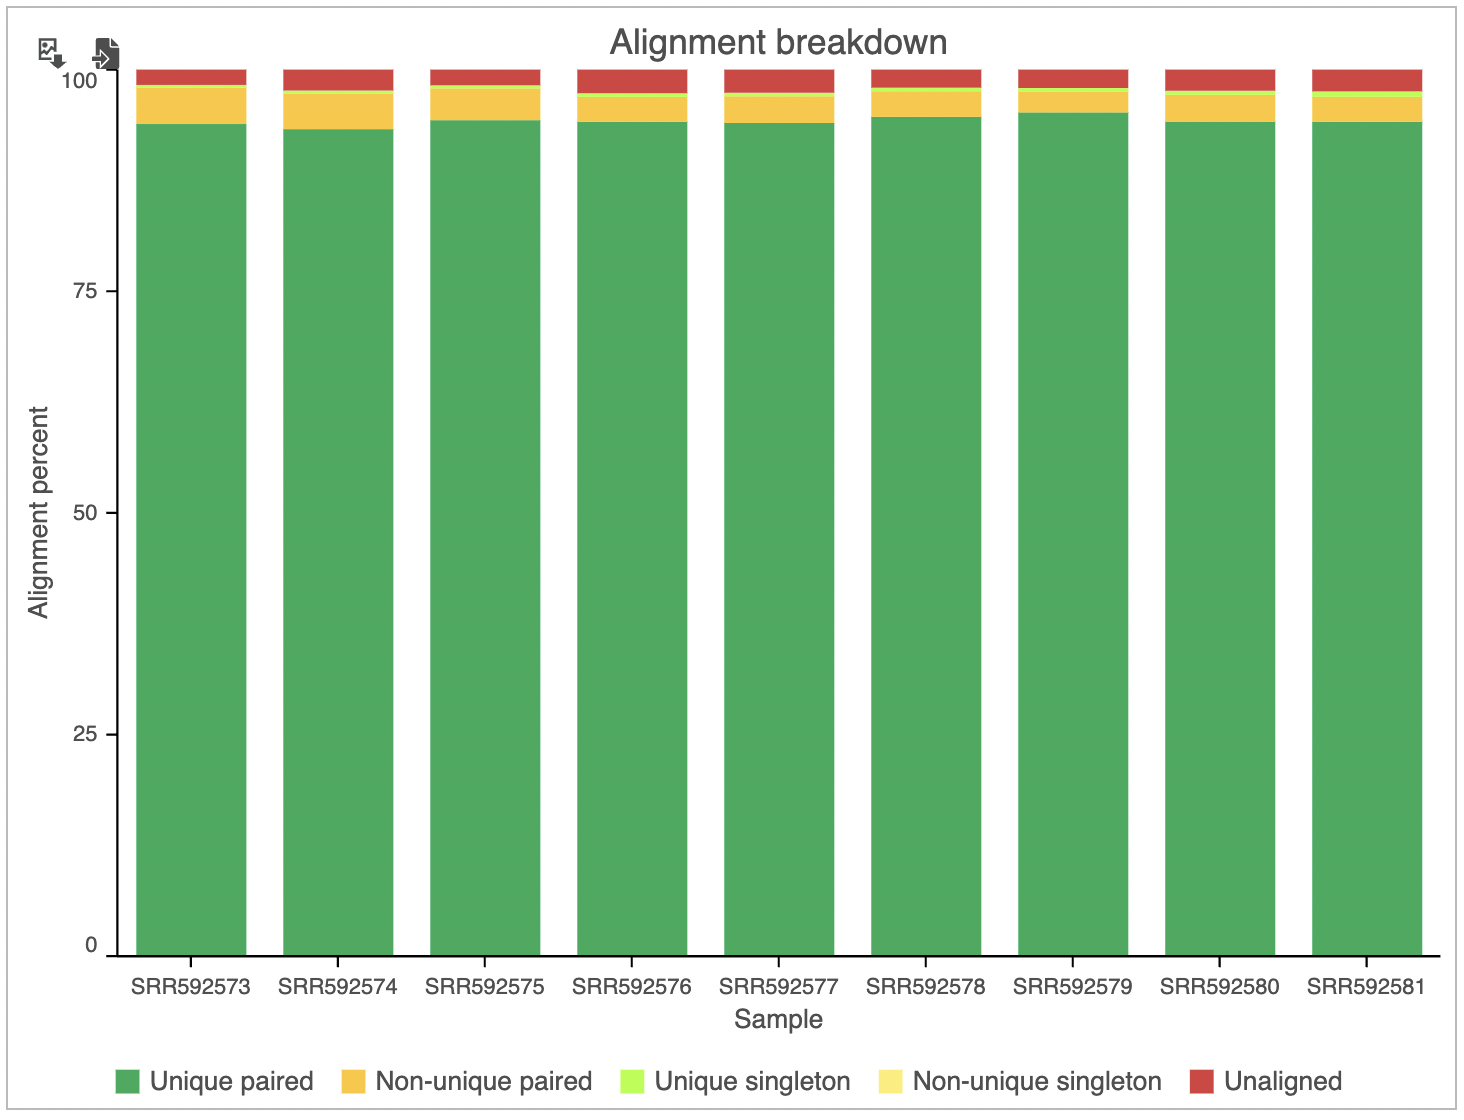
Figure 3. Alignment breakdown plot. Each sample is a column. Fraction of reads with respect to their alignment status is given on the left-side y-axis and colour coded. Total number of reads is depicted by the black line and can be red on the right-side y-axis
The Coverage plot (Figure 4) shows the Average read depth (in covered regions) for each sample using columns and can be red off the left-hand y-axis. Similarly, the Genomic coverage plot shows genome coverage in each sample, expressed as a fraction of the genome.
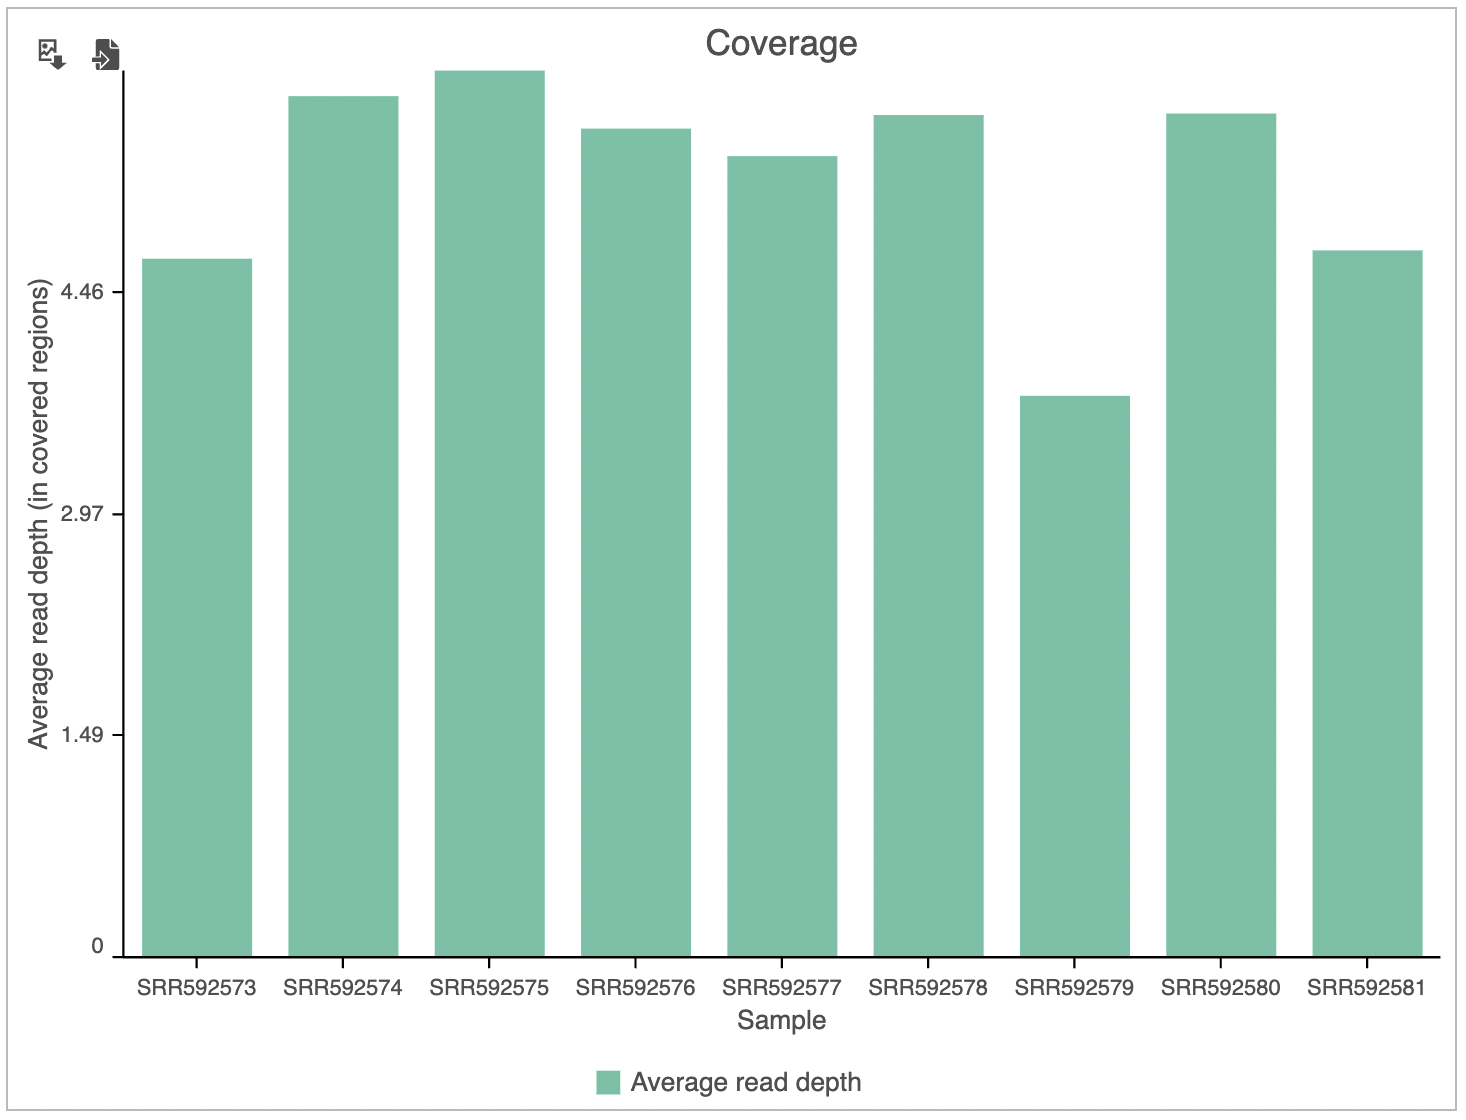
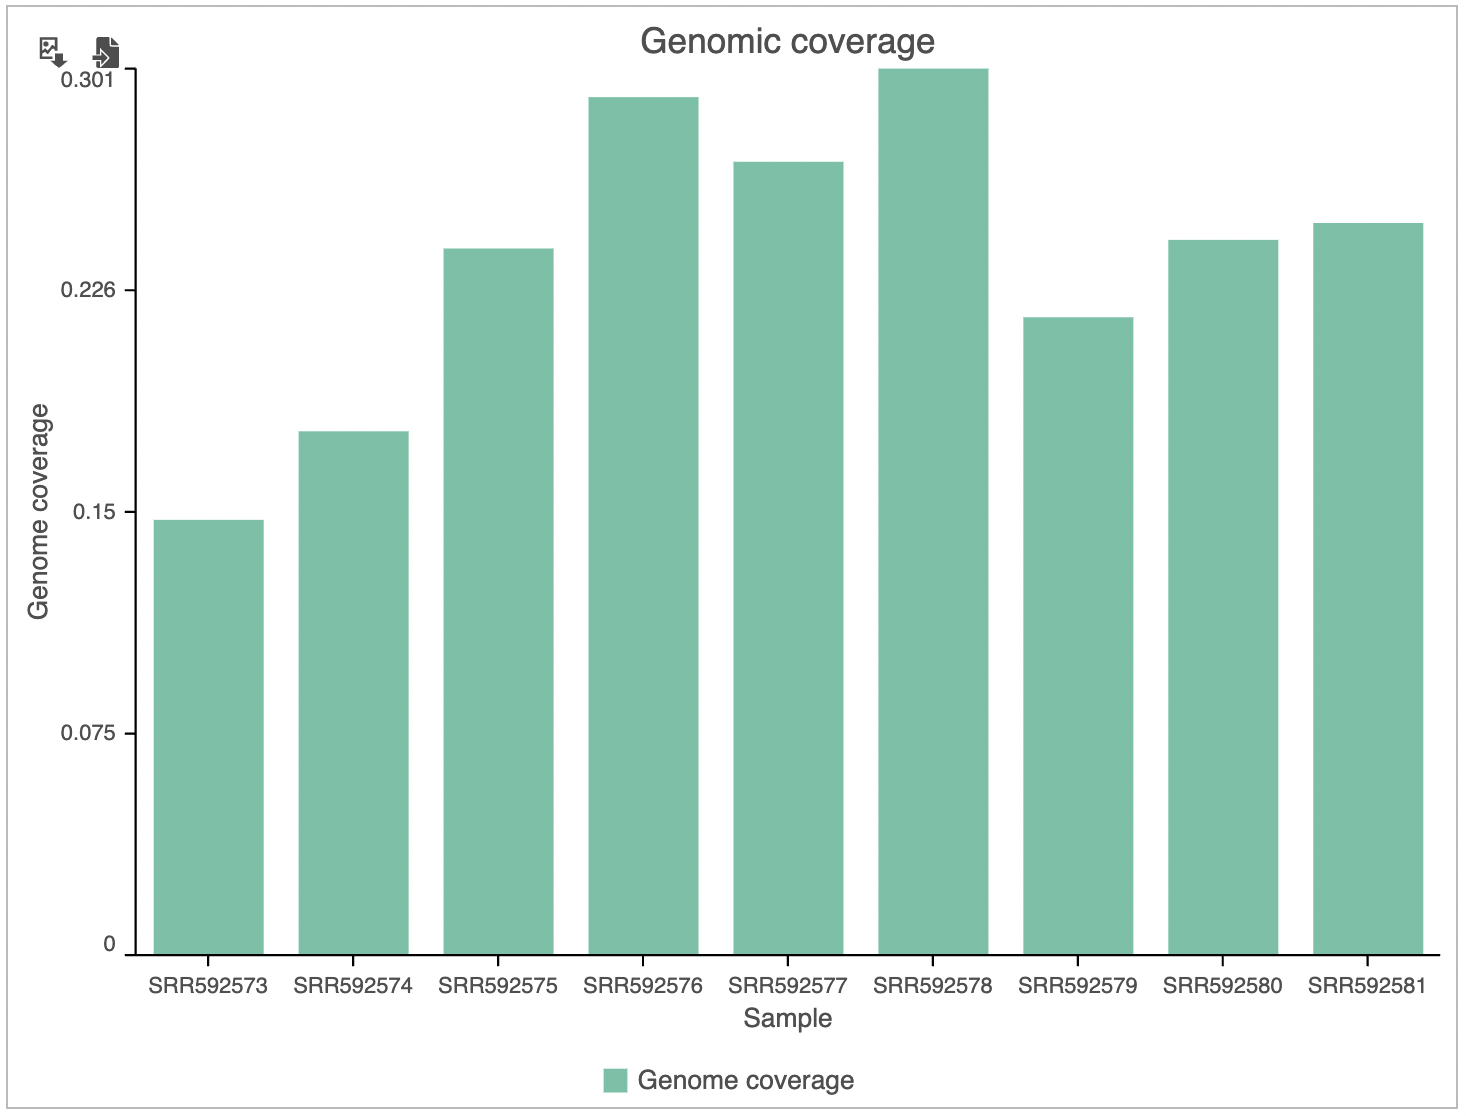
Figure 4. Coverage plot. Average read depth (times, in covered regions) is shown by columns and quantified on the left y-axis. Genome coverage (%) is shown by the black line and quantified on the right y-axis
The last graph is Average alignments per read (Figure 5) and shows the average number of alignments for each read, with samples as columns. For single-end data, the expected average alignments per read is one, while for paired-end data, the expected average alignments per read is two.
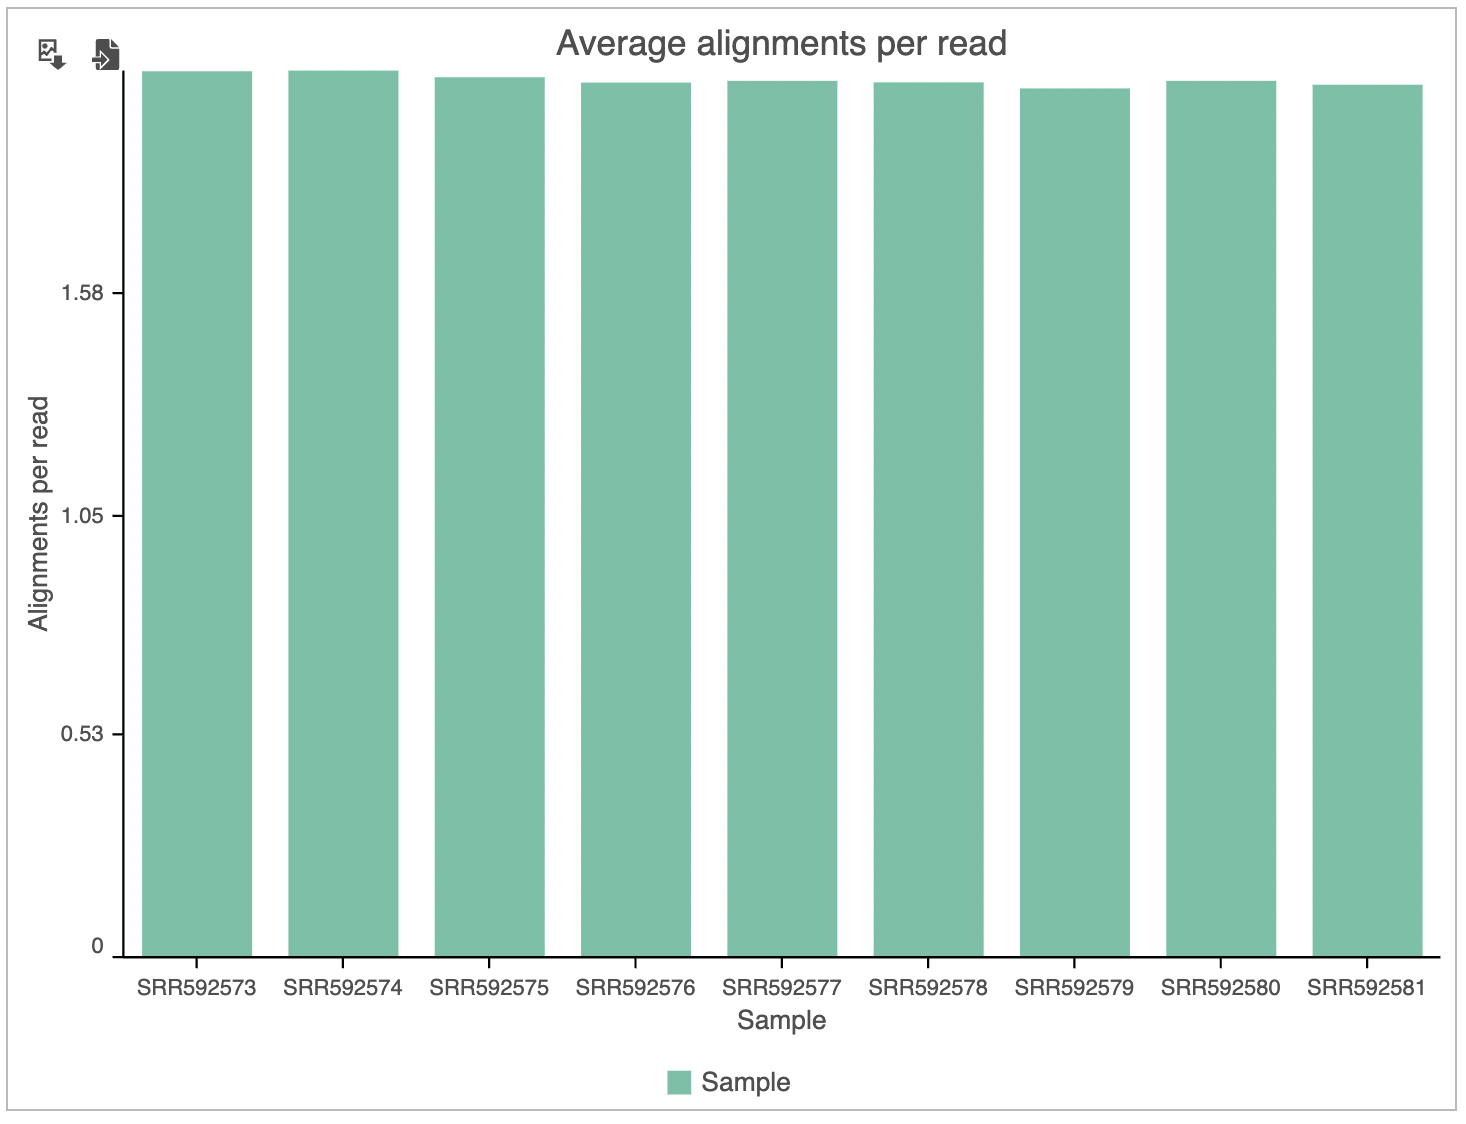
Figure 5. Average alignments per read. Each sample is a column, average number of alignments per read is on the y-axis
Additional Assistance
If you need additional assistance, please visit our support page to submit a help ticket or find phone numbers for regional support.


| Your Rating: |
|
Results: |

|
43 | rates |
Overview
Content Tools
1 Comment
Melissa del Rosario
author: ilukic