Pathway enrichment generates a results spreadsheet, Pathway-Enrichment.txt, visible in both Partek Genomics Suite (Figure 1) and in Partek Pathway.
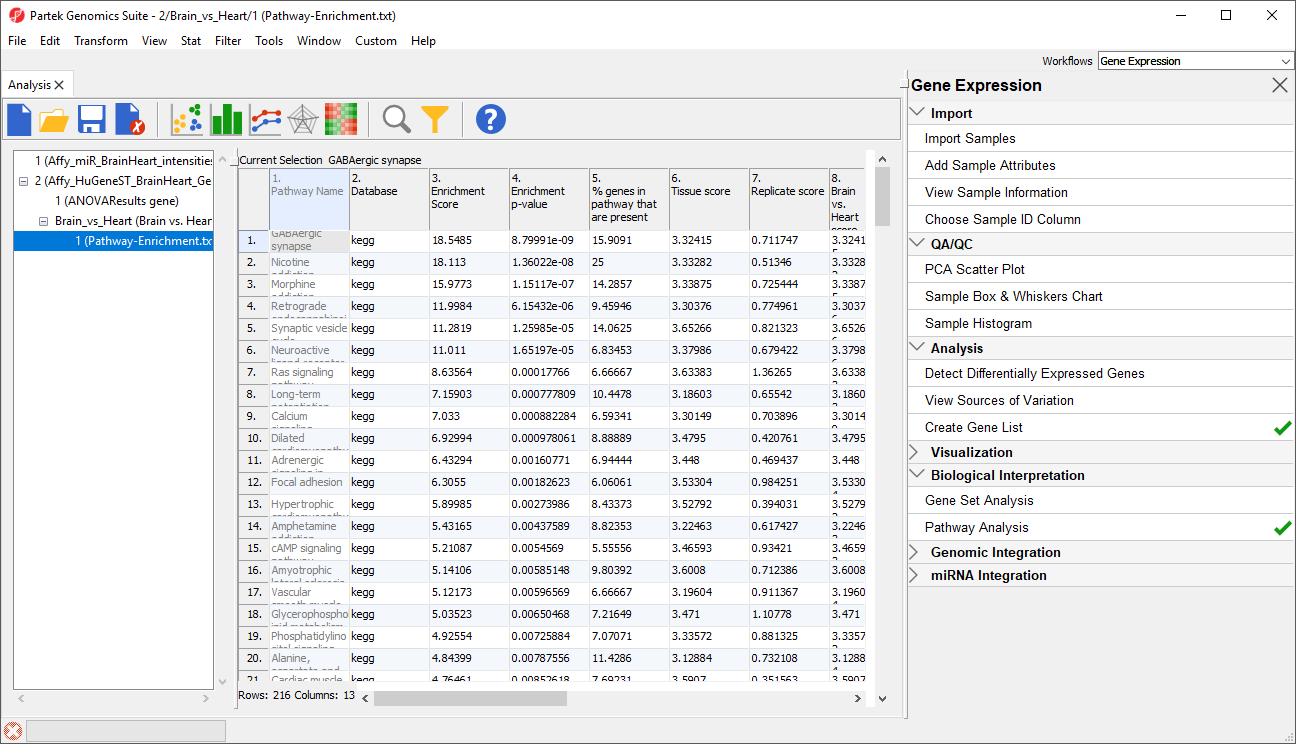
Figure 1. The pathway enrichment spreadsheet is visible in both Partek Genomics Suite (shown here) and Partek Pathway
Contents of the pathway enrichment spreadsheet
The spreadsheet includes 13 columns with information for each pathway represented in the source gene list.
1. Pathway Name - the name of the KEGG pathway
2. Database - the source database for the pathway annotation
3. Enrichment score - the negative natural log of the enrichment p-value derived from the contingency table (Fisher's Exact test) or the Chi-squared test
4. Enrichment p-value - the enrichment p-value derived from the contingency table (Fisher's Exact test) or the Chi-squared test
5. % genes in pathway that are present - the percentage of genes from the pathway that are present in the source gene list
6. Tissue score, 7. Replicate score, 8. Brain vs. Heart score - for each factor, interaction, and contrast in the ANVOA results spreadsheet, a separate score is calculated. This is derived form the negative log (base 10) of the average p-value for genes within the pathway for each factor. A high score indicates that the genes that fall into the pathway have a low p-value for the given factor.
9. # genes in list, in pathway - number of genes from the list in the pathway
10. # genes not in list, in pathway - number of genes from the pathway, not in the list
11. # genes in list, not in pathway - number of genes in list, not in the pathway
12. # genes, not in list, not in pathway - number of genes not in the pathway or the list that are included in KEGG database pathways for the species
13. Pathway ID - KEGG pathway ID
Tasks available in Partek Genomics Suite
In Partek Genomics Suite, we can view several new options that are available for each pathway (row) in the Pathway-Enrichment.txt spreadsheet.
- Right-click the row header of any row in the Pathway-Enrichment.txt spreadsheet (Figure 2)
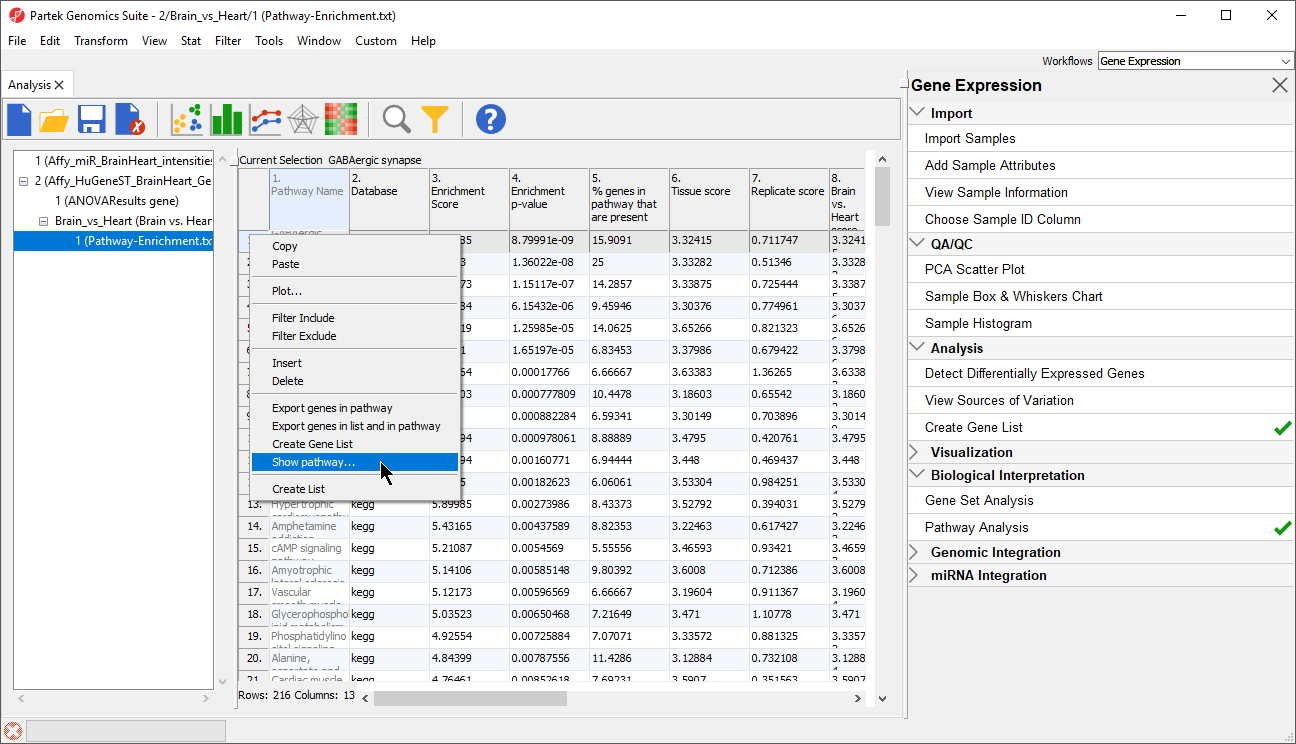
Figure 2. The Pathway-Enrichment.txt spreadsheet in Partek Genomics Suite
The new options include:
Export genes in pathway, which creates a child spreadsheet of Pathway-Enrichment.txt that contains all the genes from the selected pathway(s) (Figure 3). This new spreadsheet includes gene symbols and their pathway.
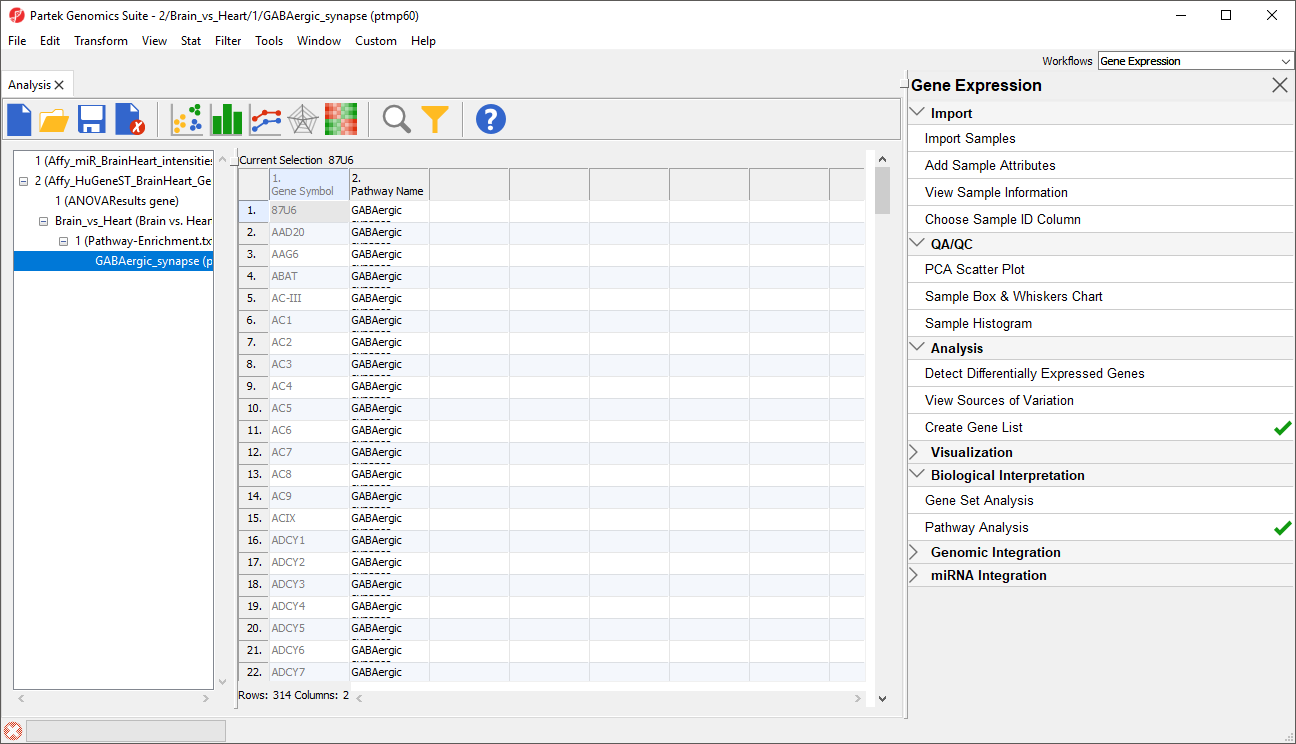 Figure 3. Spreadsheet with all genes in pathway. Includes gene symbols and pathway.
Export genes in list and in pathway, which creates a child spreadsheet of Pathway-Enrichment.txt that contains the genes from your list that are present in the selected pathway(s) (Figure 4). This new spreadsheet includes gene symbols and their pathway.
Figure 3. Spreadsheet with all genes in pathway. Includes gene symbols and pathway.
Export genes in list and in pathway, which creates a child spreadsheet of Pathway-Enrichment.txt that contains the genes from your list that are present in the selected pathway(s) (Figure 4). This new spreadsheet includes gene symbols and their pathway.
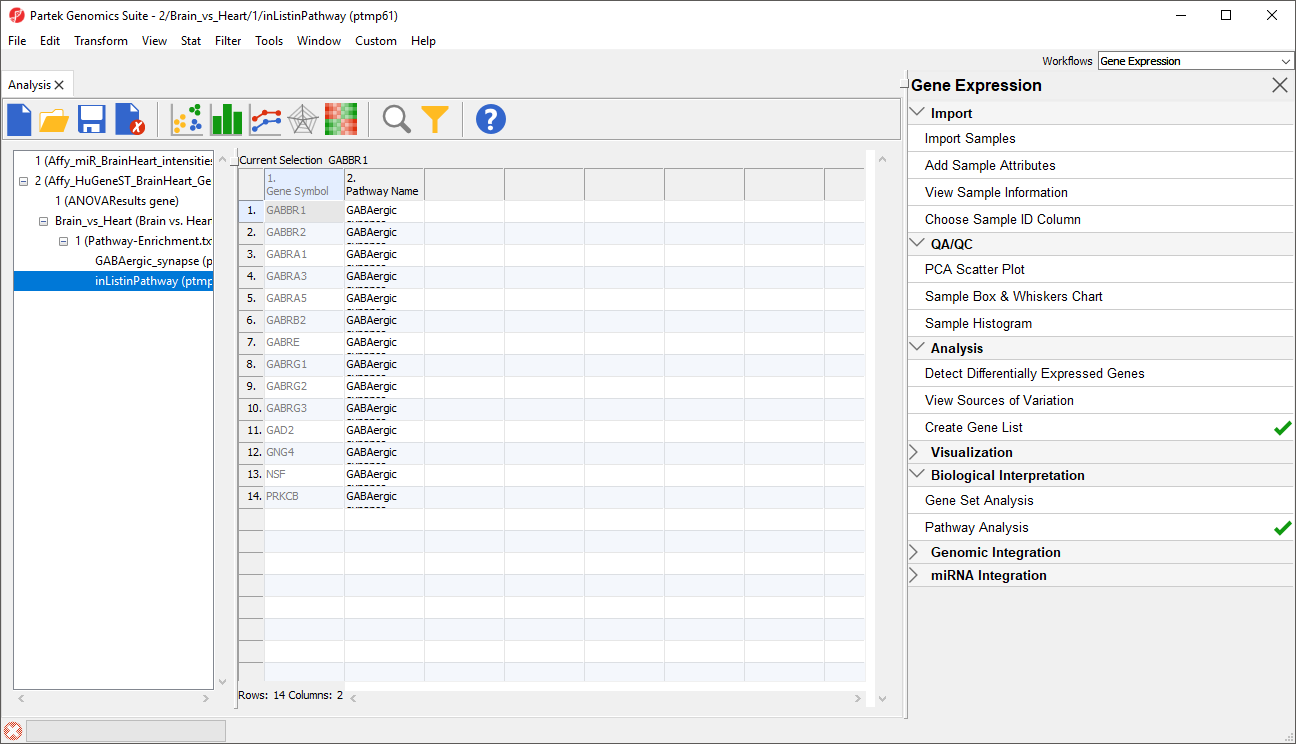 Figure 4. Spreadsheet with genes only in list and pathway. Includes gene symbols and pathway.
Create Gene List, which creates a new child spreadsheet of the ANOVA results spreadsheet that contains the genes from your list that are present in the selected pathway(s) (Figure 5). This new spreadsheet includes all information for each gene from the ANOVA results spreadsheet. However, this list does not indicate the pathway of each gene.
Figure 4. Spreadsheet with genes only in list and pathway. Includes gene symbols and pathway.
Create Gene List, which creates a new child spreadsheet of the ANOVA results spreadsheet that contains the genes from your list that are present in the selected pathway(s) (Figure 5). This new spreadsheet includes all information for each gene from the ANOVA results spreadsheet. However, this list does not indicate the pathway of each gene.
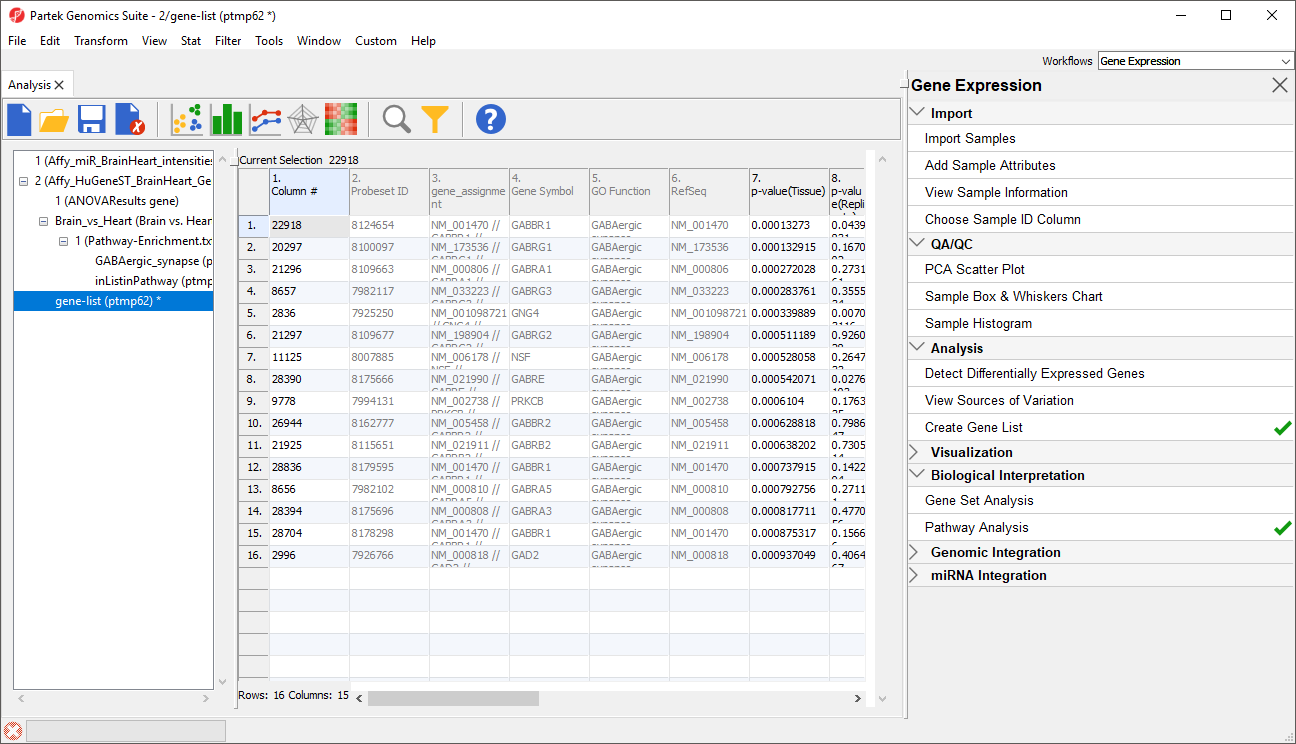 Figure 5. Spreadsheet with genes in list and pathway. Includes all information from ANOVA results for each gene.
Show Pathway, which opens the selected pathway map in Partek Pathway.
Figure 5. Spreadsheet with genes in list and pathway. Includes all information from ANOVA results for each gene.
Show Pathway, which opens the selected pathway map in Partek Pathway.
Additional Assistance
If you need additional assistance, please visit our support page to submit a help ticket or find phone numbers for regional support.


| Your Rating: |
|
Results: |

|
40 | rates |
Overview
Content Tools