To detect differential methylation between CpG loci in different experimental groups, we can perform an ANOVA test. For this tutorial, we will perform a simple two-way ANOVA to compare the methylation states of the two experimental groups.
- Select Detect Differential Methylation from the Analysis section of the Illumina BeadArray Methylation workflow
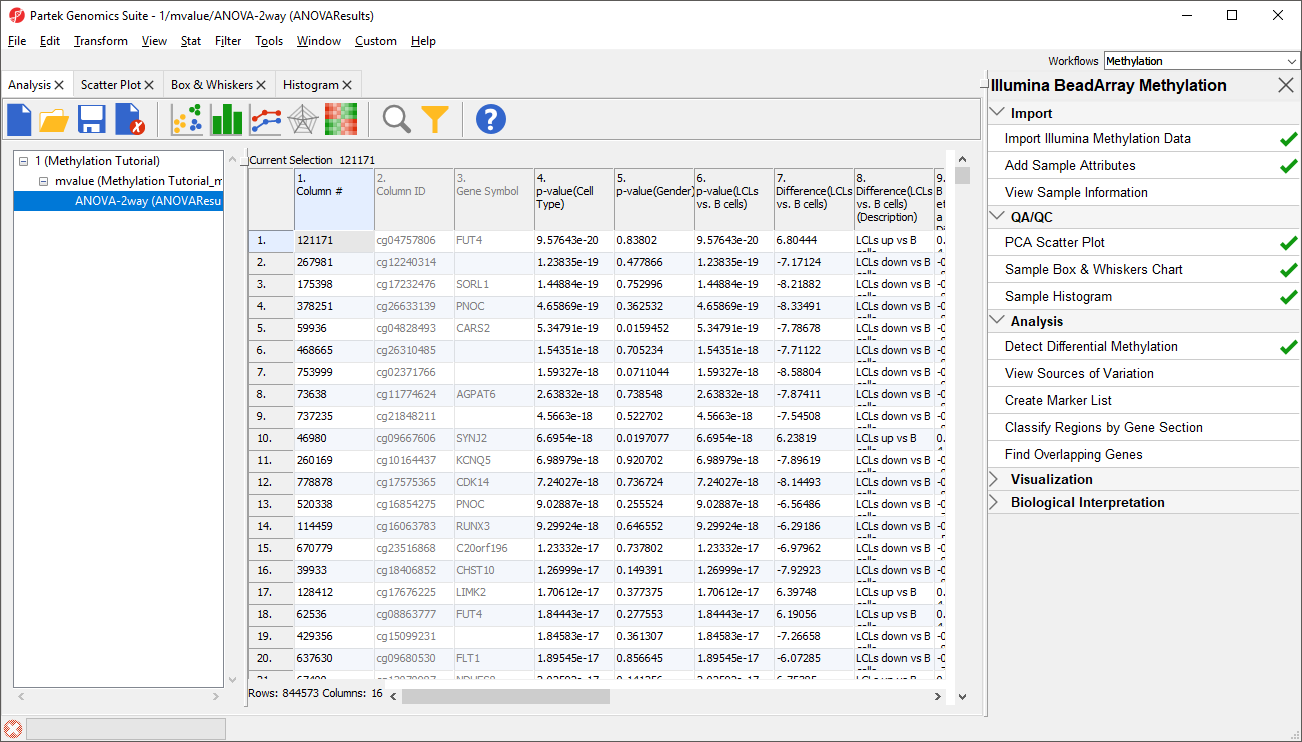
A new child spreadsheet, mvalue, is created when Detect Differential Methylation is selected. M-values are an alternative metric for measuring methylation. β-values can be easily converted to M-values using the following equation: M-value = log2( β / (1 - β)).
An M-value close to 0 for a CpG site indicates a similar intensity between the methylated and unmethylated probes, which means the CpG site is about half-methylated. Positive M-values mean that more molecules are methylated than unmethylated, while negative M-values mean that more molecules are unmethylated than methylated. As discussed by Du and colleagues, the β-value has a more intuitive biological interpretation, but the M-value is more statistically valid for the differential analysis of methylation levels.
Because we are performing differential methylation analysis, Partek Genomics Suite automatically creates an M-values spreadsheet to use for statistical analysis.
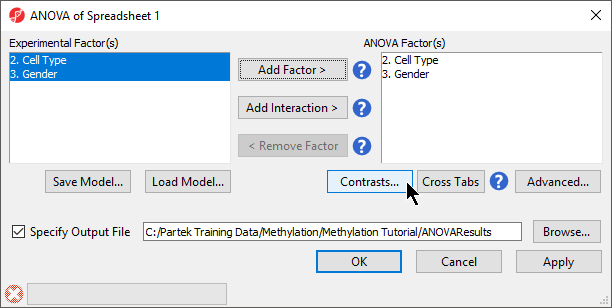
- Select 2. Cell Type and 3. Gender from the Experimental Factor(s) panel
- Select Add Factor > to move 2. Cell Type and 3. Gender to the ANOVA Factor(s) panel (Figure 1)
- Select Contrasts...
- Leave Data is already log transformed? set to No
- Leave Report comparisons as set to Difference
For methylation data, fold-change comparisons are not appropriate. Instead, comparisons should be reported as the difference between groups.
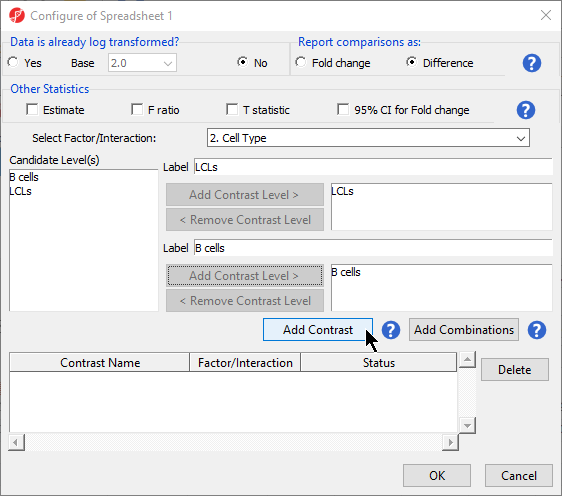
- Select 2. Cell Type from the Select Factor/Interaction drop-down menu
- Select LCLs
- Select Add Contrast Level > for the upper group
- Select B cells
- Select Add Contrast Level > for the lower group
- Select Add Contrast (Figure 2)
- Select OK to close the Configuration dialog
The Contrasts... button of the ANOVA dialog now reads Contrasts Included
- Select OK to close the ANOVA dialog and run the ANOVA
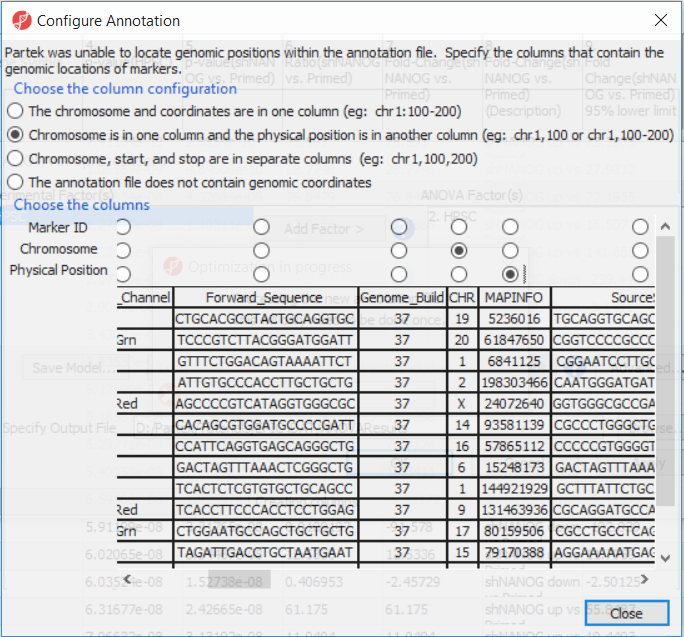
If this is the first time you have analyzed a MethylationEPIC array using the Partek Genomics Suite software, the manifest file may need to be configured. If it needs configuration, the Configure Annotation dialog will appear (Figure 3).
- Select Chromosome is in one column and the physical location is in another column for Choose the column configuration
- Select Ilmn ID for Marker ID
- Select CHR for Chromosome i
- Select MAPINFO for Physical Position
- Select Close
This enables Partek Genomics Suite to parse out probe annotations from the manifest file.
Additional Assistance
If you need additional assistance, please visit our support page to submit a help ticket or find phone numbers for regional support.


| Your Rating: |
    
|
Results: |
    
|
33 | rates |


