| Name
|
Size
|
Creator |
Creation Date
|
Last Modification Date
|
Labels |
Attached To |
|
PNG File Screenshot 2023-09-25 at 10.01.32.png |
304 kB |
Matteo Luberti |
Sep 25, 2023 04:13 |
Sep 25, 2023 04:13 |
|
Page: Differentially Expressed Proteins and Genes
|
|
PNG File Screenshot 2023-01-10 at 15.05.03.png |
303 kB |
Matteo Luberti |
Jan 10, 2023 09:05 |
Jan 10, 2023 09:05 |
|
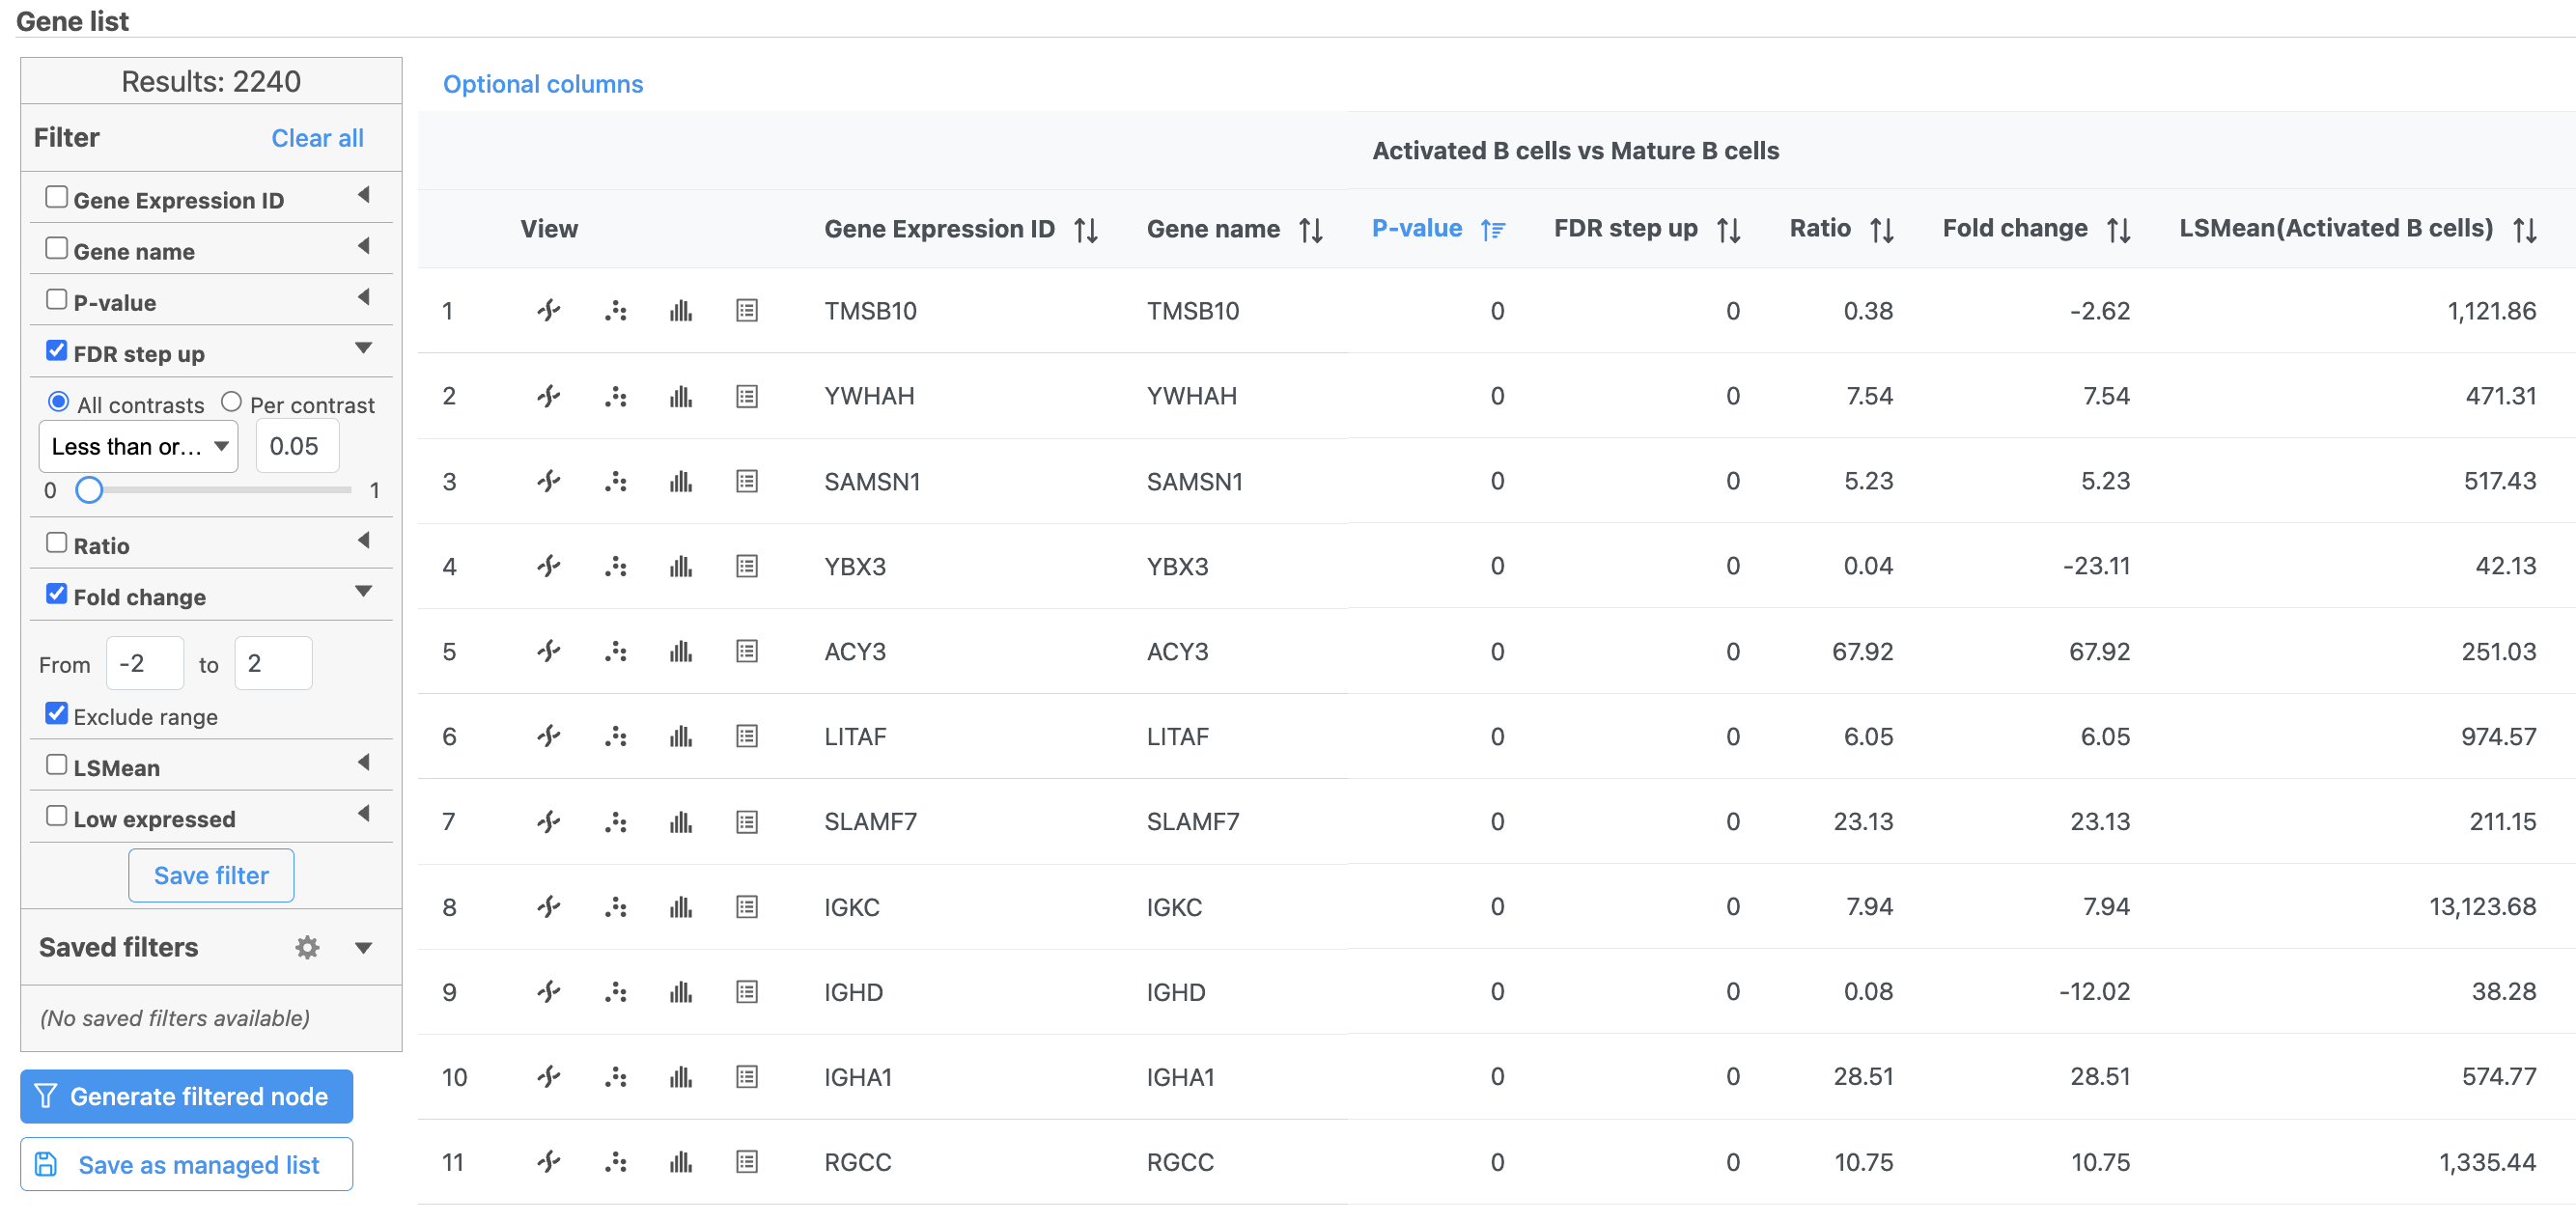
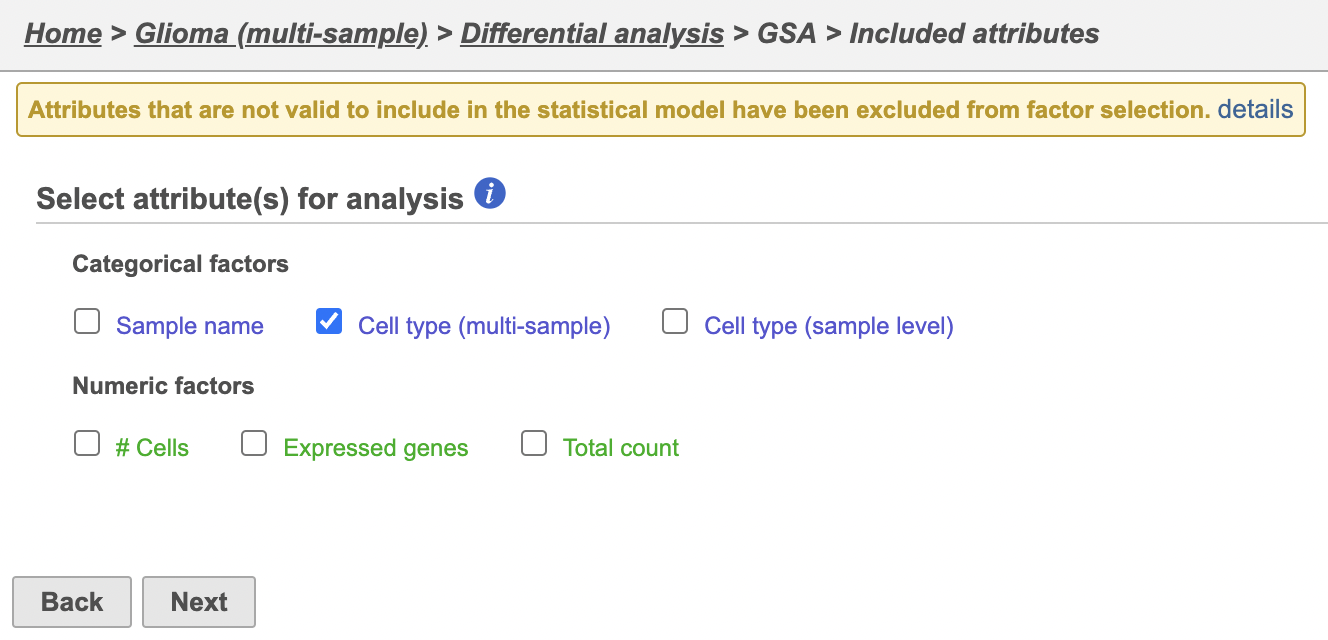
Page: Compare expression between cell types with multiple samples
|
|
PNG File Screenshot 2023-01-10 at 15.05.03.png |
303 kB |
Alex Rutkovsky |
Jul 12, 2023 07:39 |
Jul 12, 2023 07:39 |
|
Page: Make comparisons using Compute biomarkers and Biological interpretation
|
|
PNG File Screenshot 2023-01-10 at 15.05.03.png |
303 kB |
Alex Rutkovsky |
Jul 07, 2023 11:29 |
Jul 07, 2023 11:29 |
|
Page: Spatial data analysis steps
|
|
PNG File heatmap for range.PNG |
302 kB |
Alex Rutkovsky |
Apr 25, 2022 12:20 |
Apr 25, 2022 12:20 |
|
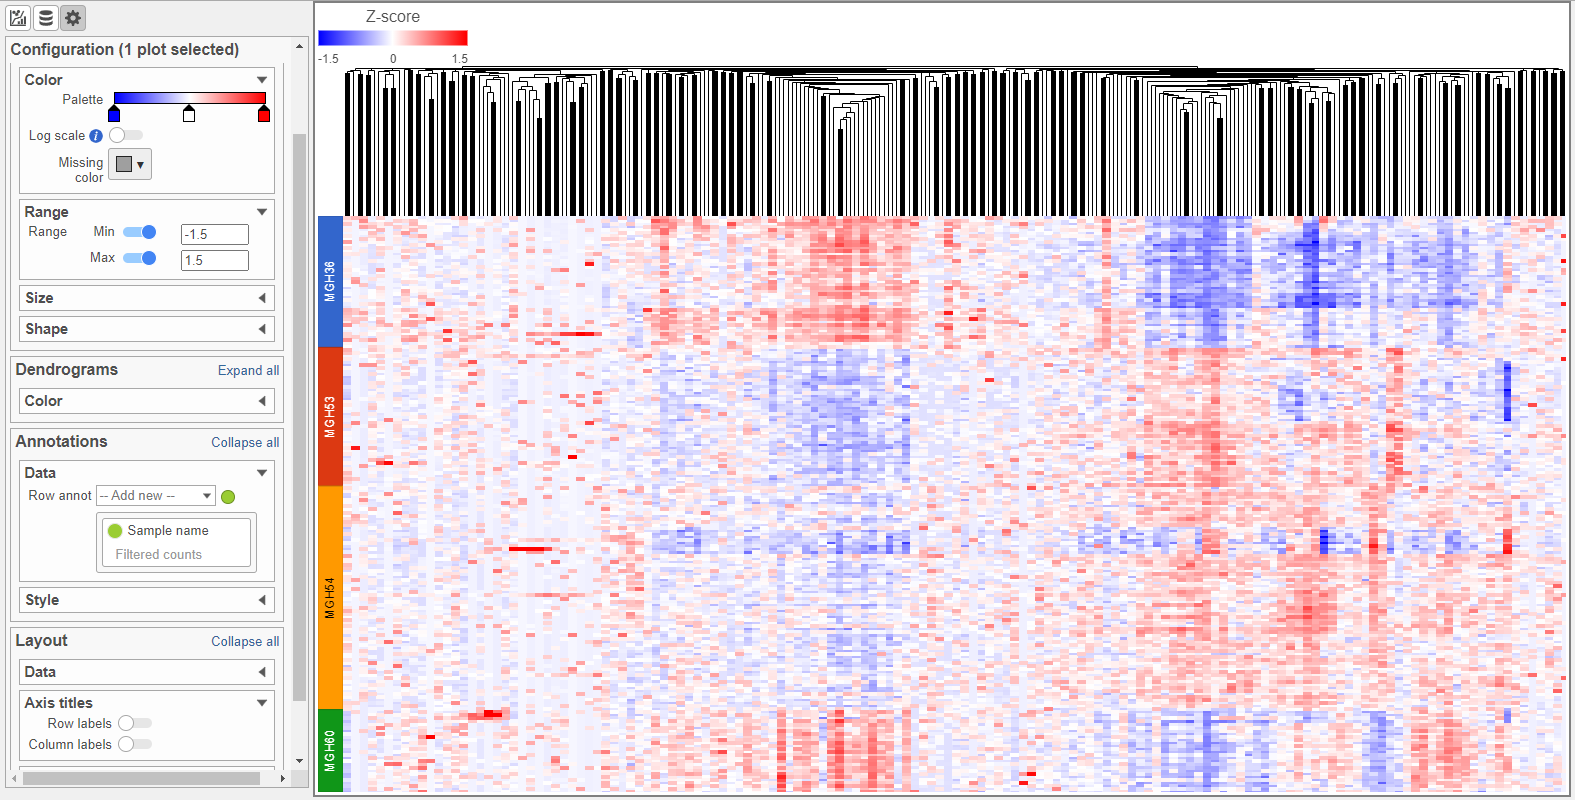
Page: Compare expression between cell types with multiple samples
|
|
PNG File heatmap for range.PNG |
302 kB |
Alex Rutkovsky |
Jul 12, 2023 07:39 |
Jul 12, 2023 07:39 |
|
Page: Make comparisons using Compute biomarkers and Biological interpretation
|
|
PNG File heatmap for range.PNG |
302 kB |
Alex Rutkovsky |
Jul 07, 2023 11:29 |
Jul 07, 2023 11:29 |
|
Page: Spatial data analysis steps
|
|
PNG File audit_trail_video.png |
299 kB |
Melissa del Rosario |
Oct 05, 2016 12:01 |
Oct 05, 2016 12:01 |
|
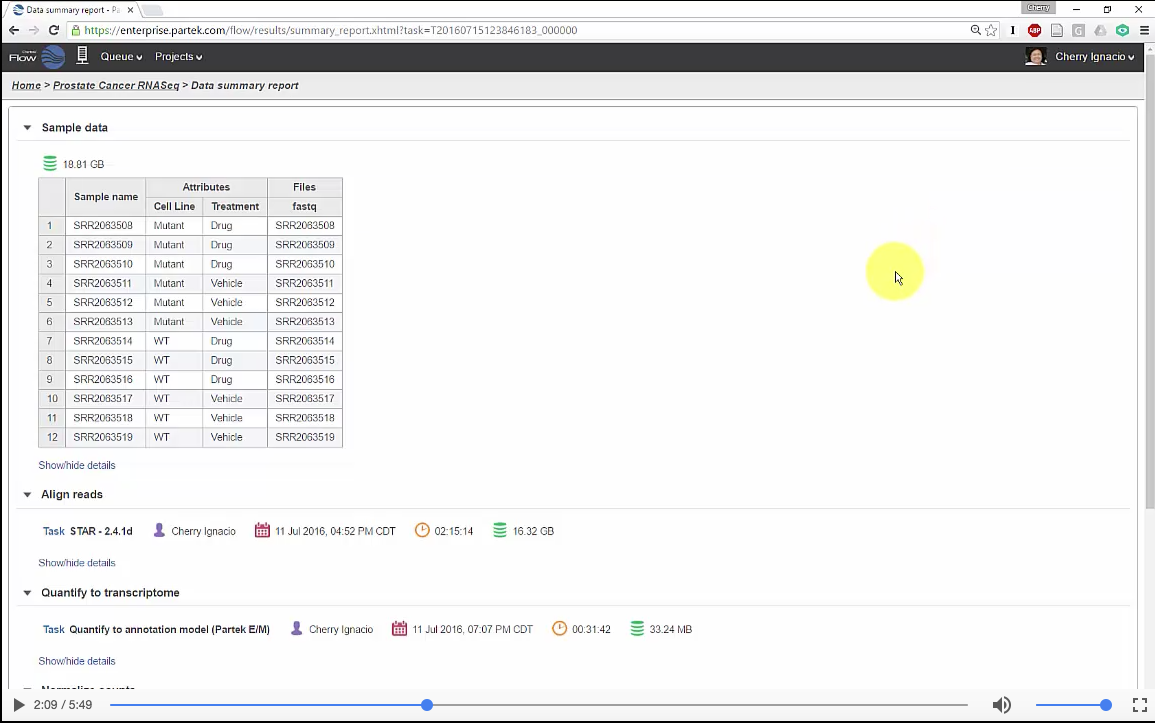
Page: Data summary report
|
|
PNG File Screenshot 2022-12-21 at 18.46.36.png |
299 kB |
Matteo Luberti |
Dec 21, 2022 12:46 |
Dec 21, 2022 12:46 |
|
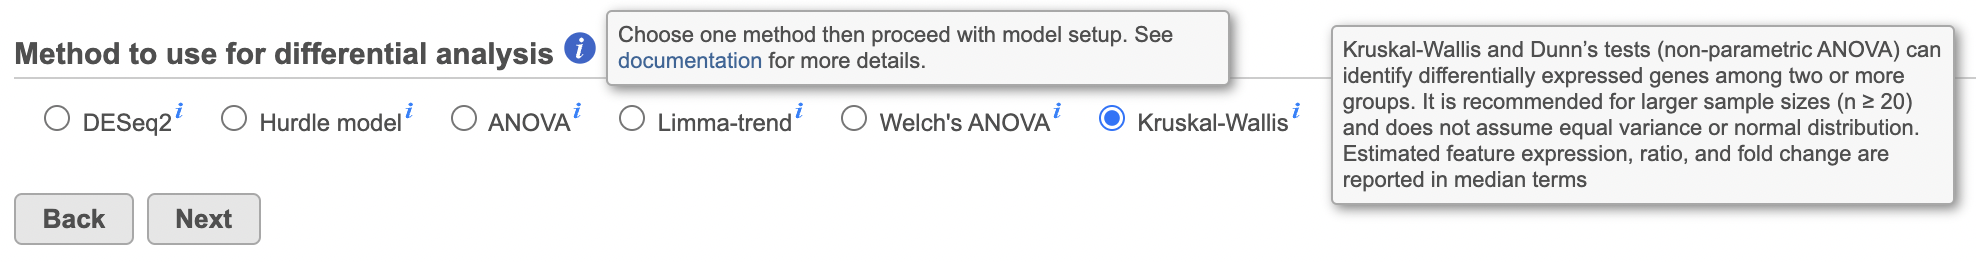
Page: Kruskal-Wallis
|
|
PNG File image2019-5-15 14:32:27.png |
299 kB |
Paul Fullerton |
May 15, 2019 14:32 |
May 15, 2019 14:32 |
|
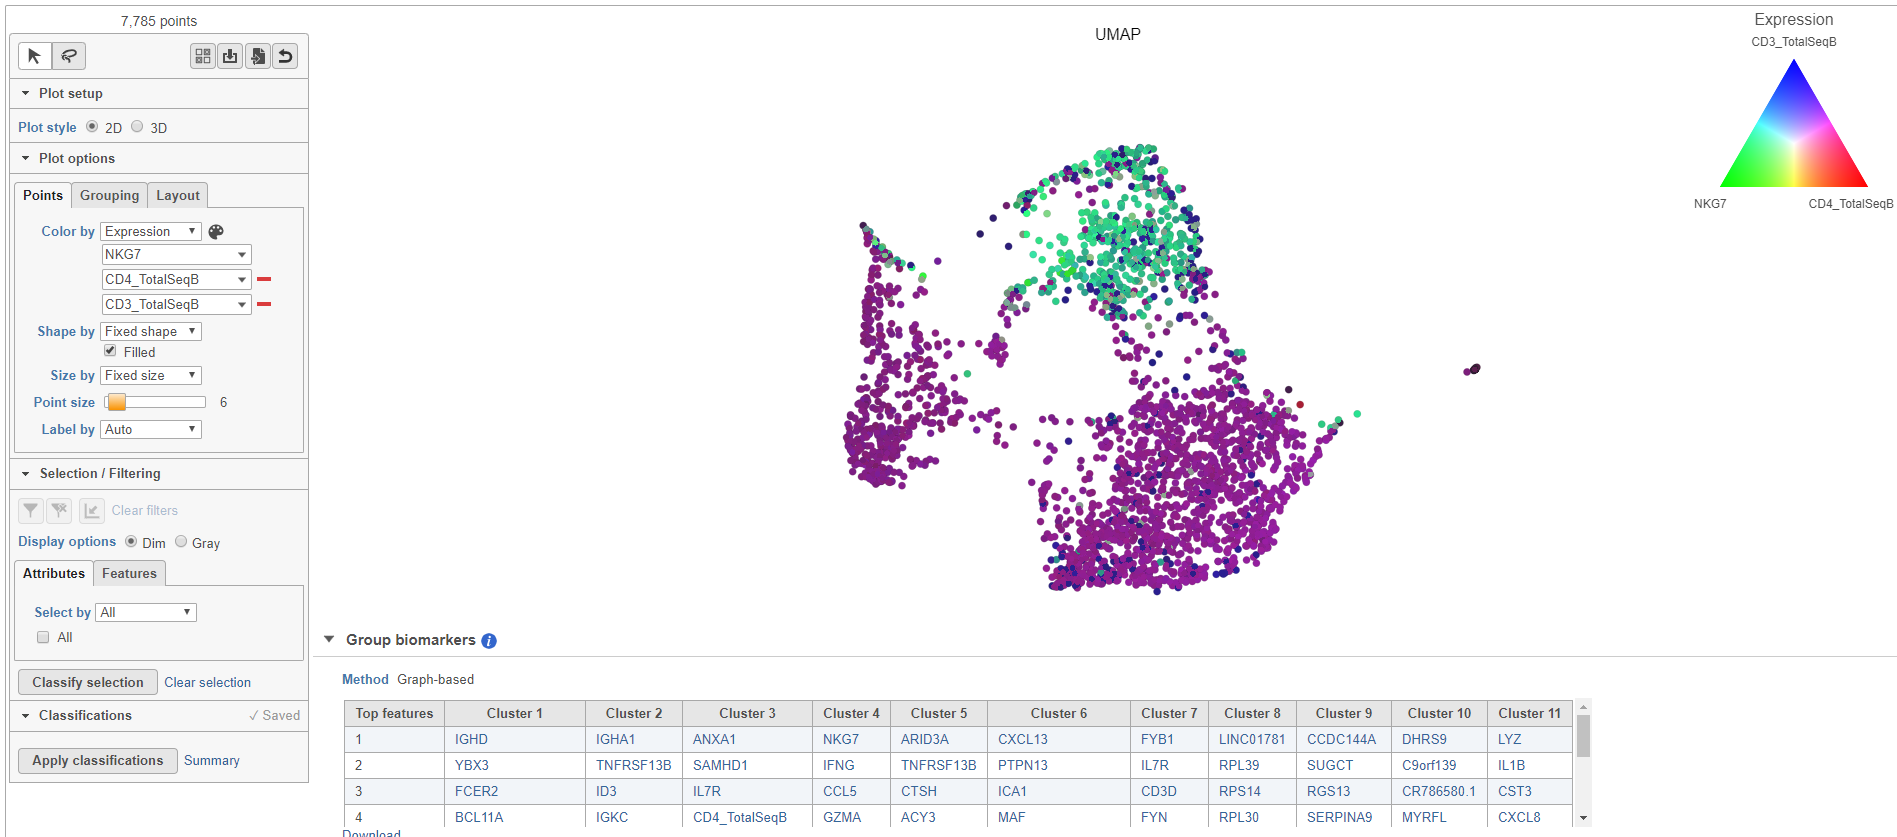
Page: Analyzing CITE-Seq Data
|
|
PNG File Screenshot 2023-09-25 at 10.24.20.png |
298 kB |
Matteo Luberti |
Sep 25, 2023 04:24 |
Sep 25, 2023 04:24 |
|
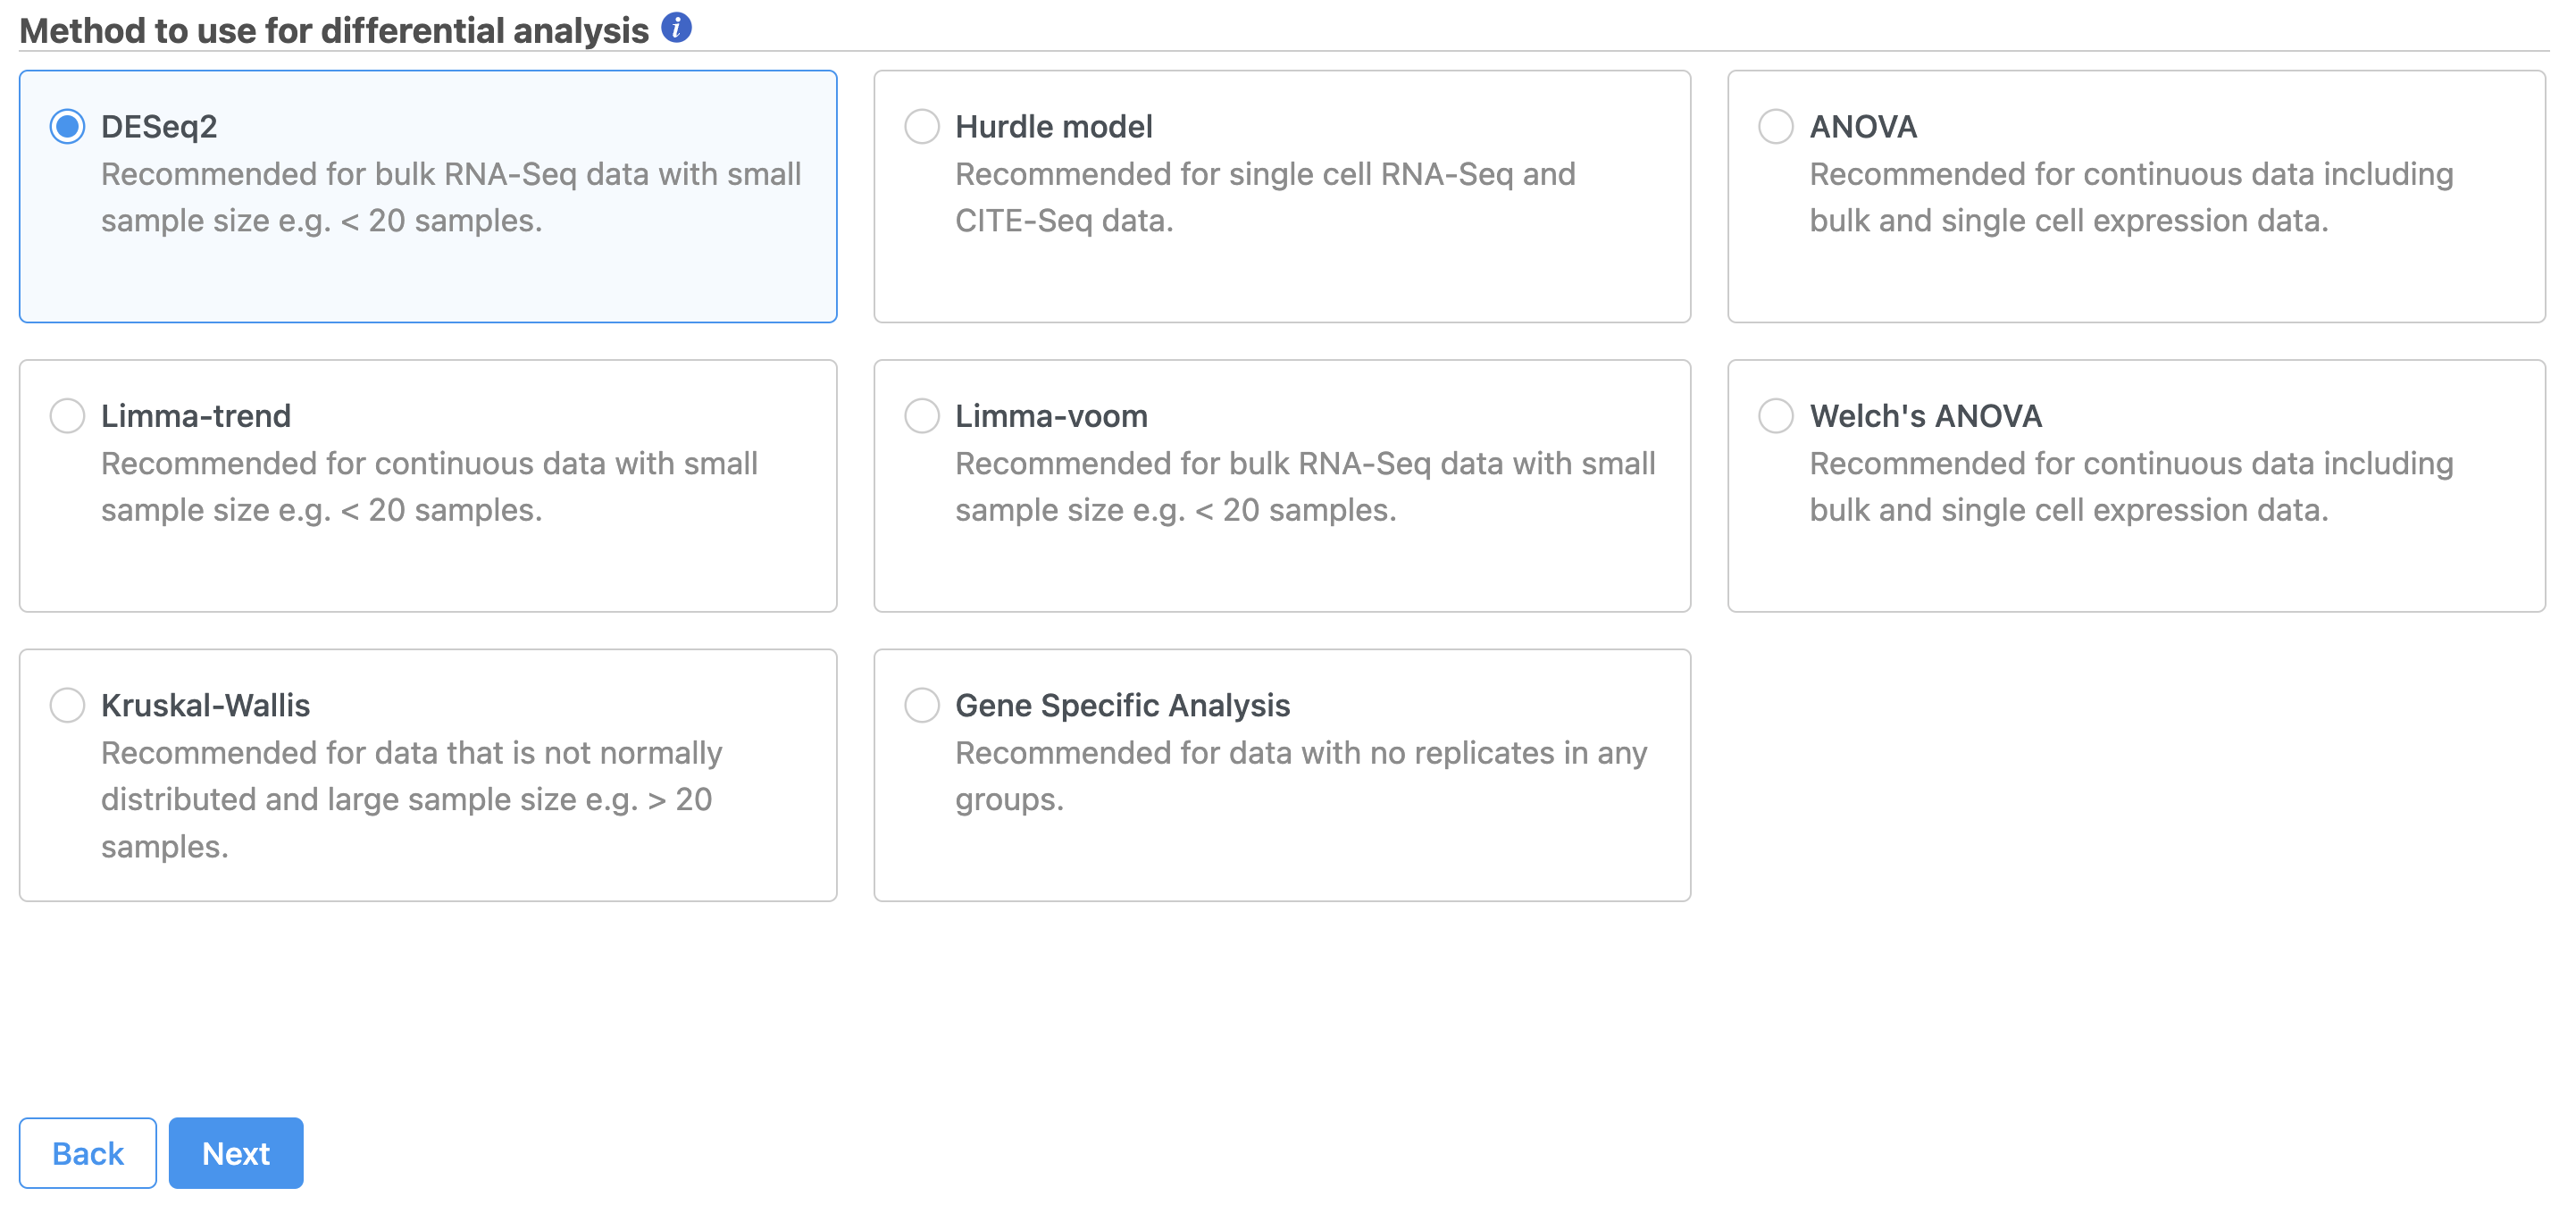
Page: Performing differential expression analysis with DESeq2
|
|
PNG File 2D3Dtsne.png |
297 kB |
admin |
Oct 17, 2017 08:23 |
Oct 17, 2017 08:23 |
|
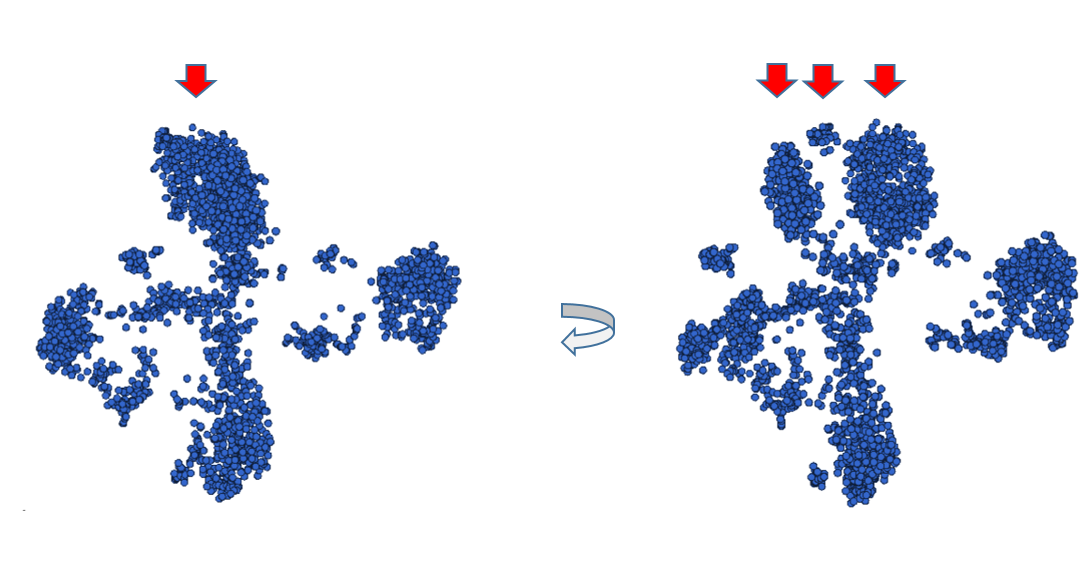
Page: Webinars
|
|
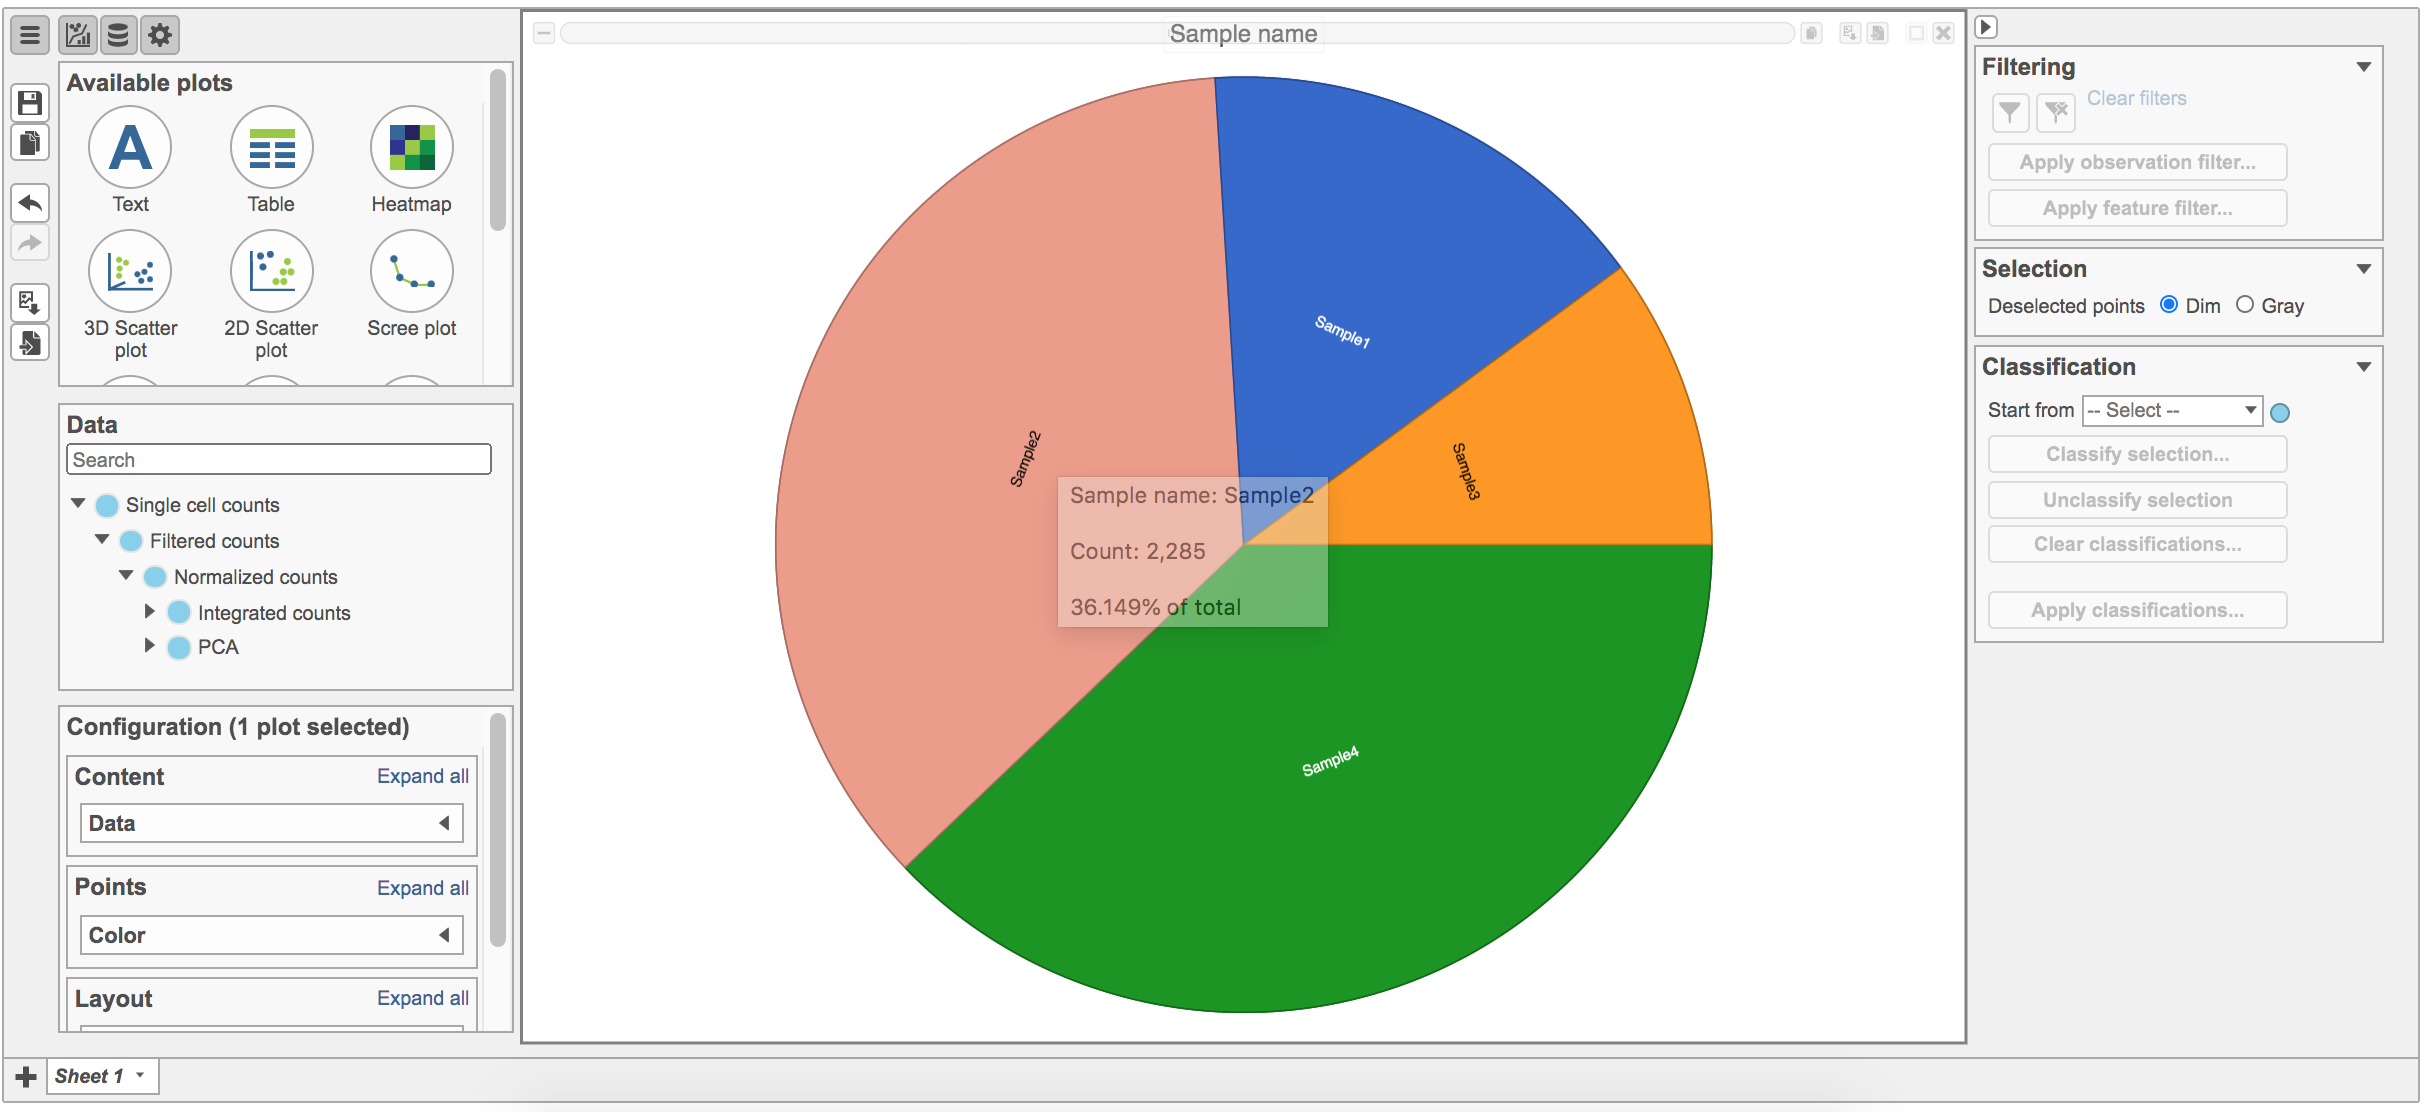
PNG File Fig5_The mouseover Pie chart.png |
297 kB |
Uchenna Emechebe |
Mar 06, 2021 10:04 |
Mar 06, 2021 10:04 |
|
Page: Histograms
|
|
PNG File Fig5_The mouseover Pie chart.png |
297 kB |
Zhengbin Liu |
Jan 06, 2021 10:48 |
Jan 06, 2021 10:48 |
|
Page: Pie Chart
|
|
PNG File Screenshot 2023-10-30 at 13.45.34.png |
296 kB |
Matteo Luberti |
Oct 30, 2023 07:48 |
Oct 30, 2023 07:48 |
|
Page: Data summary report
|
|
PNG File image2018-2-15 10:38:46.png |
295 kB |
Paul Fullerton |
Feb 15, 2018 10:38 |
Feb 15, 2018 10:38 |
|
Page: Getting started with the tutorial data set
|
|
PNG File image2018-2-15 10:38:46.png |
295 kB |
Alex Rutkovsky |
Jul 07, 2023 11:29 |
Jul 07, 2023 11:29 |
|
Page: Start with pre-processed Space Ranger output files
|
|
PNG File image2018-2-15 10:38:46.png |
295 kB |
Alex Rutkovsky |
Jul 12, 2023 07:38 |
Jul 12, 2023 07:38 |
|
Page: Import 10x Genomics Xenium Analyzer output
|
|
PNG File Screen Shot 2022-02-28 at 3.44.29 PM.png |
295 kB |
Zhengbin Liu |
Feb 28, 2022 15:44 |
Feb 28, 2022 15:44 |
|
Page: Cell Ranger - ATAC
|
|
PNG File Screen Shot 2022-02-28 at 3.44.29 PM.png |
295 kB |
Zhengbin Liu |
Dec 12, 2023 14:39 |
Dec 12, 2023 14:39 |
|
Page: STARsolo
|