| Name
|
Size
|
Creator |
Creation Date
|
Last Modification Date
|
Labels |
Attached To |
|
PNG File image2018-2-15 12:0:50.png |
101 kB |
Alex Rutkovsky |
Jul 12, 2023 07:38 |
Jul 12, 2023 07:38 |
|
Page: Process Xenium data
|
|
PNG File image2018-2-15 12:0:50.png |
101 kB |
Alex Rutkovsky |
Jul 07, 2023 11:29 |
Jul 07, 2023 11:29 |
|
Page: Start with 10x Genomics Visium fastq files
|
|
PNG File image2017-12-29 12:46:8.png |
101 kB |
Paul Fullerton |
Dec 29, 2017 12:45 |
Dec 29, 2017 12:45 |
|
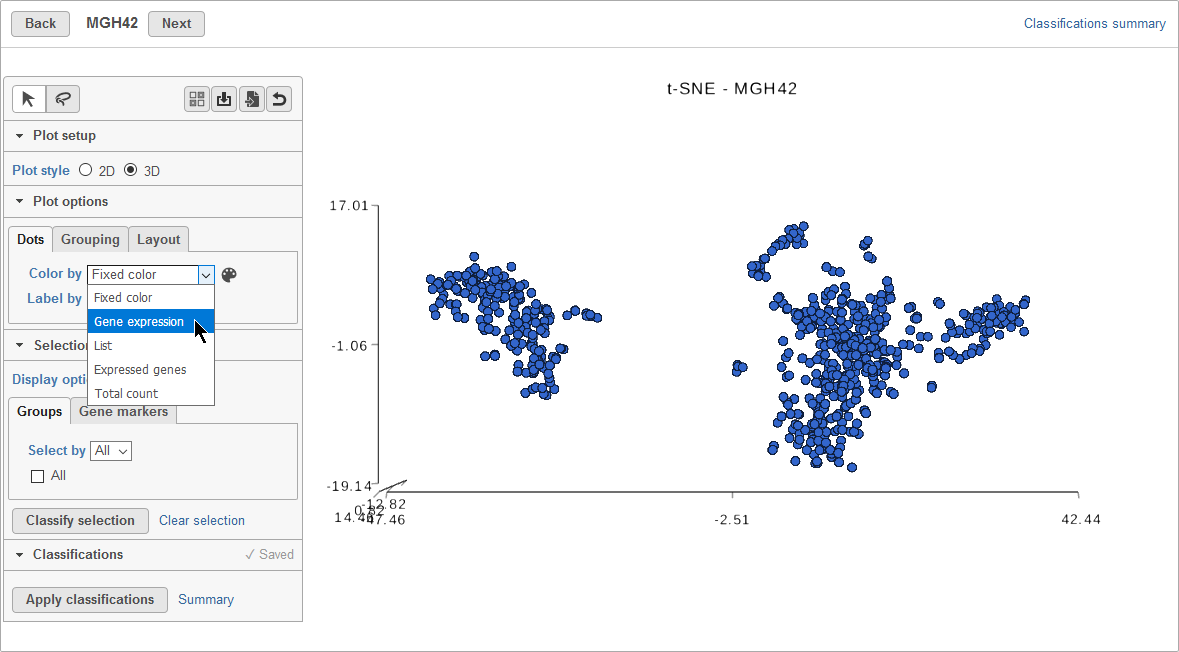
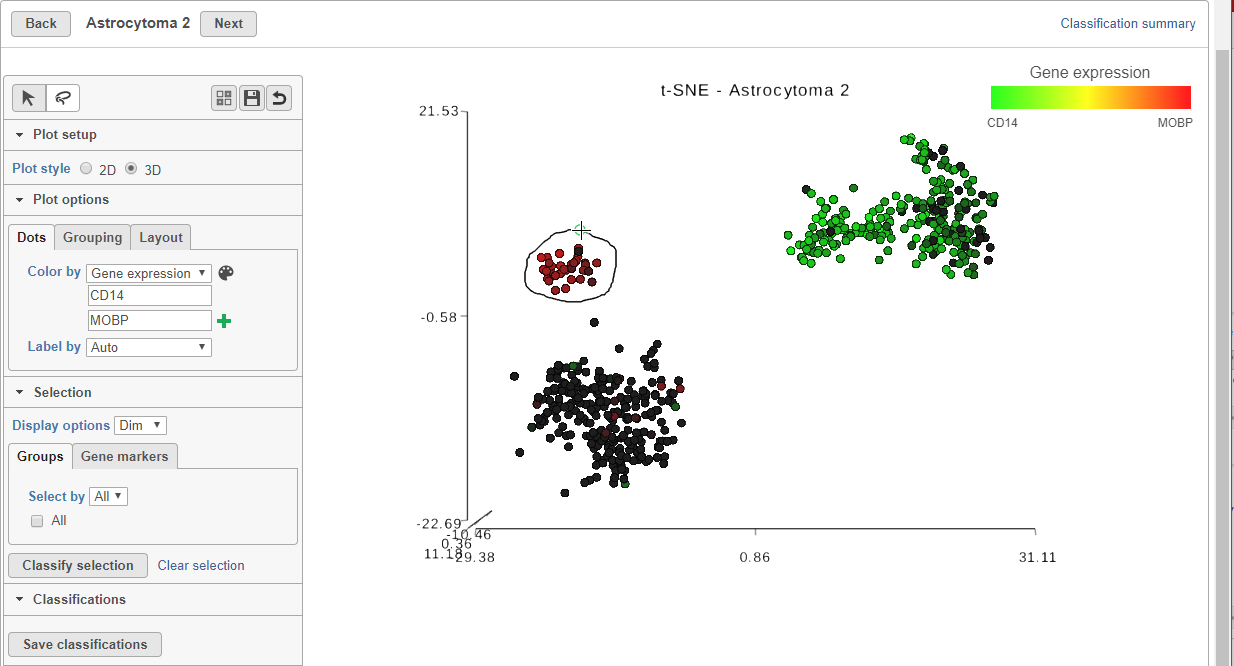
Page: Classify cells from multiple samples using t-SNE
|
|
PNG File image2017-12-29 12:46:8.png |
101 kB |
Alex Rutkovsky |
Jul 12, 2023 07:38 |
Jul 12, 2023 07:38 |
|
Page: Process Xenium data
|
|
PNG File image2017-12-29 12:46:8.png |
101 kB |
Alex Rutkovsky |
Jul 07, 2023 11:29 |
Jul 07, 2023 11:29 |
|
Page: Start with 10x Genomics Visium fastq files
|
|
PNG File image2018-2-16 13:14:4.png |
101 kB |
Paul Fullerton |
Feb 16, 2018 13:14 |
Feb 16, 2018 13:14 |
|
Page: Compare expression between cell types with multiple samples
|
|
PNG File image2018-2-16 13:14:4.png |
101 kB |
Alex Rutkovsky |
Jul 12, 2023 07:38 |
Jul 12, 2023 07:38 |
|
Page: Make comparisons using Compute biomarkers and Biological interpretation
|
|
PNG File image2018-2-16 13:14:4.png |
101 kB |
Alex Rutkovsky |
Jul 07, 2023 11:29 |
Jul 07, 2023 11:29 |
|
Page: Spatial data analysis steps
|
|
PNG File image2019-7-25_10-46-54.png |
101 kB |
Paul Fullerton |
Jul 25, 2019 10:46 |
Jul 25, 2019 10:46 |
|
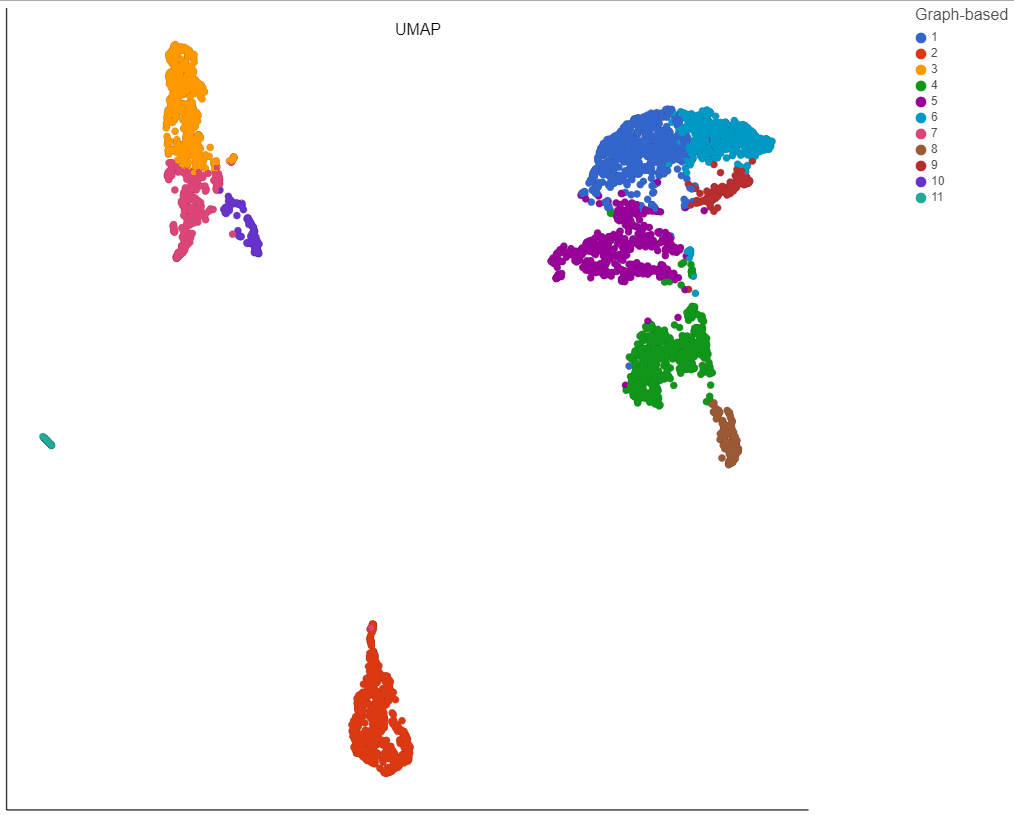
Page: UMAP
|
|
PNG File image2017-12-28 13:9:4.png |
101 kB |
Paul Fullerton |
Dec 28, 2017 13:08 |
Dec 28, 2017 13:08 |
|
Page: Classify cells from multiple samples using t-SNE
|
|
PNG File image2017-12-28 13:9:4.png |
101 kB |
Alex Rutkovsky |
Jul 12, 2023 07:38 |
Jul 12, 2023 07:38 |
|
Page: Process Xenium data
|
|
PNG File image2017-12-28 13:9:4.png |
101 kB |
Alex Rutkovsky |
Jul 07, 2023 11:29 |
Jul 07, 2023 11:29 |
|
Page: Start with 10x Genomics Visium fastq files
|
|
PNG File image2020-12-9_9-33-58.png |
101 kB |
Xiaowen Wang |
Dec 09, 2020 09:33 |
Dec 09, 2020 09:33 |
|
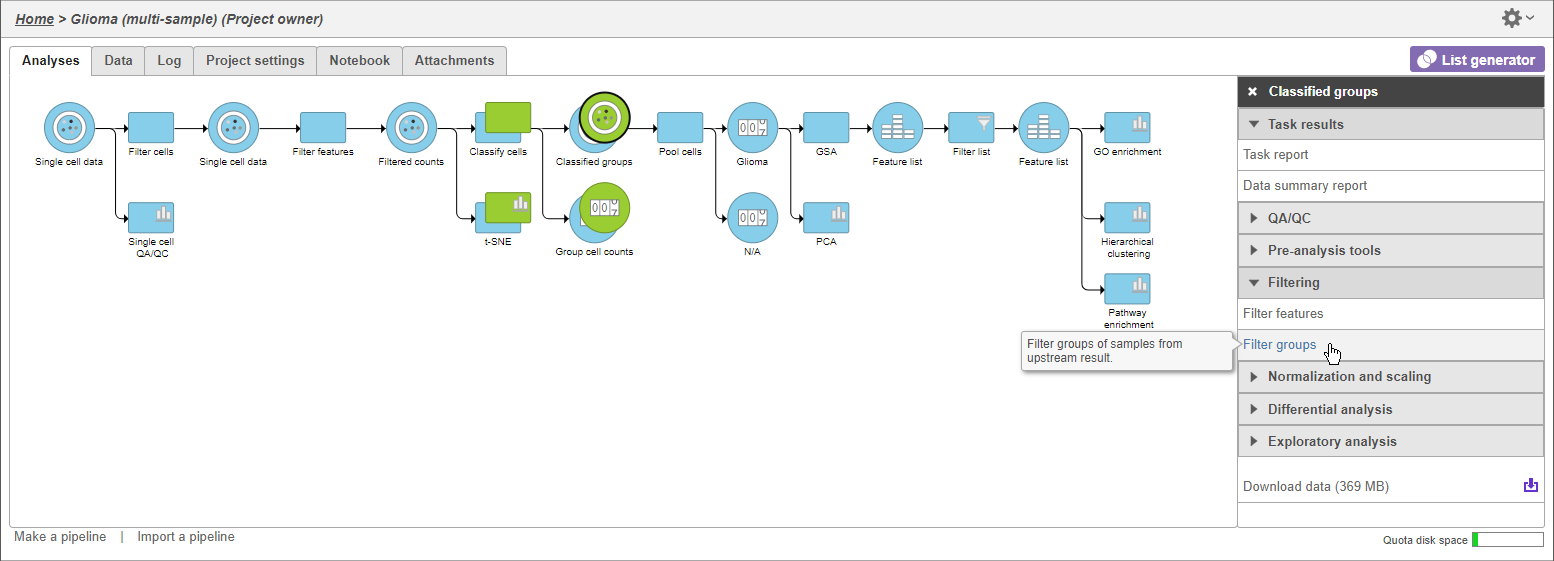
Page: Hierarchical Clustering
|
|
PNG File image2018-3-21 14:10:1.png |
101 kB |
Paul Fullerton |
Mar 21, 2018 14:10 |
Mar 21, 2018 14:10 |
|
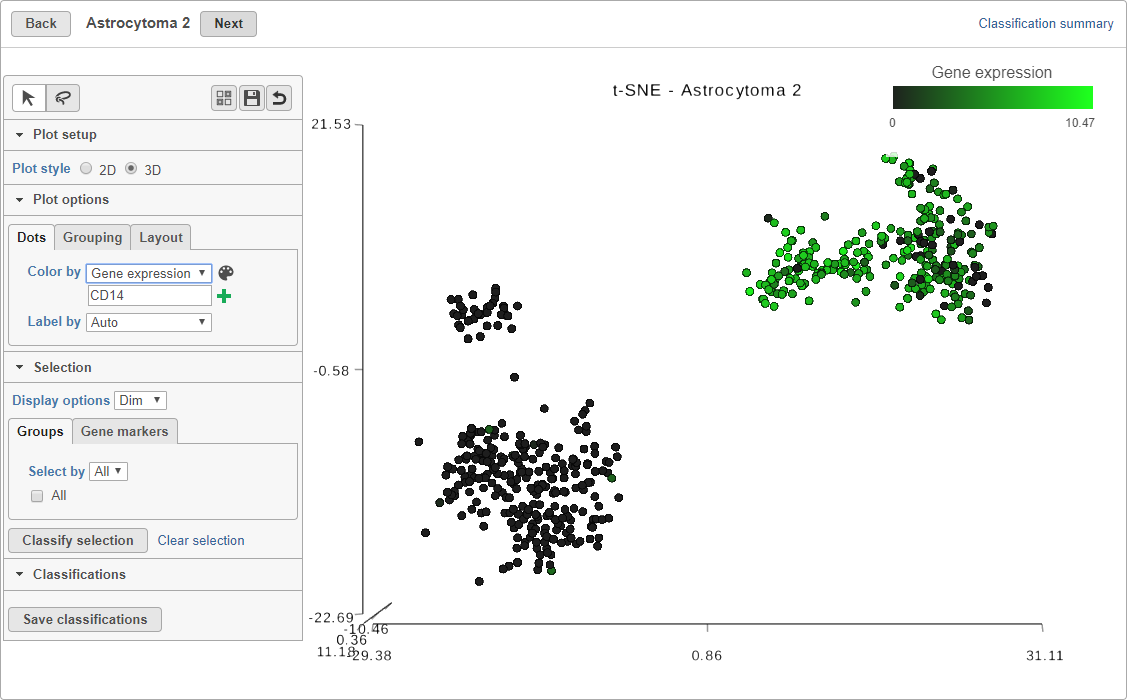
Page: Compare expression between cell types with multiple samples
|
|
PNG File image2018-3-21 14:10:1.png |
101 kB |
Alex Rutkovsky |
Jul 12, 2023 07:38 |
Jul 12, 2023 07:38 |
|
Page: Make comparisons using Compute biomarkers and Biological interpretation
|
|
PNG File image2018-3-21 14:10:1.png |
101 kB |
Alex Rutkovsky |
Jul 07, 2023 11:29 |
Jul 07, 2023 11:29 |
|
Page: Spatial data analysis steps
|
|
PNG File shrinkage_plot.png |
101 kB |
admin |
Jul 27, 2016 08:42 |
Jul 27, 2016 08:42 |
|
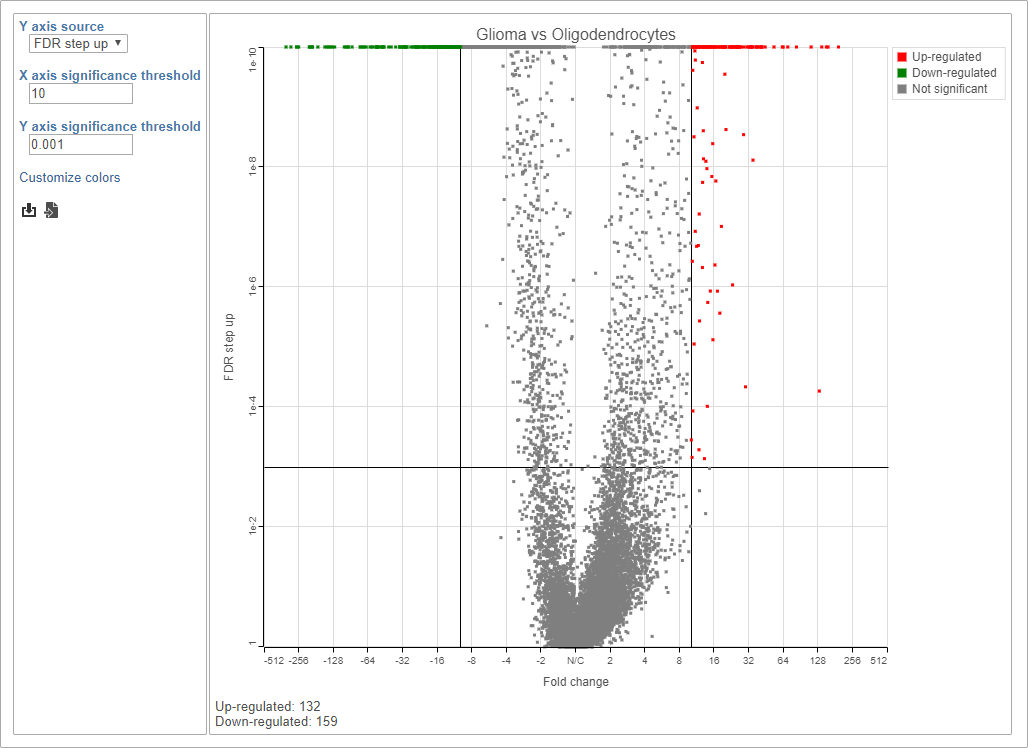
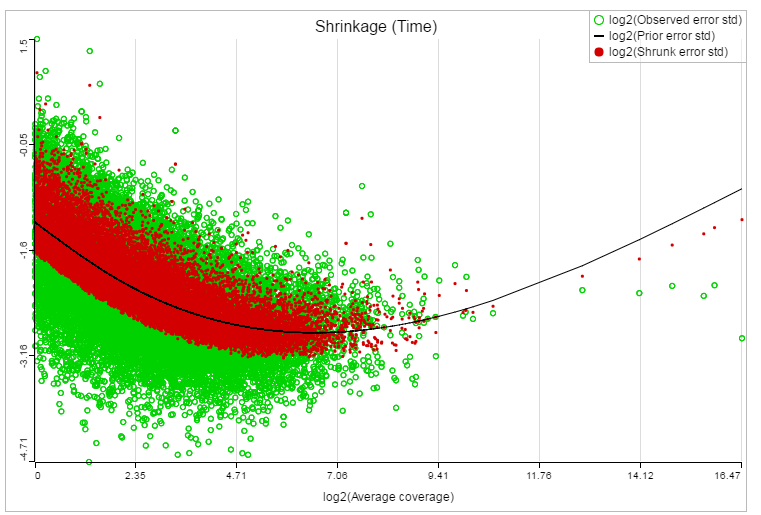
Page: GSA
|
|
PNG File image2018-1-29 17:12:46.png |
100 kB |
Paul Fullerton |
Jan 29, 2018 17:12 |
Jan 29, 2018 17:12 |
|
Page: Classify cells from multiple samples using t-SNE
|
|
PNG File image2018-1-29 17:12:46.png |
100 kB |
Alex Rutkovsky |
Jul 12, 2023 07:38 |
Jul 12, 2023 07:38 |
|
Page: Process Xenium data
|
|
PNG File image2018-1-29 17:12:46.png |
100 kB |
Alex Rutkovsky |
Jul 07, 2023 11:29 |
Jul 07, 2023 11:29 |
|
Page: Start with 10x Genomics Visium fastq files
|