What is AUCells?
AUCells is a tool to identify cells that are actively expressing genes within a gene list [1]. For each input gene list, AUCells calculates a value for each cell by ranking all genes by their expression level in the cell and identifying what proportion of the genes from the gene list fall within the top 5% (default cutoff) of genes. This method allows the AUCell value to represent the proportion of genes from the gene list that are expressed in the cell and their relative expression compared to other genes within the cell. Because this is a rank-based method and is calculated for each cell individually, AUCells can be run on raw or normalized data. As an AUCells value is the proportion of genes from the list that are within the top percentile of expressed genes, AUCell values can range from 0 to 1, but may have a more restricted range.
AUCells values can be used directly as input for downstream analysis, such as clustering. Another common use is to set an AUCell value cutoff for expressing vs. not and used this to classify cells. AUCells values will separate cells most effectively when the genes in the list are highly and specifically expressed in a population of cells. If the genes are specifically expressed, but not highly expressed, the AUCells value will not be as useful.
Running AUCells
AUCells can be run on any single cell counts data node.
- Click the single cell counts data node
- Click the Exploratory analysis section in the toolbox
- Click AUCells
- Choose gene lists by clicking and dragging them to the panel on the right or clicking the green plus that appears after mousing over a gene list (Figure 1)
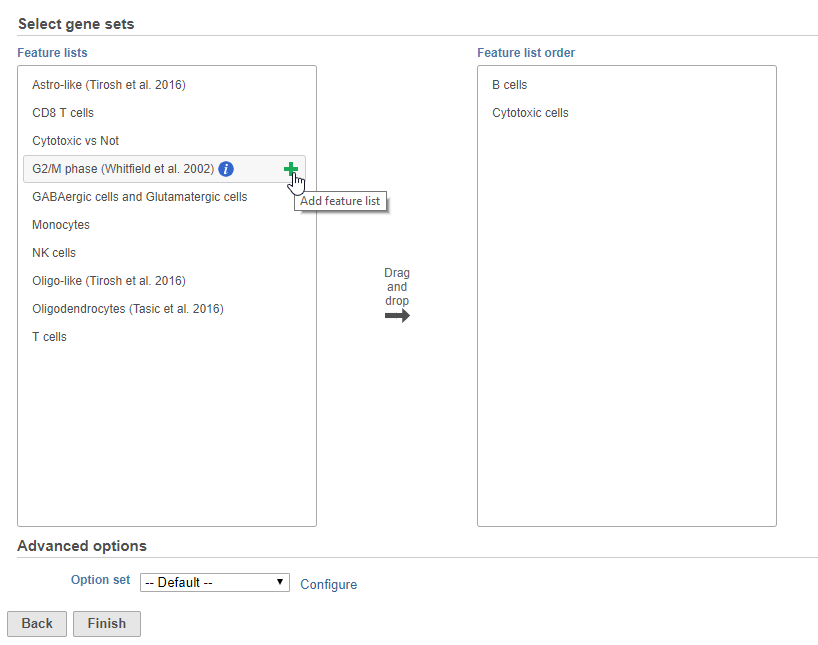
Figure 1. Choosing gene lists for AUCells
- Click Finish to run
AUCells produces an AUCells result data node. The AUCells result data node includes the input counts data and adds the AUCells scores to the original data as a new data type, AUCells Values. AUCells values for each input feature list are included as features in the AUCells result data node. These features created by AUCells are named after the feature list (e.g., B cells, Cytotoxic cells).
Because the AUCell values are added as features, they can be used as input for clustering, differential analysis, and visualization tasks.
To produce a data node containing only the AUCells values, use Split Matrix to split the AUCells result data node into separate data nodes for each of its data types.
If an AUCells result data node or other downstream data node containing AUCell Values is used as the input for AUCells, the additional AUCells values will be added as additional features of the AUCells values data type in the new AUCells result data node.
Advanced AUCells parameters
Minimum gene set size
For each gene set, AUCells computes the intersection between the gene list and the input data set. If the intersection size is below the specified threshold, the gene set is ignored and no AUCell score is calculated for it. Default is 5.
Top features in percentiles
To calculate the AUCells value, genes are ranked and the fraction of genes from the gene list that are above the percentile cutoff is the AUCells value. This parameter sets the percentile cutoff. Default is 5.
References
[1] Aibar, S., González-Blas, C. B., Moerman, T., Imrichova, H., Hulselmans, G., Rambow, F., ... & Atak, Z. K. (2017). SCENIC: single-cell regulatory network inference and clustering. Nature methods, 14(11), 1083.
Additional Assistance
If you need additional assistance, please visit our support page to submit a help ticket or find phone numbers for regional support.


| Your Rating: |
|
Results: |

|
0 | rates |
Overview
Content Tools