This tutorial presents an outline of the basic series of steps for analyzing a 10x Genomics Gene Expression with Feature Barcoding (antibody) data set in Partek Flow starting with the output of Cell Ranger.
If you are starting with the raw data (FASTQ files), please begin with our Processing CITE-Seq data tutorial, which will take you from raw data to count matrix files.
If you have Cell Hashing data, please see our documentation on Hashtag demultiplexing.
This tutorial includes only one sample, but the same steps will be followed when analyzing multiple samples. For notes on a few aspects specific to a multi-sample analysis, please see our Single Cell RNA-Seq Analysis (Multiple Samples) tutorial.
If you are new to Partek Flow, please see Getting Started with Your Partek Flow Hosted Trial for information about data transfer and import and Creating and Analyzing a Project for information about the Partek Flow user interface.
Data set
The data set for this tutorial is a demonstration data set from 10x Genomics. The sample includes cells from a dissociated Extranodal Marginal Zone B-Cell Tumor (MALT: Mucosa-Associated Lymphoid Tissue) stained with BioLegend TotalSeq-B antibodies. We are starting with the Feature / cell matrix HDF5 (filtered) produced by Cell Ranger.
Importing feature barcoding data
- Click Import data
- Click Single cell data
- Choose the filtered HDF5 file produced by Cell Ranger
- Click Next
- Name the sample (default is the file name)
- Specify the annotation used for the gene expression data (here, we choose hg38 and Ensembl 94)
- Uncheck Report features without counts
- Click Finish (Figure 1)
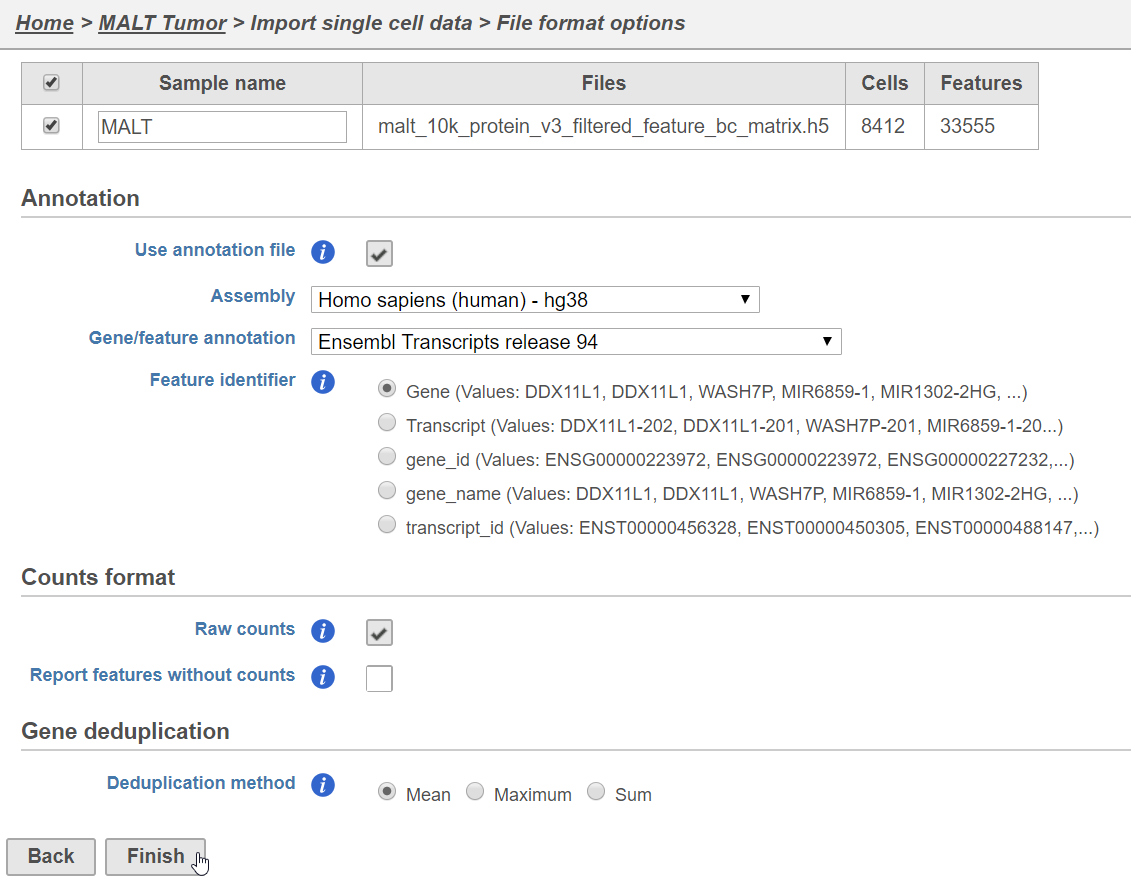
Figure 1. Configuring import of the HDF5 file produced by Cell Ranger 3
A Single cell counts data node will be created after the file has been imported.
Split matrix
The Single cell counts data node contains two different types of data, mRNA measurements and protein measurements. So that we can process these two different types of data separately, we will split the data by data type.
- Click the Single cell counts data node
- Click the Pre-analysis tools section of the toolbox
- Click Split matrix
A rectangle, or task node, will be created for Split matrix along with two output circles, or data nodes, one for each data type (Figure 2). The labels for these data types are determined by features.csv file used when processing the data with Cell Ranger. Here, our data is labeled Gene Expression, for the mRNA data, and Antibody Capture, for the protein data.

Figure 2. Split matrix produces two data nodes, one for each data type
Filter low-quality cells
An important step in analyzing single cell RNA-Seq data is to filter out low-quality cells. A few examples of low-quality cells are doublets, cells damaged during cell isolation, or cells with too few reads to be analyzed. In a CITE-Seq experiment, protein aggregation in the antibody staining reagents can cause a cell to have a very high number of counts; these are low-quality cells are can be excluded. Additionally, if all cells in a data set are expected to show a baseline level of expression for one of the antibodies used, it may be appropriate to filter out cells with very low counts. You can do this in Partek Flow using the Single cell QA/QC task.
We will start with the protein data.
- Click the Antibody Capture data node
- Click the QA/QC section in the toolbox
- Click Single Cell QA/QC
- Choose the assembly and annotation used for the gene expression data (Figure 3) from the drop-down menus
- Click Finish

Figure 3. Configuring Single-cell QA/QC
This produces a Single-cell QA/QC task node (Figure 4).

Figure 4. Single cell QA/QC produces a task node
- Double-click the Single cell QA/QC task node to open the task report
The task report lists the number of counts per cell and the number of detected features per cell in two violin plots. For more information, please see our documentation for the Single cell QA/QC task. For this analysis, we will set a maximum counts threshold to exclude potential protein aggregates and, because we expect every cell to be bound by several antibodies, we will also set a minimum counts threshold.
- Set the Counts filter to Keep cells between 500 and 20000 (Figure 5)

Figure 5. Single cell QA/QC report - Antibody capture
- Click Apply filter to run the Filter cells task
The output is a Filtered single cell counts data node (Figure 6).

Figure 6. Filtered cells output
Next, we can repeat this process for the Gene Expression data node.
- Click the Gene Expression data node
- Click the QA/QC section in the toolbox
- Click Single Cell QA/QC
- Choose the assembly and annotation used for the gene expression data (Figure 3) from the drop-down menus
- Click Finish
This produces a Single-cell QA/QC task node (Figure 7).

Figure 7. Single cell QA/QC produces a task node
- Double-click the Single cell QA/QC task node to open the task report
The task report lists the number of counts per cell, the number of detected features per cell, and the percentage of mitochondrial reads per cell in three violin plots. For this analysis, we will set a maximum counts threshold maximum and minimum thresholds for total counts and detected genes to exclude potential doublets and a maximum mitochondrial reads percentage filter to exclude potential dead or dying cells.
- Set the Counts filter to Keep cells between 1500 and 15000
- Set the Detected genes filter to Keep cells between 400 and 4000
- Set the Mitochondrial counts filter to Keep cells between 0% and 20% (Figure 8)

Figure 8. Filtering low-quality cells by gene expression data
- Click Apply filter to run the Filter cells task
The output is a Filtered single cell counts data node (Figure 9).

Figure 9. There are now two Filtered single cell counts data nodes
Normalization
After excluding low-quality cells, we can normalize the data.
We will start with the protein data.
- Click the Antibody Capture data node
- Click the Normalization and scaling section in the toolbox
- Click Normalization
- Click the green plus next to CLR (Figure 10) or drag CLR to the right-hand panel

Figure 10. Choosing CLR normalization
Centered log-ratio (CLR) normalization is the standard method for CITE-Seq data (.
Overview
Content Tools