Partek Pathway is a standalone program from Partek Genomics Suite with a distinct user interface (Figure 1). The size of each panel can be adjusted using the vertical and horizontal grab bars ( ).
).
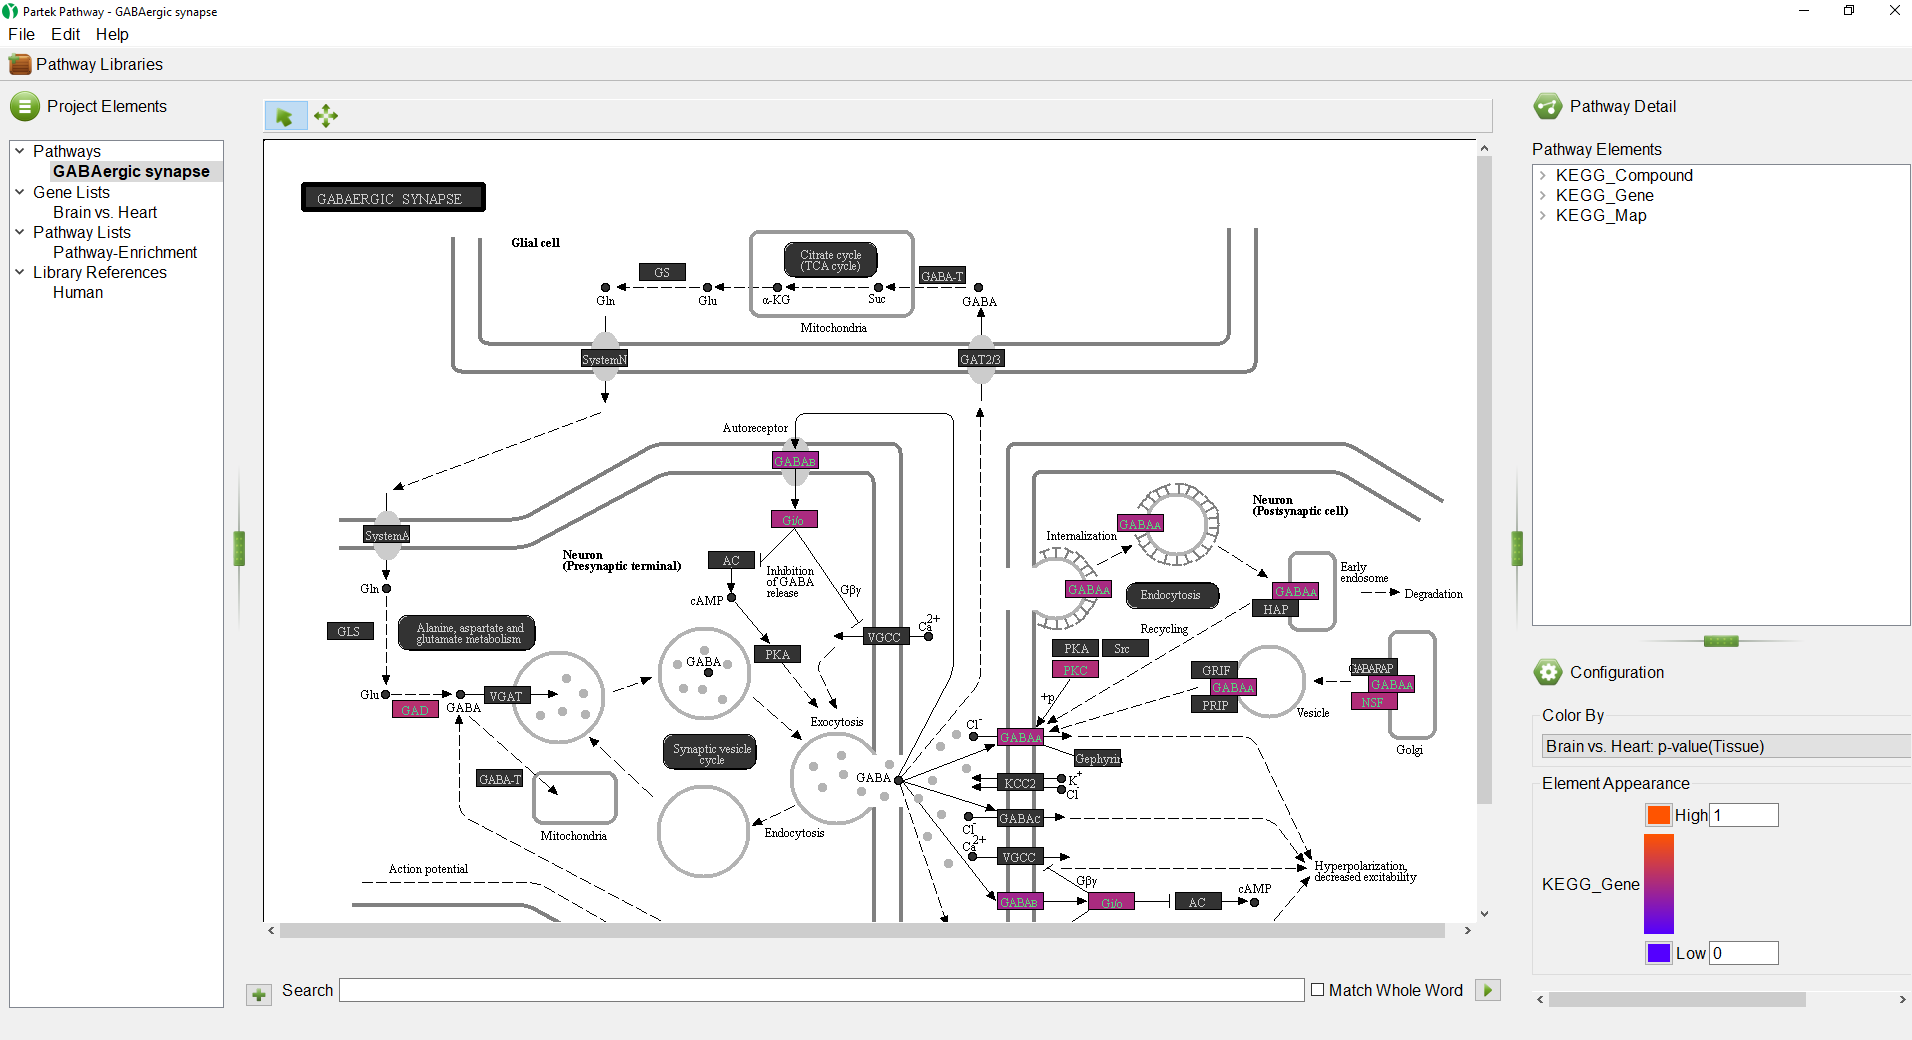 Figure 1. Partek Pathway
The Project Elements panel (Figure 2) displays the selected pathway, the original gene list, the Pathway Enrichment spreadsheet, and the library references that were used for the pathway analysis. The Project Elements panel is used to navigate between open pathway diagrams and spreadsheets.
Figure 1. Partek Pathway
The Project Elements panel (Figure 2) displays the selected pathway, the original gene list, the Pathway Enrichment spreadsheet, and the library references that were used for the pathway analysis. The Project Elements panel is used to navigate between open pathway diagrams and spreadsheets.
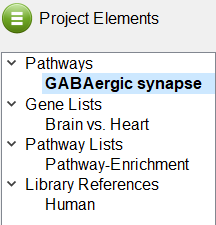 Figure 2. Project Elements panel
- Select the Brain vs. Heart spreadsheet under Gene Lists
The Brain vs. Heart gene list we created earlier will open (Figure 3). The spreadsheet can be sorted by any column by left-clicking a column header; the first click will sort by ascending values, the second click will switch to descending values.
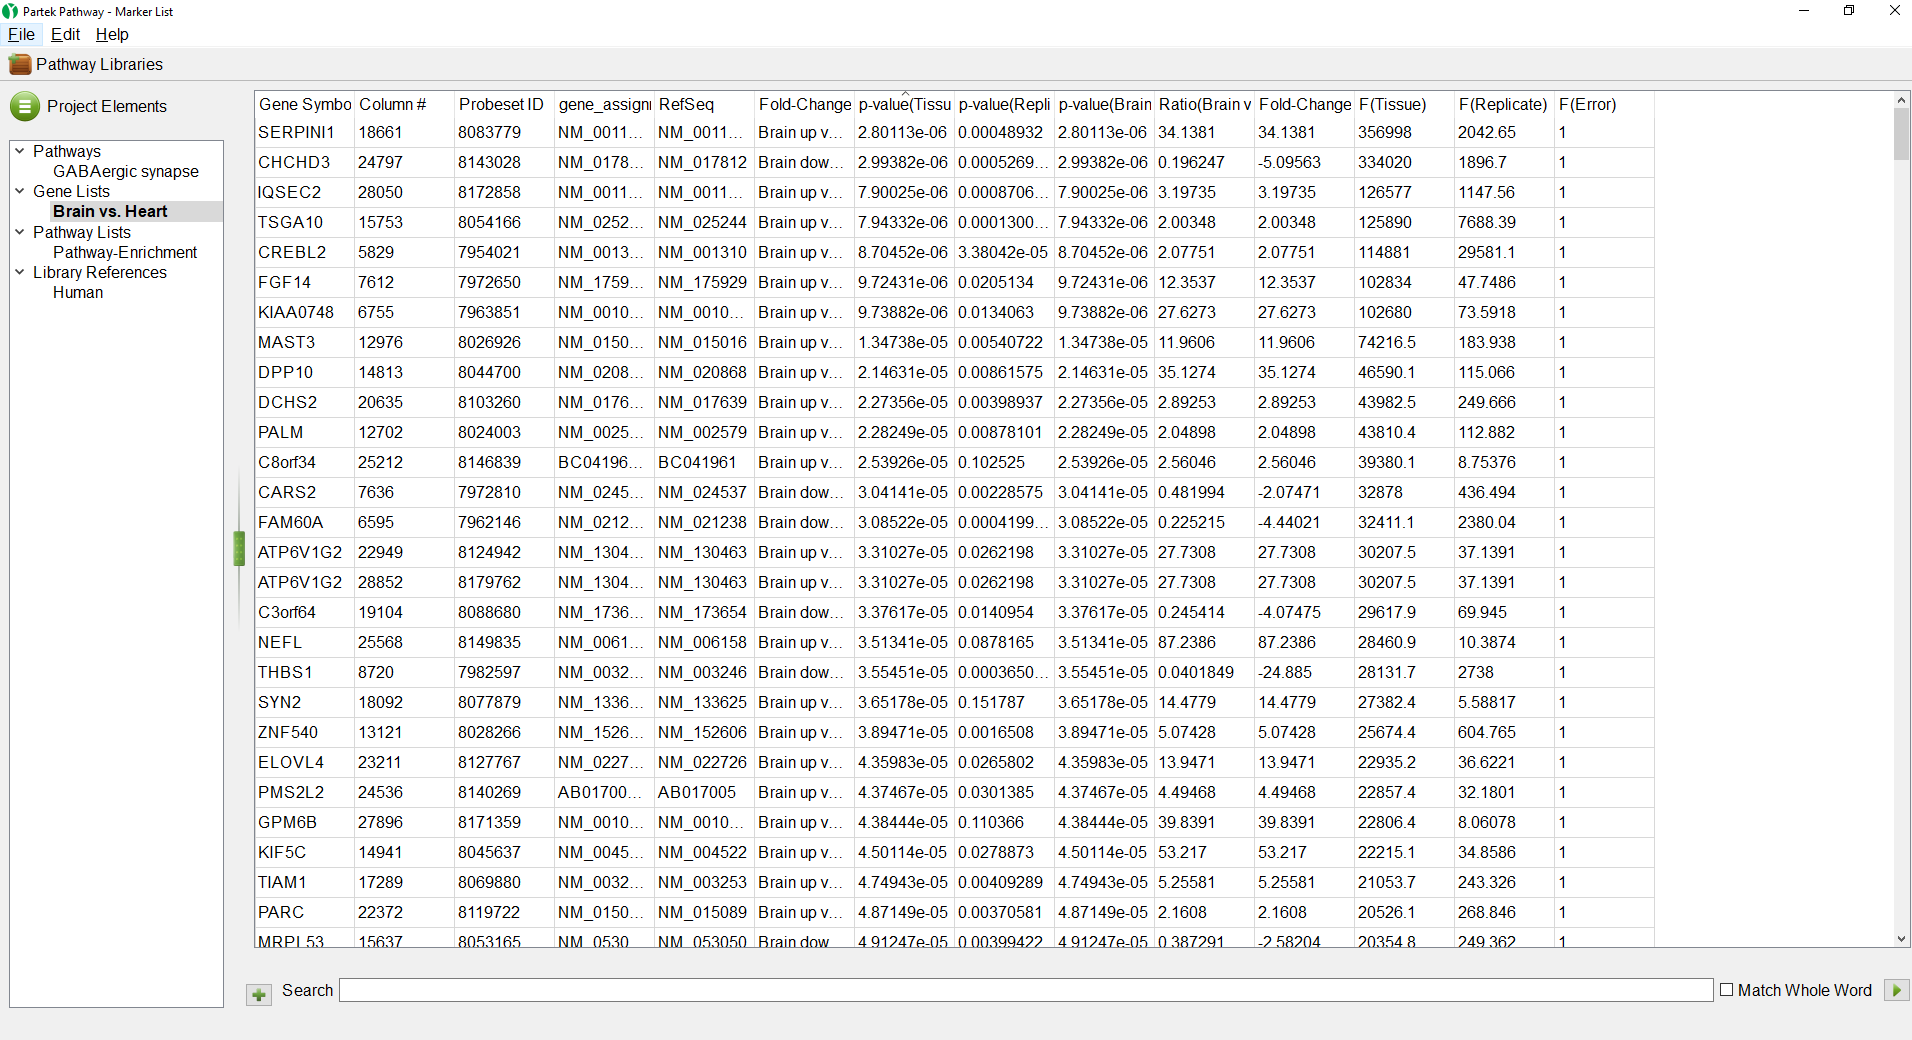
Figure 3. Viewing a gene list in Partek Pathway
- Select the Pathway-Enrichment spreadsheet under Pathway Lists
The Pathway-Enrichment.txt spreadsheet also seen in Partek Genomics Suite will open (Figure 4). Selecting any of the pathway names will open its pathway diagram. The spreadsheet can be sorted by any column.
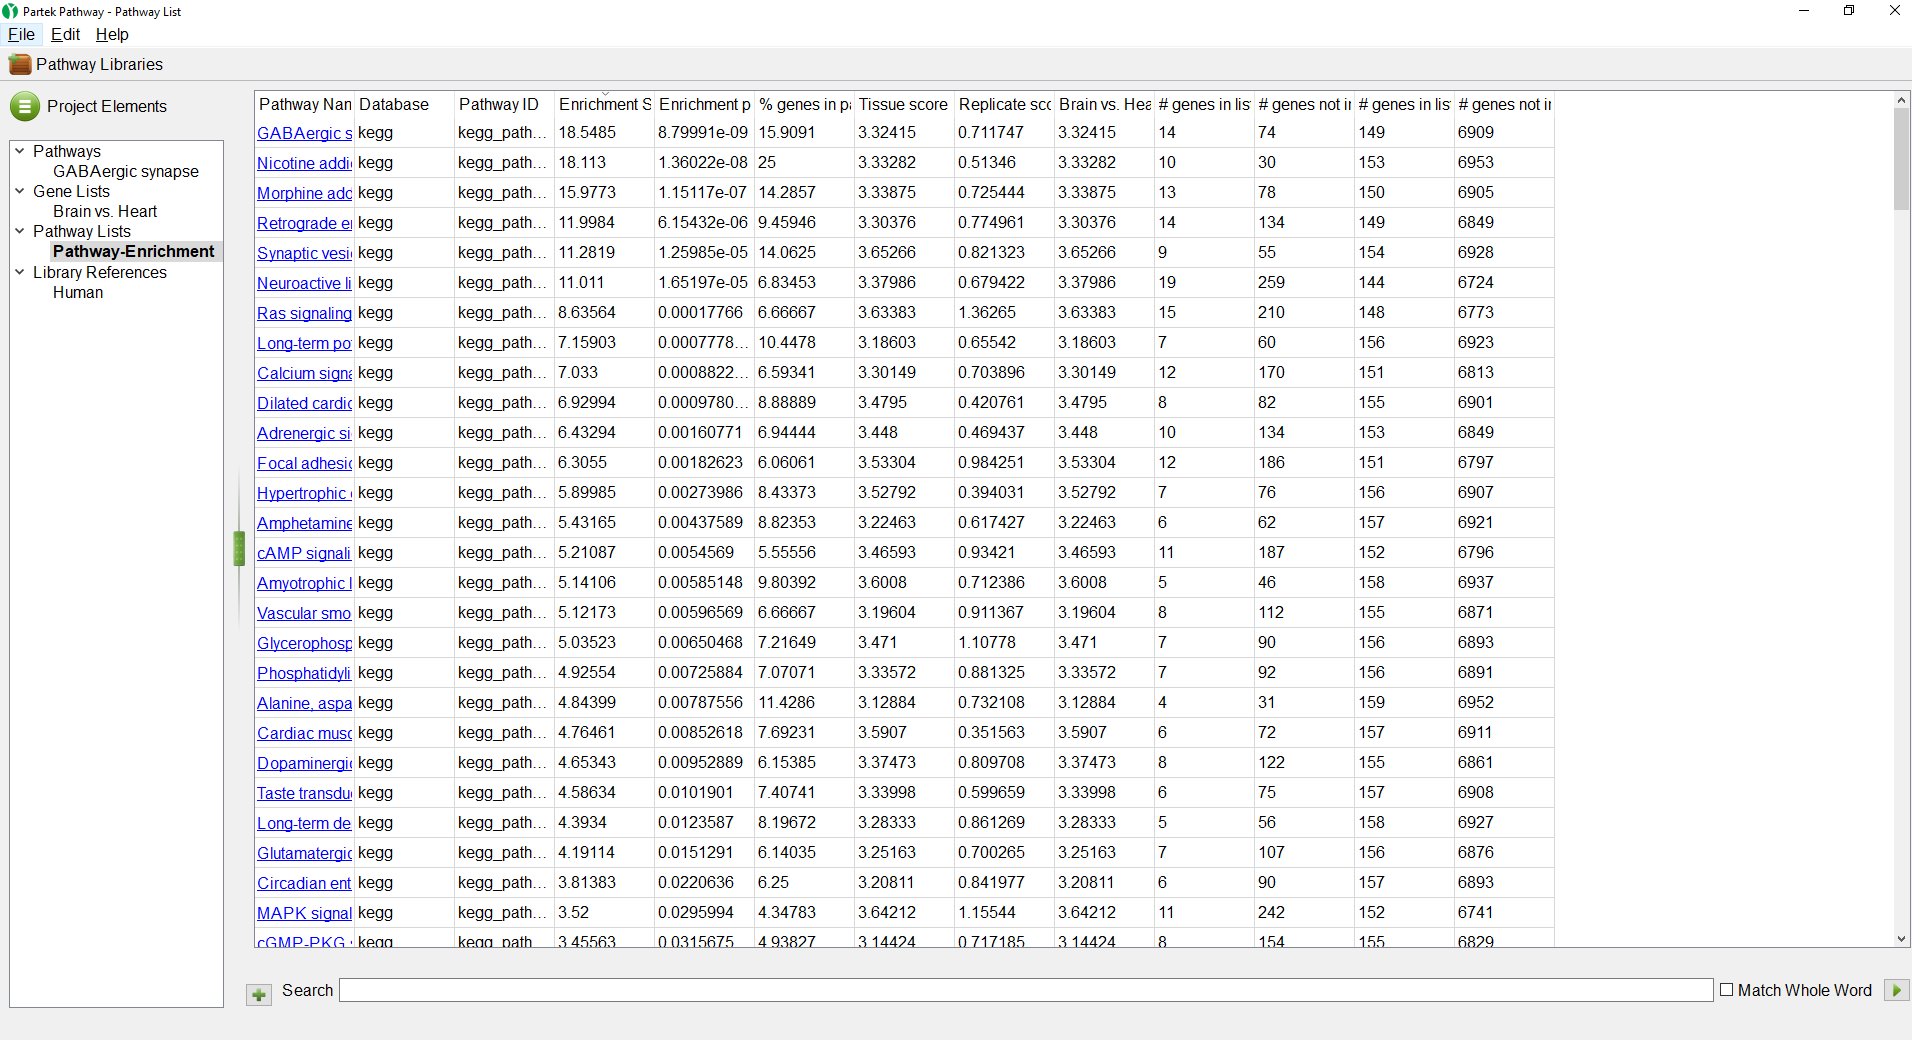 Figure 4. Viewing the Pathway Enrichment spreadsheet in Partek Pathway
- Select the GABAergic synapse pathway on the Pathway-Enrichment spreadsheet or the Project Elements panel
The GABAergic synapse pathway diagram will open. Genes in the pathway are shown as boxes. The color of the box is set by the Configuration panel (Figure 5).
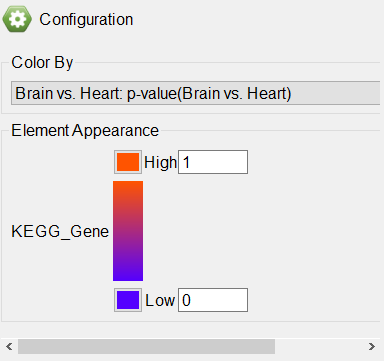
Figure 5. Configuring the colors of a pathway diagram
Any numerical column from the source gene list can be used to color the gene boxes. While significant p-values indicate a difference between the categories, they give no information about upregulation or downregulation of the pathway. We can overlay fold-change information on the pathway diagram.
- Select Brain vs. Heart: Fold-Change(Brain vs. Heart) from the drop-down menu
The pathway diagram now shows fold change for each gene in the pathway included in the gene list (Figure 6). Genes not in the gene list remain black.
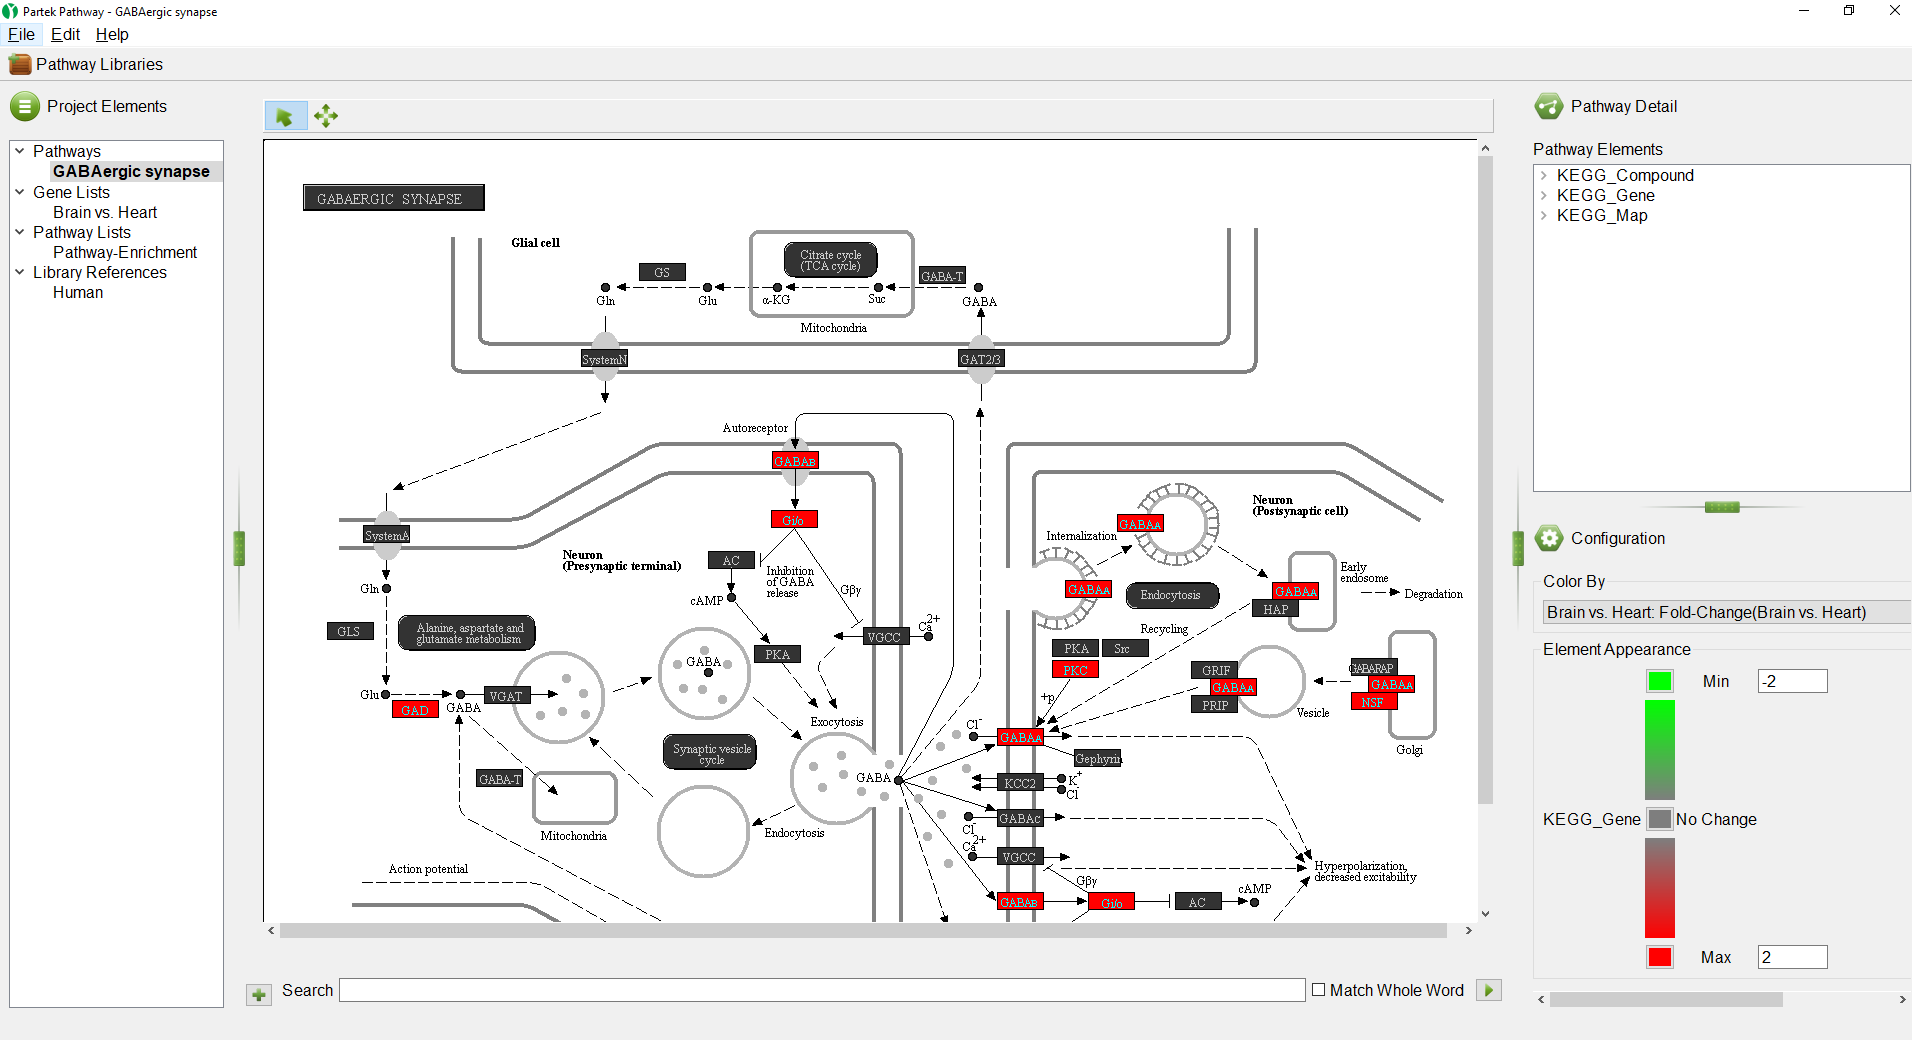 Figure 6. GABAergic synapse pathway diagram showing fold-changes for genes in the gene list
The colors and range of can be changed using the Color By panel.
Figure 6. GABAergic synapse pathway diagram showing fold-changes for genes in the gene list
The colors and range of can be changed using the Color By panel.
- Select the red color square next to Max
- Select a yellow from the color picker interface
- Select the green color squre next to Min
- Select teal from the color picker interface
We can see that all the colored genes in the GABAergic synapse pathway are yellow (Figure 7), indicating that they are upregulated.
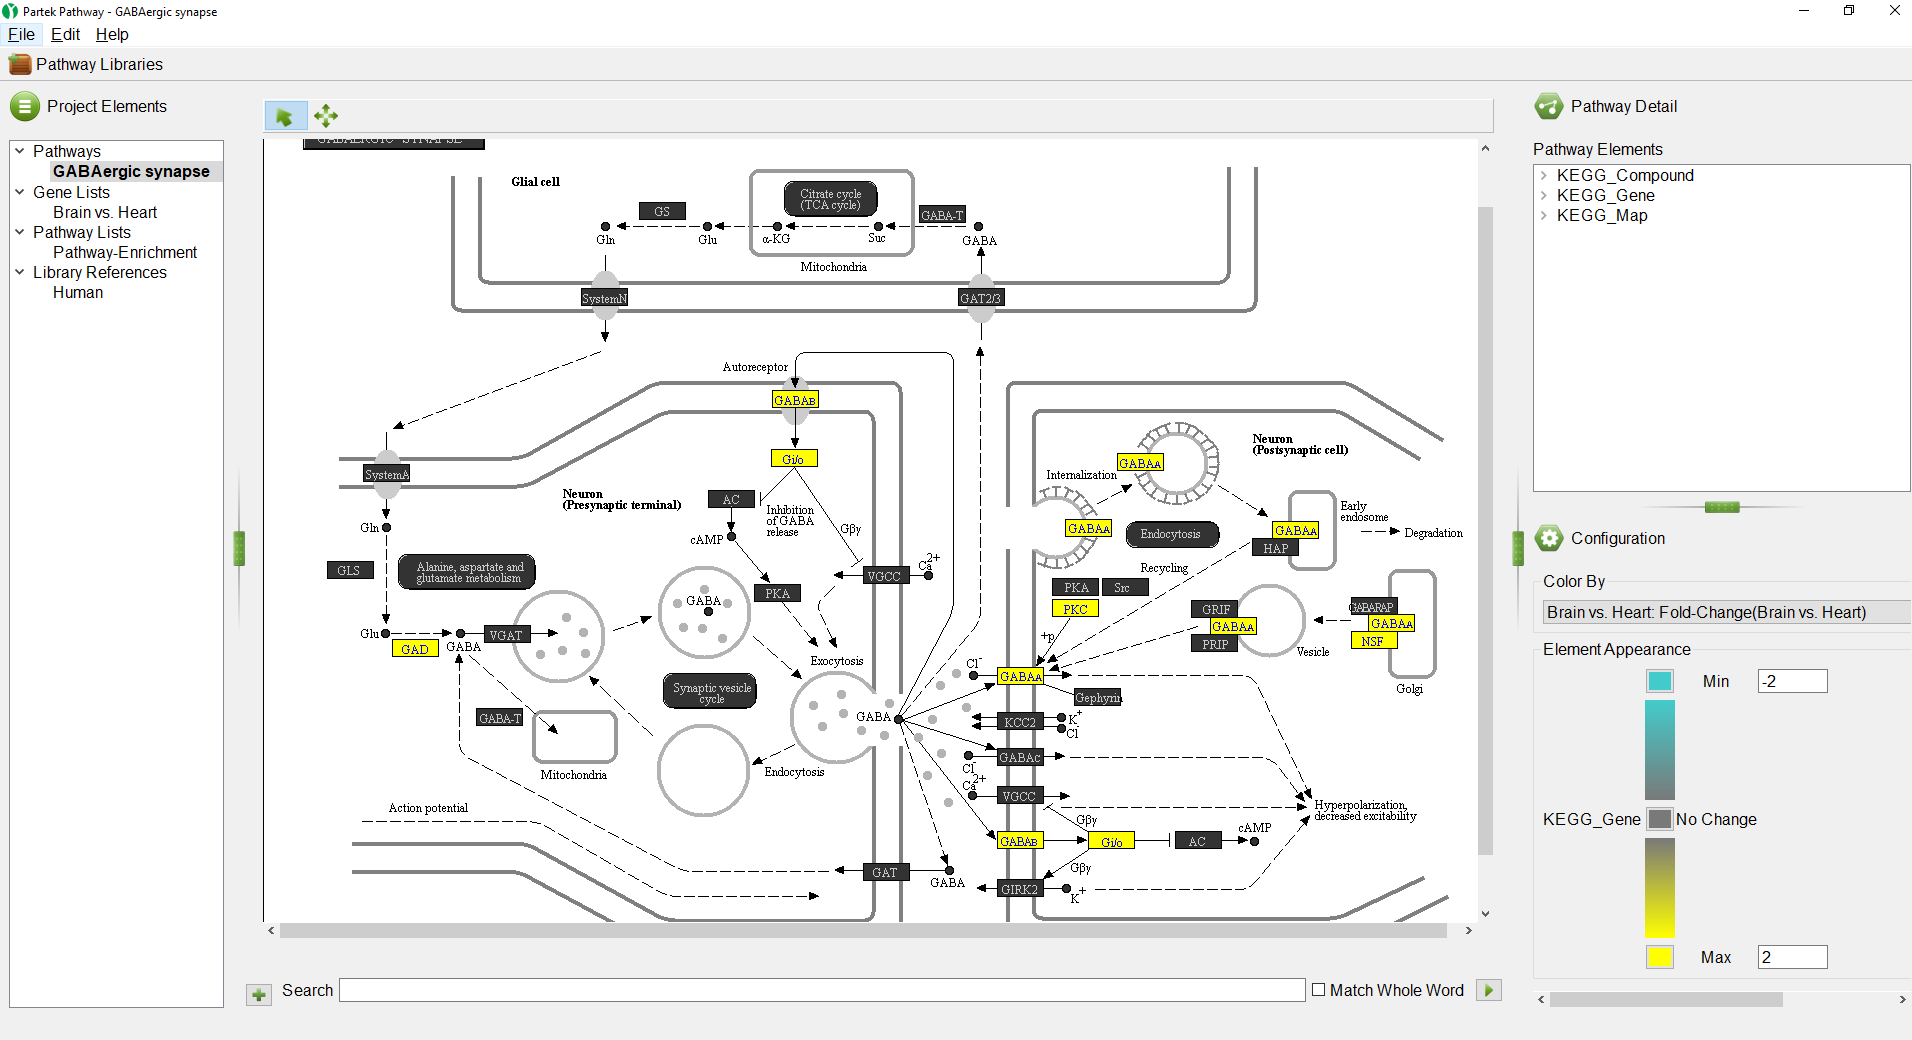 Figure 7. Changing colors in the Pathway Diagram; up-regulated genes are yellow and down-regulated genes are teal
We can select a gene to learn more.
Figure 7. Changing colors in the Pathway Diagram; up-regulated genes are yellow and down-regulated genes are teal
We can select a gene to learn more.
- Select (
 ) to activate selection mode
 - Right-click GABAB (Figure 8)
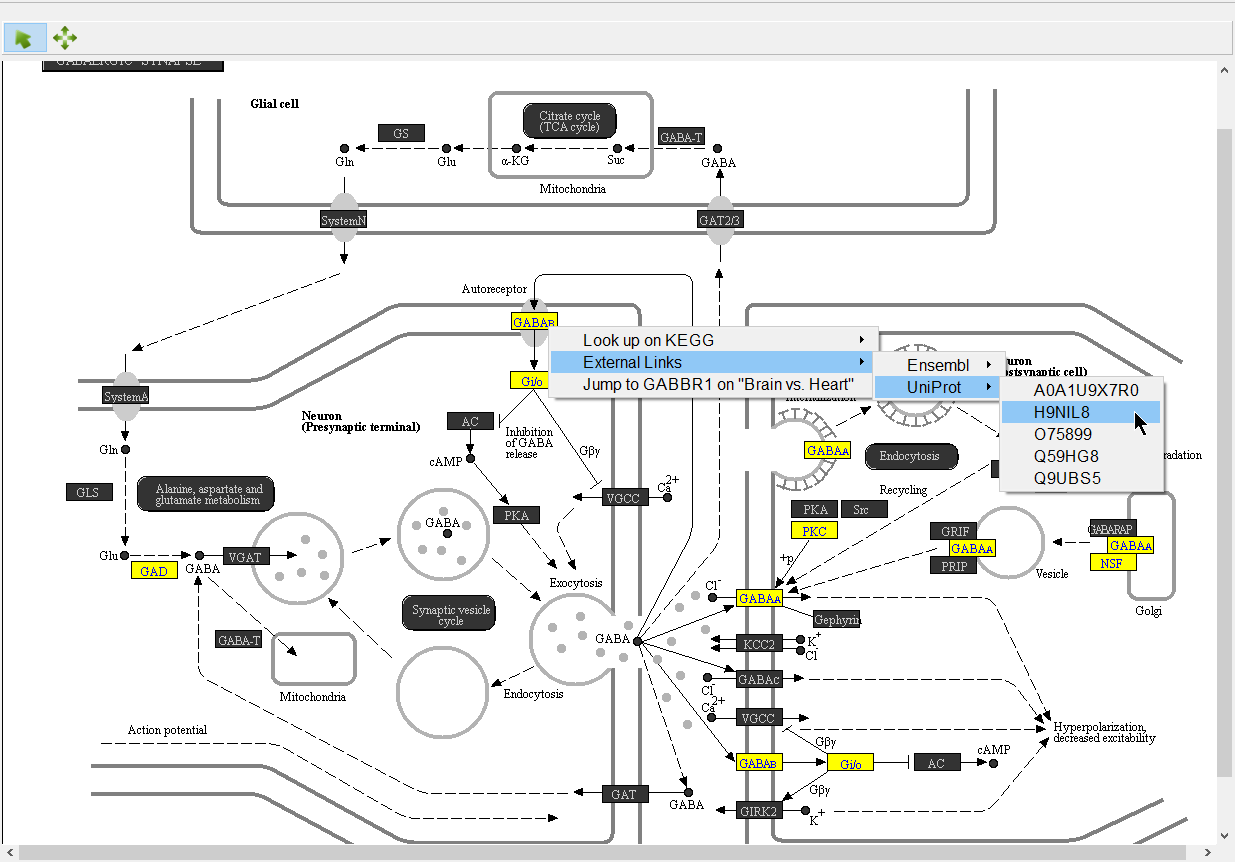
Figure 8. Learn more about any gene on a pathway diagram by right-clicking
Opions available include:
Look up on KEGG - opens the KEGG page for the pathway on GenomeNet (genome.jp) in your web browser
Ensembl - under External Links, opens the page for the selected Ensembl ID on ensemble.org
UniProt - under External Links, opens the page for the selected UniProt ID on uniprot.org
Jump to ___ on "___" - opens the source gene list in Partek Pathway to the row of the selected gene
Additional Assistance
If you need additional assistance, please visit our support page to submit a help ticket or find phone numbers for regional support.


| Your Rating: |
|
Results: |

|
12 | rates |
Overview
Content Tools