Page History
...
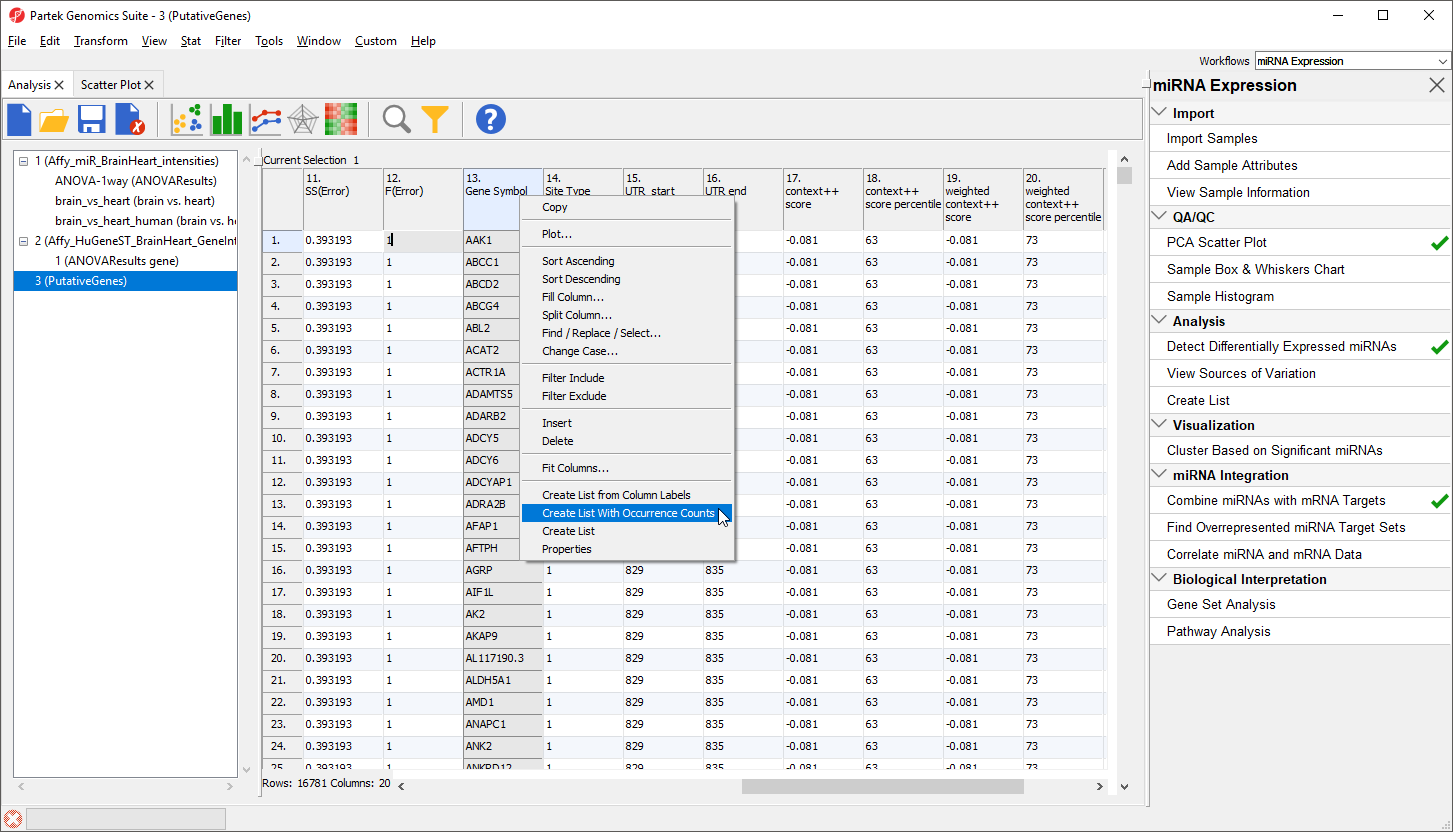
- Right-click on the column 13. Gene Symbol header
- Select Create List With Occurrence Counts from the pop-up menu (Figure 2)
| Numbered figure captions | ||||
|---|---|---|---|---|
| ||||
|
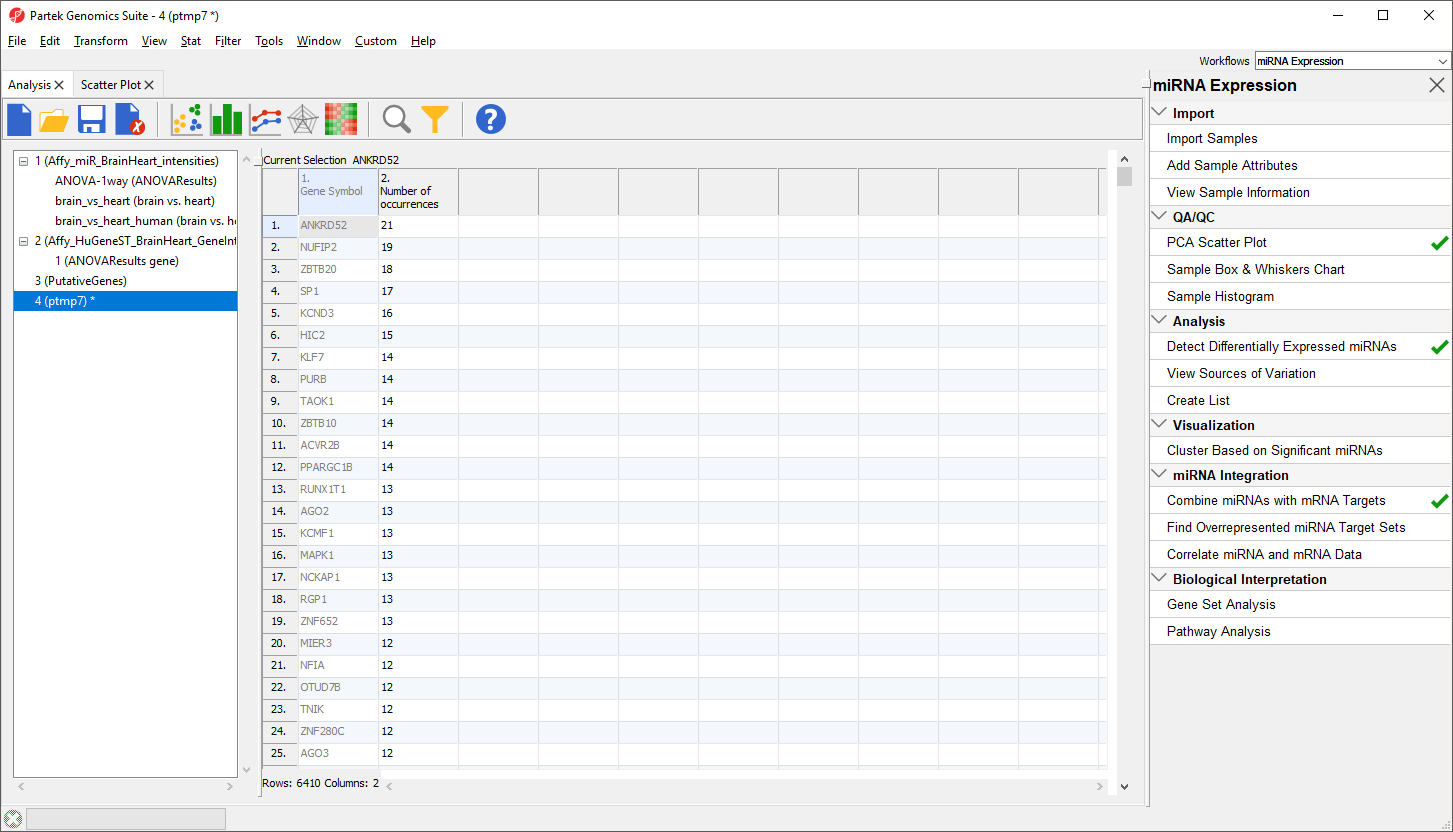
The new spreadsheet is a temporary spreadsheet listing each gene in alphabetical order and giving the occurance count of each. Sorting by descending order will list the gene with the most occurances first (Figure 3).
| Numbered figure captions | ||||
|---|---|---|---|---|
| ||||
|
We will not be using this temporary spreadsheet moving forward. You can close the spreadsheet by selecting ![]()
Finding overrepresented miRNA targets sets from gene expression data
This application is useful when you only have gene expression results or a gene list of interest and are interested in identifying which miRNAs might regulated the genes. Using a databse like TargetScan, you can create a list of miRNAs that are statistically predicted to regulated those genes. miRNAs of particular interest could then be explored using a lower-throughput technique like RT-qPCR.
Using the gene list as input, a Fisher's Exact right-tailed p-value is calculated to show the overrepresentation of genes of interest for each miRNA in the database. THe smaller the p-value, the more overrepresented the miRNAs are for the dataset. Target associations are taken from a database, TargetScan in this example. If the input list is a filtered list of gnees from an ANOVA calculation, the parent spreadsheet is used to identify the background list of genes from the array. Gene in the array, but not in the significant gene list will be treated as background in the calculations.
To begin, we need to create a list of significant genes using the ANOVAResults gene spreadsheet.
- Select the ANOVAResults gene spreadsheet in the spreadsheet tree
- Select Create List from the workflow
- Select Brain vs. Heart
- Set the Save list as to brain vs. heart genes
- Leave other fields at their default values (Figure 4)
- Select Create
| Numbered figure captions | ||||
|---|---|---|---|---|
| ||||
|
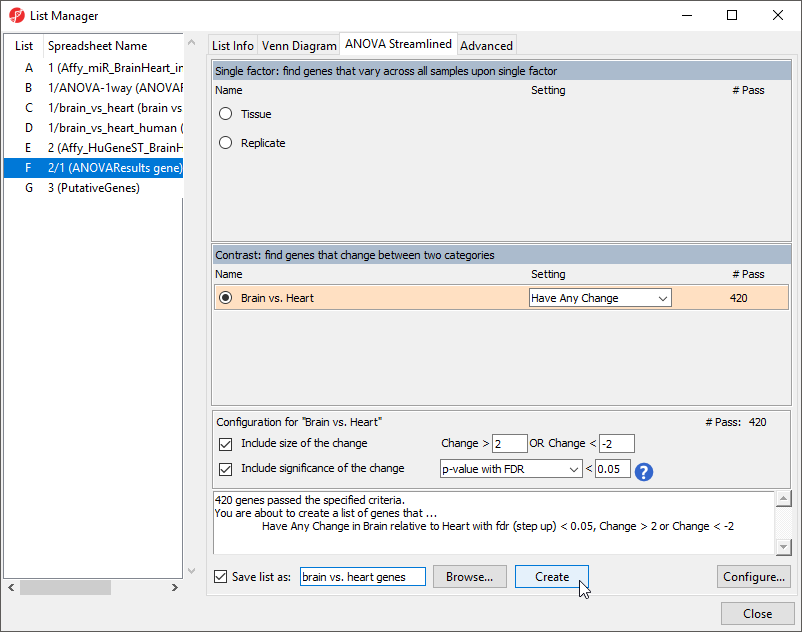
- Select Close to exit the List Manager dialog
| Additional assistance |
|---|
|
| Rate Macro | ||
|---|---|---|
|
Overview
Content Tools