Page History
...
| Numbered figure captions | ||||
|---|---|---|---|---|
| ||||
|
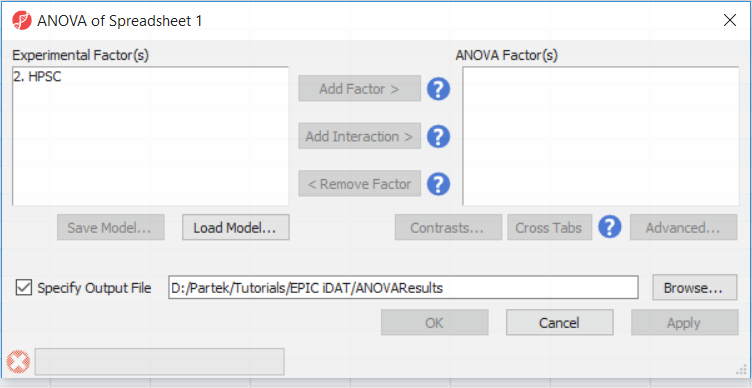
Depending on the data in the top level (i.e. parent) spreadsheet you may want to manually specify whether the data is already log transformed: you should select Yes for M-values (but otherwise No for β-values) (Figure 2). By default, Partek Genomics Suite will calculate fold-change value for each contrast. In addition, to include the difference in methylation levels at each CpG site in the output (i.e. ΔM or Δβ), check the Estimate box in the Other Statistics section of the dialog (Figure 2).
| Numbered figure captions | ||||
|---|---|---|---|---|
| ||||
|
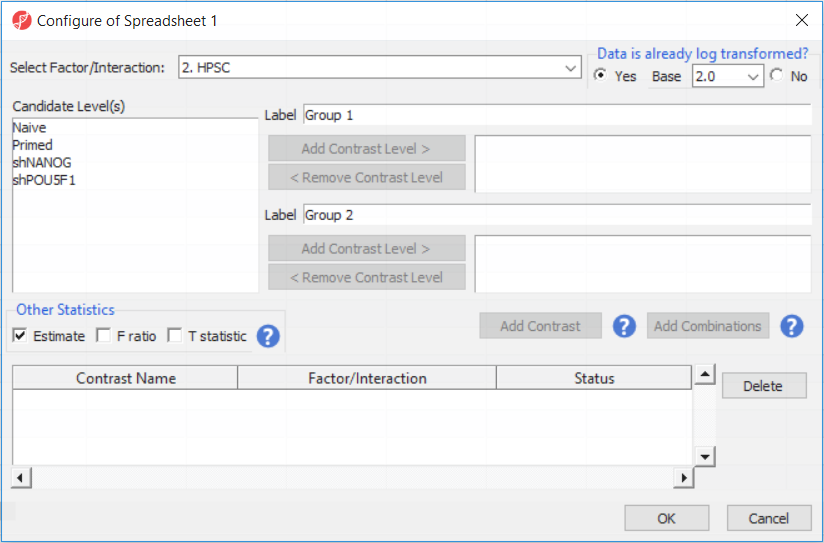
For this exercise, we shall compare primed HPSC with suppression of OCT4 (shPOU5F1) and primed HPSC with suppression of NANOG (shNANOG) with the baseline primed cells. To start with, select the Primed group in the Candidate Level(s) box and push Add Contrast Level > to move the Primed group to Group 2 (lower box). Then Ctrl & select both shPOU5F1 and shNANOG in the Candidate Level(s) box and push Add Contrast Level > to move them to Group 1 (upper box). Then click Add Combinations and confirm that two contrast have been created as seen in Figure 3.
and Select Add Contrast to confirm and then OK to go back to the ANOVA dialog. Note that the Contrasts button has now changed to Contrasts Included. Select OK to start the calculation. Select Contrast and use the Add Contrast Level> buttons to move Tumor to Group 1 and Normal to Group 2 (Figure 10).
Section Heading
Section headings should use level 2 heading, while the content of the section should use paragraph (which is the default). You can choose the style in the first dropdown in toolbar.
...
Overview
Content Tools