Page History
...
- Select Close to exit the List Manager dialog
We will now use this list to identify overrepresented miRNA target sets.
- Select Find overrepresented miRNA target sets from the miRNA Integration section of the workflow
- Select TargetScan 7.1 from the Target Databse drop-down menu
- Select brain vs. heart genes from the mRNA Spreadsheet drop-down menu
- Select 4. Gene Symbol from the Column with gene symbols drop-down menu (Figure 5)
- Select OK
| Numbered figure captions | ||||
|---|---|---|---|---|
| ||||
|

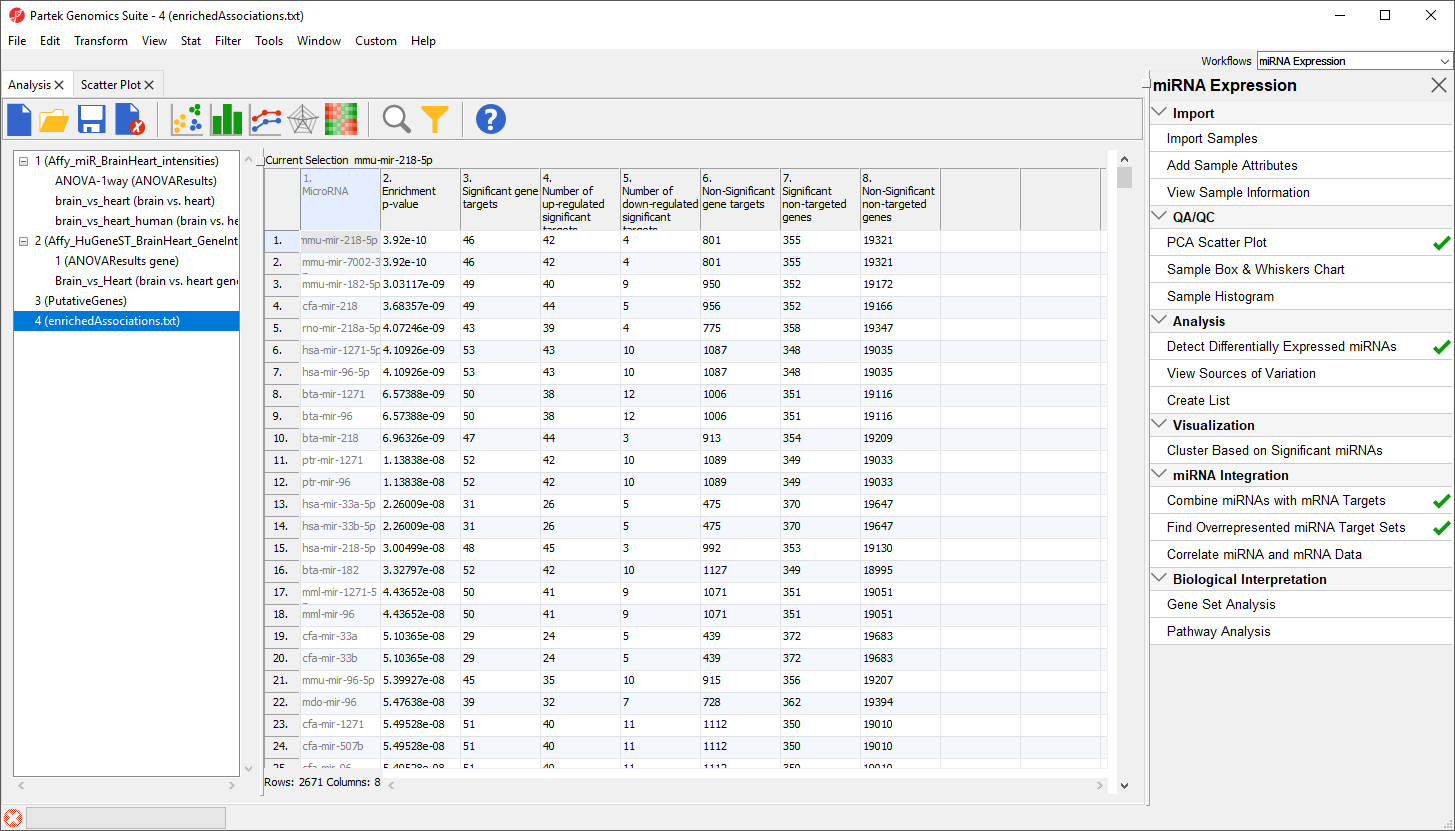
A new spreadsheet, enrichedAssociations, will be created with miRNAs from the database on rows (Figure 6). Column 1 contains the miRNA name and column 2 shows its p-value. The smaller the p-value, the more significant it is. Column 3 contains the number of genes from the (input) significant gene list that are targeted by this microRNA and Column 7 shows the number of significant genes from the input list that are not targeted by this microRNA. Columns 4 and 5 contain the number of significantly up- and down-regulated genes from the input significant gene list targeted by the miRNA. Column 6 shows the number of background genes (genes on the array but not in the input significant gene list) that are targeted by the miRNA and Column 8 shows the number of background genes on the array that are not targeted by the miRNA. The numbers in columns 3, 6, 7 and 8 will be used to calculate the Fisher’s Exact (right-tailed) p-value, a measure of the overrepresentation of the predicted miRNAs within a gene set.
| Numbered figure captions | ||||
|---|---|---|---|---|
| ||||
|
As the enrichment p-values have not been corrected for running multiple statistical tests, we can the multiple test corrrection feature of Partek Genomics Suite to adjust the p-values.
- Select the enrichedAssociations spreadsheet
- Select Stat from the main menu toolbar
- Select Multiple Test Correction
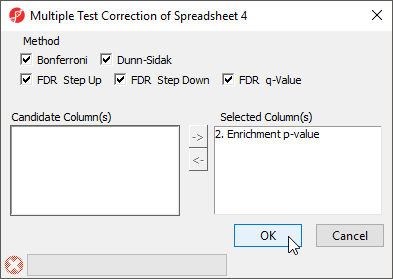
- Select all the multiple test correction options
- Transfer Enrichment p-value to the Selected Column(s) panel from the Candidate Column(s) panel (Figure 7)
| Numbered figure captions | ||||
|---|---|---|---|---|
| ||||
|
Columns for each of the test correction methods will be added to the enrichedAssociations spreadsheet and can be used to filter the list of miRNAs.
Combine miRNAs with mRNA target genes
This option is useful if you have miRNA and gene expression experiments you want to compare. The samples should be comparable, but do not have to originate from the same specimens.
- Select Combine miRNAs with their mRNA targets from the miRNA Integration section of the workflow
- Select the Get Targets from Spreadsheet tab
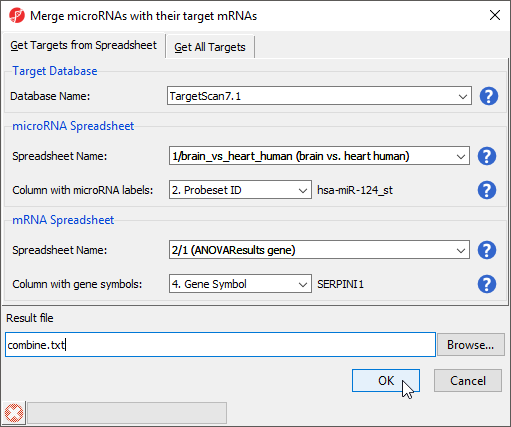
- Select TargetScan 7.1 from the Target Database drop-down menu
- Select brain vs. heart human from the microRNA Spreadsheet drop-down menu
- Select 2. Probeset ID for Column with microRNA labels
- Select ANOVAResults gene from the mRNA Spreadsheet drop-down menu
- Select 4. Gene Symbol for Column with gene symbols (Figure 8)
- Select OK
| Numbered figure captions | ||||
|---|---|---|---|---|
| ||||
|
In the new spreadsheet, each row represents a specific miRNA associated with one of its target genes; a single miRNA can have multiple targets. For example, hsa-miR-133b_st has 659 rows, one for each target (Figure 9).
| Numbered figure captions | ||||
|---|---|---|---|---|
| ||||
|
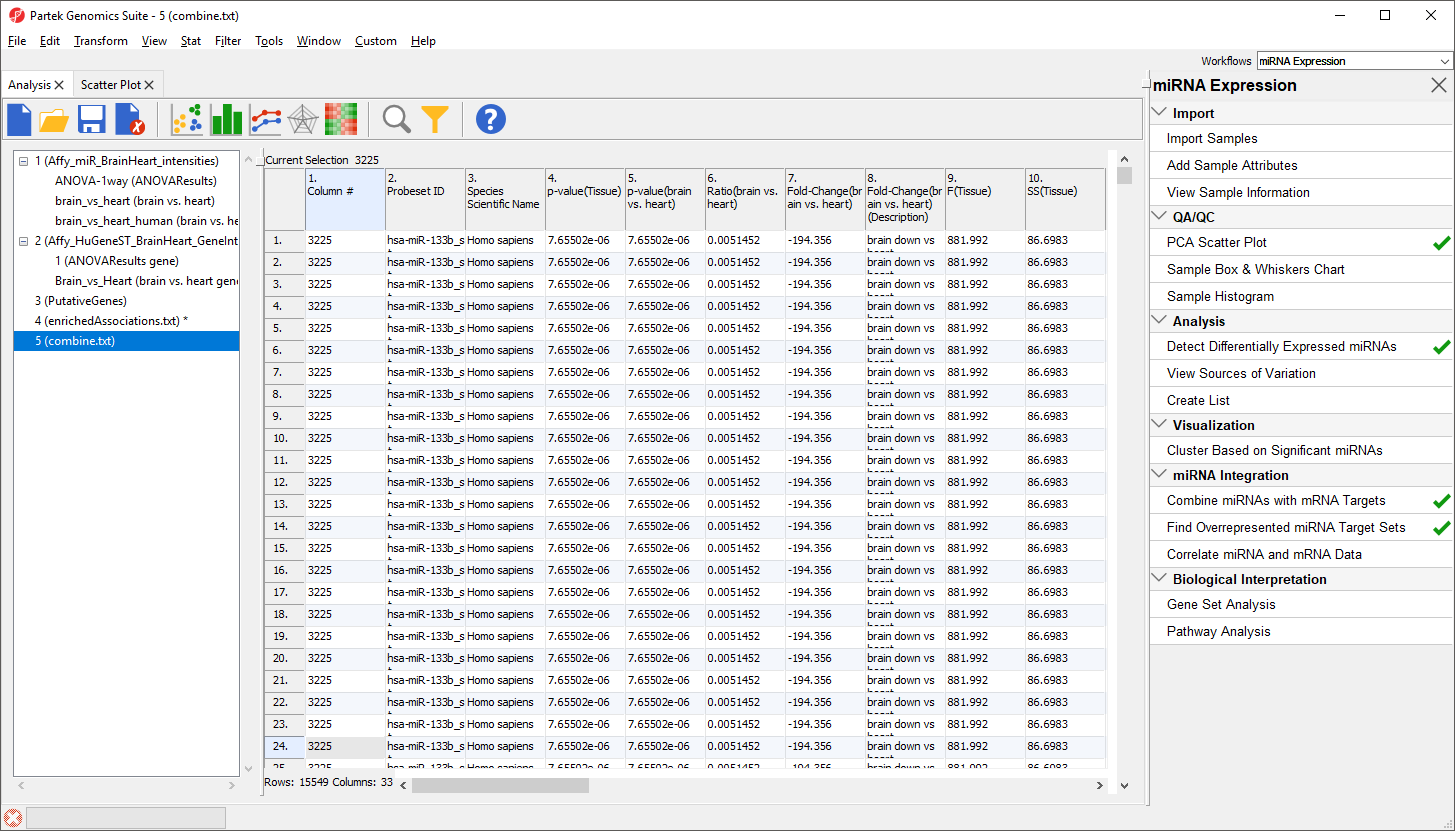
Columns 1-12 are taken from the miRNA expression source spreadsheet while columns 13-26 are taken from the gene expression source spreadsheet.
Correlating miRNA and gene expression data
This application is useful when you have miRNA and mRNA expression data form the same samples and want to correlate the findings to determine whether up- or down-regulated miRNAs result in gene expression changes in their cognate genes. Pearson and Spearman correlation coefficients and their p-values are calculated.
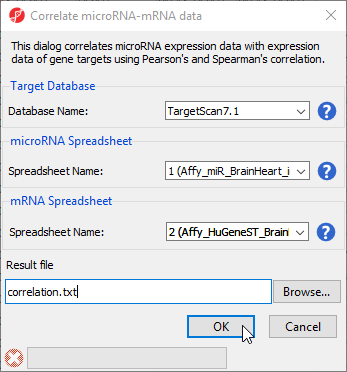
- Select Correlate miRNA and mRNA data from the miRNA Integration section of the workflow
- Select TargetScan7.1 from the Target Database drop-down menu
- Select Affy_miR_BrainHeart_intensities for the microRNA spreadsheet using the drop-down menu
- Select Affy_HuGeneST_BrainHeart_GeneIntensities as the mRNA spreadsheet using the drop-down menu (Figure 10)
- Select OK
| Numbered figure captions | ||||
|---|---|---|---|---|
| ||||
|
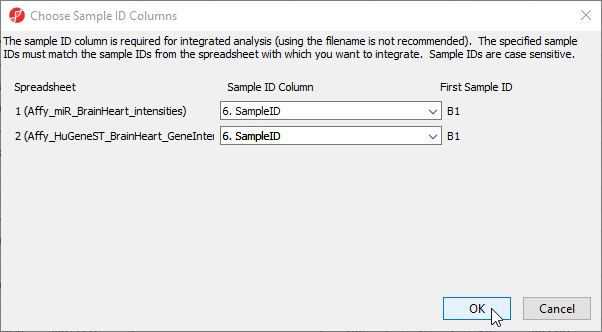
- Select 6. SampleID for Affy_miR_BrainHeart_intensities
- Select 6. SampleID for Affy_HuGeneST_BrainHeart_GeneIntensities
- Select OK (Figure 11)
| Numbered figure captions | ||||
|---|---|---|---|---|
| ||||
|
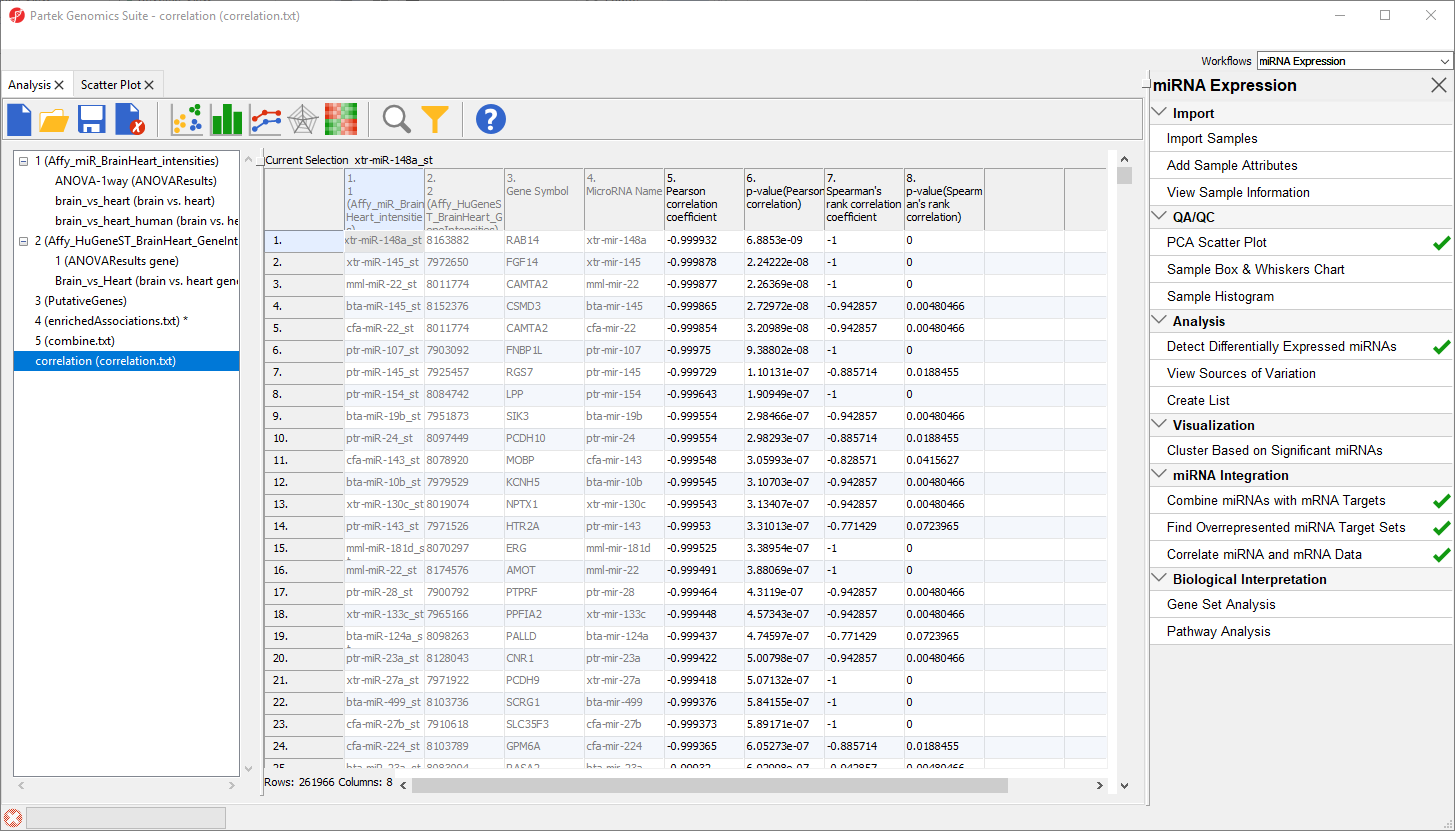
The new spreadsheet, correlation.txt (Figure 12). Each row contains one miRNA correlated with one of its target gnees. The first column contains the miRNA probeset ID from the miRNA intensities spreadsheet. The second column contains the mRNA probeset ID from the gene expression intensities spreadsheet. The third column lists the gene symbol and the fourth the miRNA name. The fifth and sixth columns are the Pearson correlation coefficient and its p-value for the gene-miRNA pair. The seventh and eigth columns are the Spearman's rank correlation coefficient and its p-value for the gene-miRNA pair. Negative correlation indicates that a high level of the miRNA is correlated with a low expression level in its target gene. Positive correlation indicates that a high level of the miRNA is associated with a high level of its target gene.
| Numbered figure captions | ||||
|---|---|---|---|---|
| ||||
|
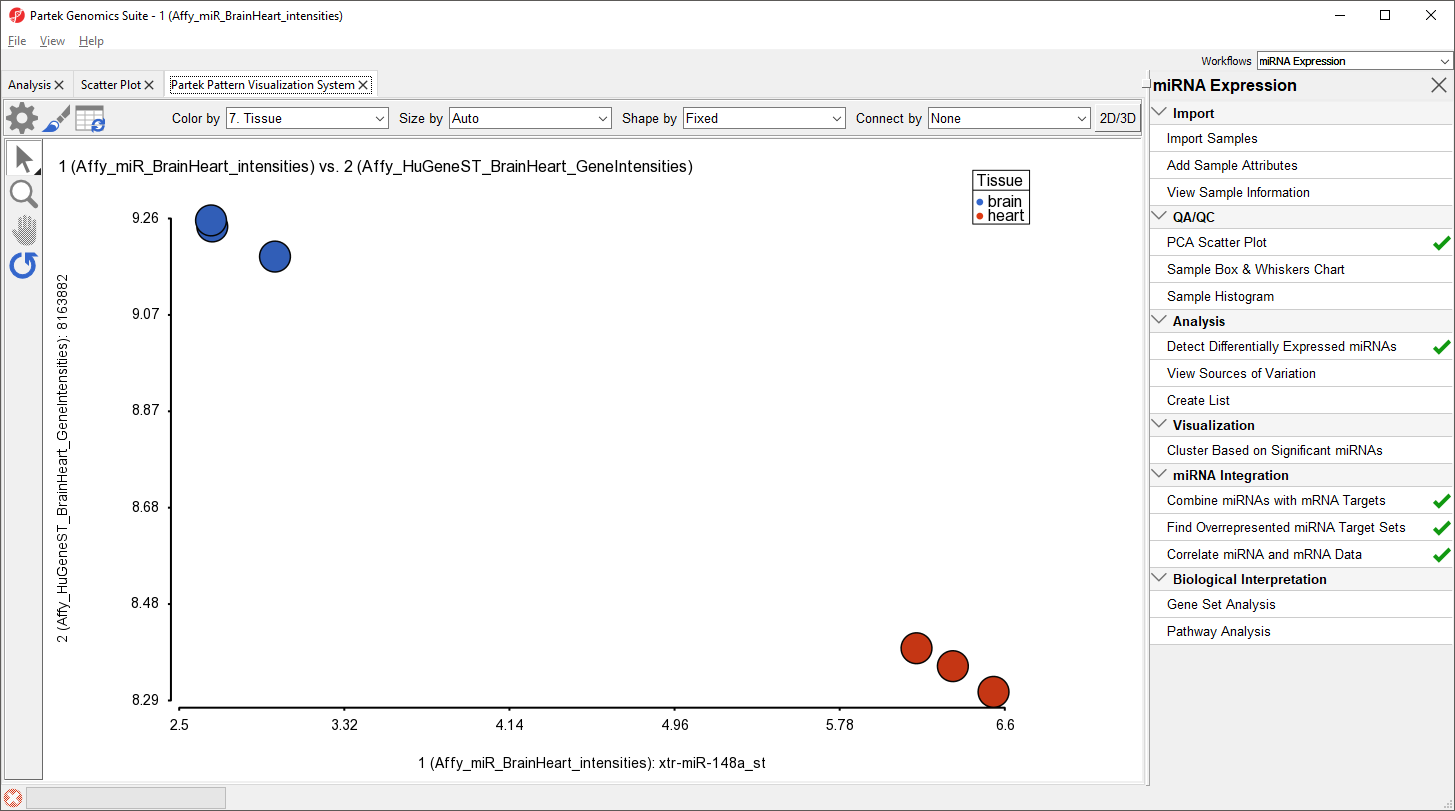
We can visualize the correlation between any miRNA and target gene.
- Right-click a row header
- Select Scatter Plot (Orig. Data) from teh pop-up menu
The correlation plot shows miRNA intensitiy on the x-axis and gene expression on the y-axis (Figure 13). Here, we see a negative correlation between expression of xtr-miR-148a_st and its target gene, RAB14, in brain and heart tissues.
| Numbered figure captions | ||||
|---|---|---|---|---|
| ||||
|
Please note that the correlation function is only useful for identifying miRNAs that affect mRNA stability, not translation.
| Additional assistance |
|---|
|
| Rate Macro | ||
|---|---|---|
|
Overview
Content Tools