In this section, you will learn how to find genomic features (genes) that are near the IP-enriched regions of the data. You will also learn how to classify the peak locations by gene section (5’ UTR, 3’ UTR, Promoter, exon, intron).
Finding the nearest genomic features
- Select p-value_filtered from the spreadsheet tree
- Select Find Nearest Genomic Feature from the Peak Analysis section of the ChIP-Seq workflow
The Output Overlapping Features dialog will open (Figure 1).
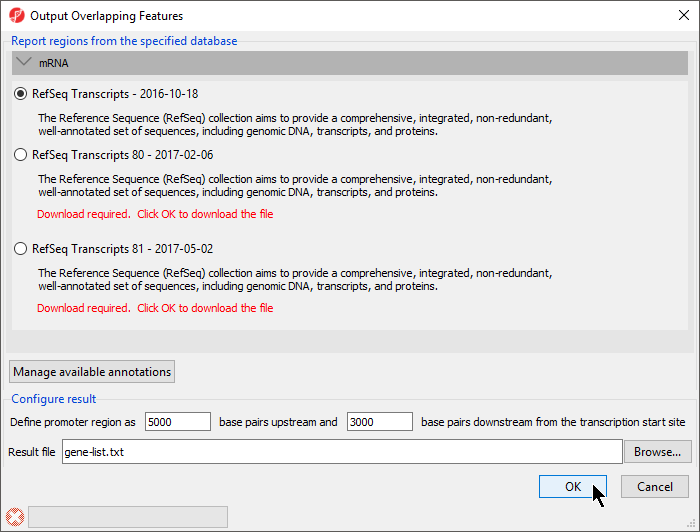
Figure 1. Selecting a database for overlapping features
With this dialog, you can specify the reference database.
- Select RefSeq Transcripts 81 - 2017-08-02 or your preferred annotation database
The promoter region can also be defined. The default settings are appropriate in this case.
- Select OK
The resulting spreadsheet, gene-list, is a child of the p-value_filtered spreadsheet (Figure 2). Each row represents a transcript.
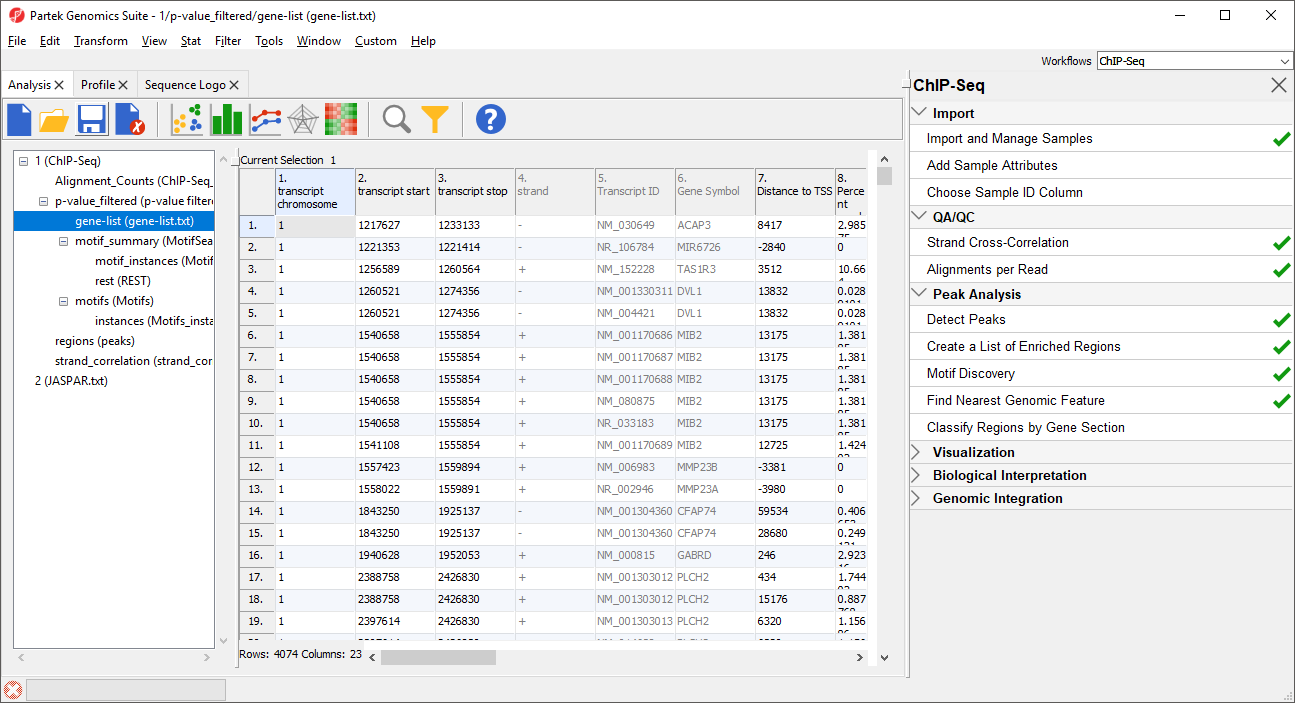
Figure 2. Viewing genes overlapped by regions
Column 1. transcript chromosome gives the chromosome location of transcript
Column 2. transcript start gives the start of transcript (inclusive)
Column 3. transcript stop gives the end of transcript (exclusive)
Column 4. strand gives the strand of the transcript
Column 5. Transcript ID gives the identify of the transcript
Column 6. Gene Symbol gives the identity of the gene
Column 7. Distance to TSS gives the distance of each enriched region to the transcription start site in base pairs with positive indicating downstream and negative indicating upstream
Column 8. Percent overlap with gene gives the percent of the gene that overlaps with the region
Column 9. Percent overlap with region gives the percent of the region that overlaps with the gene
Column 10.-23. These columns are detailed in Detecting peaks and enriched regions in ChIP-Seq data
Percent overlap with gene is more likely to close to 1 in cases where one region covers several genes, in histone studies, for example. Percent overlap with region is likely to be close to 1 in cases where a region is relatively small and is found completely within a gene, in transcription factor binding studies, for example. If both columns are close to 1, then the gene and the region have nearly the same start and stop sites. If both columns are close to 0, then the region does not overlap with the gene directly and likely covers only the promoter region.
Classifying regions by gene section
Another way to interpret the genomic location of peaks is to use Classify regions by gene selection.
- Select p-value_filtered from the spreadsheet tree
- Select Classify regions by gene selection from the Peak Analysis section of the ChIP-Seq workflow
The Output Overlapping Features dialog will open.
- Select RefSeq Transcripts 81 - 2017-08-02 or your preferred annotation database
The promoter region can also be defined. The default settings are appropriate in this case. The results can be further configured to give one result per detected region or one result per genomic feature. The default setting, one result per detected region, is appropriate in this case.
- Select OK
A new spreadsheet, gene-classification will be generated (Figure 3).
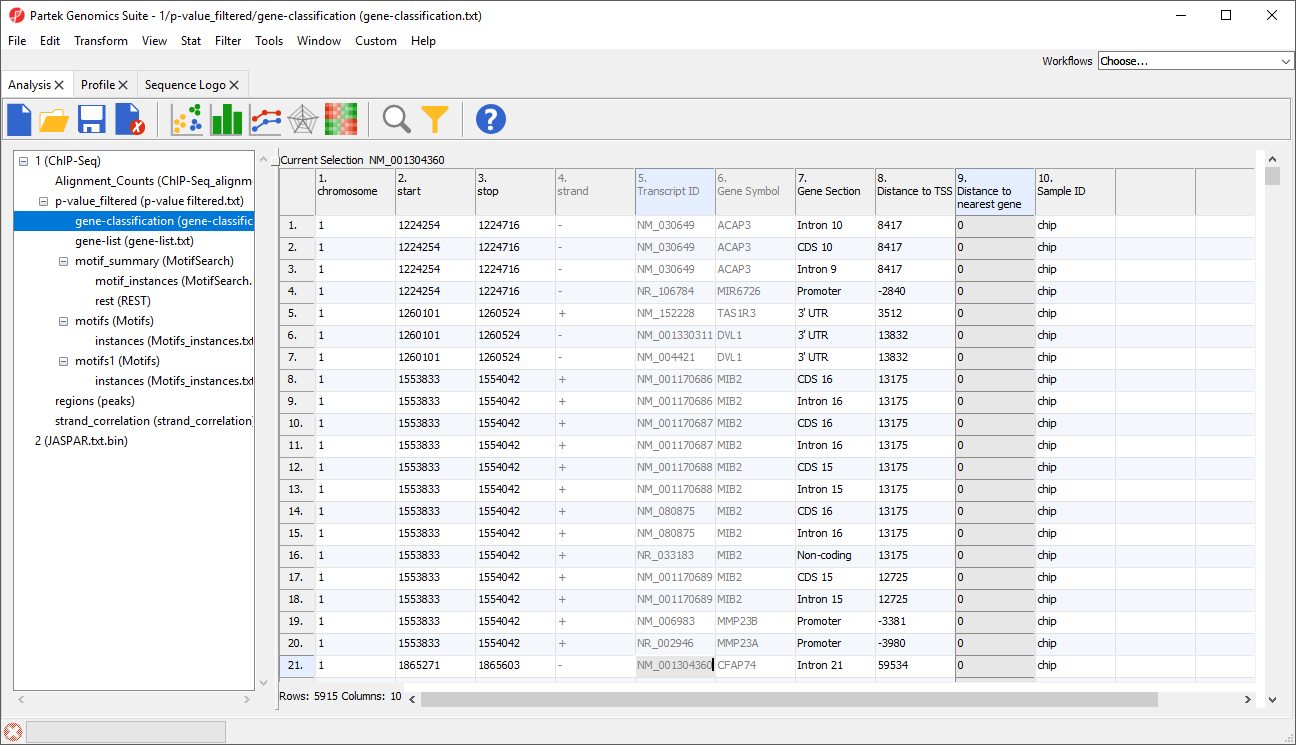
Figure 3. Classifying regions by gene section
Columns 1-6 have the same contents we saw in gene-list.
Column 7. Gene Section gives the section of the gene that overlaps with the region
Column 8. Distance to TSS gives the distance of each enriched region to the transcription start site in base pairs with positive indicates downstream and negative indicating upstream
Column 9. Distance to nearest gene gives the distance of each enriched region to the nearest gene in base pairs with positive indicating downstream and negative indicating upstream
Column 10. Sample ID gives the sample in which the region is enriched
Additional Assistance
If you need additional assistance, please visit our support page to submit a help ticket or find phone numbers for regional support.


| Your Rating: |
|
Results: |

|
36 | rates |
Overview
Content Tools