With a list of amplified or deleted regions in our cohort in hand, one of the more interesting questions to ask is what genes have recurrent amplifications or deletions in the data set. To address this question, we can use the Find overlapping genes function to either add a column to our region list with the genes present in each region or create a new list of genes that overlap the regions.
Here, we will create a new spreadsheet with genes that overlap the regions in the amplified_or_deleted spreadsheet.
- Select the amplified_or_deleted spreadsheet in the spreadsheet tree
- Select Find Overlapping Genes from the Copy Number Analysis section of the workflow
- Select Create a New Spreadsheet with Genes that Overlap the Regions from the Find Overlapping Genes dialog (Figure 1)
- Select OK
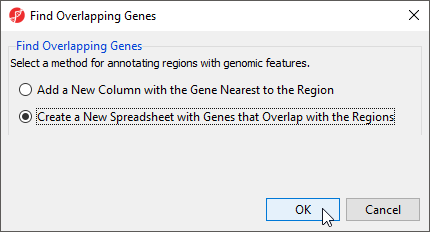
Figure 1. Options in Find Overlapping Genes dialog
To determine what regions in the genome correspond to genes, we need to select an annotation database (Figure 2).
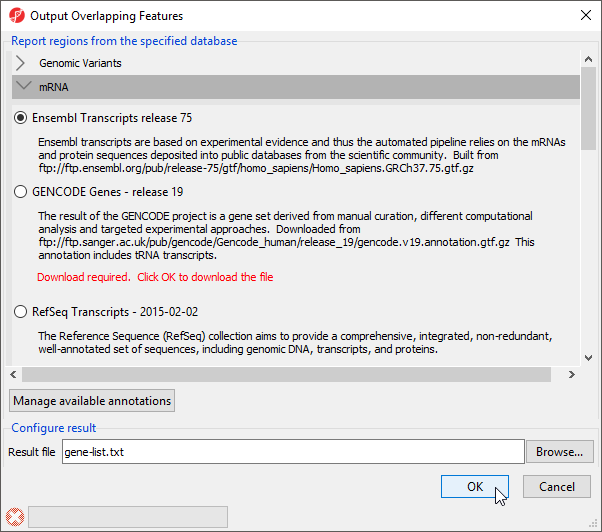 Figure 2. Viewing the Output Overlapping Features dialog. Database files not present on the computer display Download required in red
Partek Genomics Suite offers a variety of possibilities including RefSeq, Ensembl, and GENCODE; however, custom annotations can also be used. If the database file has not been downloaded, Download required. Click OK to download the file, will be listed in red beneath the annotation. Selecting OK will automatically download the file and then run the task.
Figure 2. Viewing the Output Overlapping Features dialog. Database files not present on the computer display Download required in red
Partek Genomics Suite offers a variety of possibilities including RefSeq, Ensembl, and GENCODE; however, custom annotations can also be used. If the database file has not been downloaded, Download required. Click OK to download the file, will be listed in red beneath the annotation. Selecting OK will automatically download the file and then run the task.
- Select Ensembl Transcripts release 75
- Select OK
A new spreadsheet, gene-list, is created as a child spreadsheet of amplified_or_deleted (Figure 3).
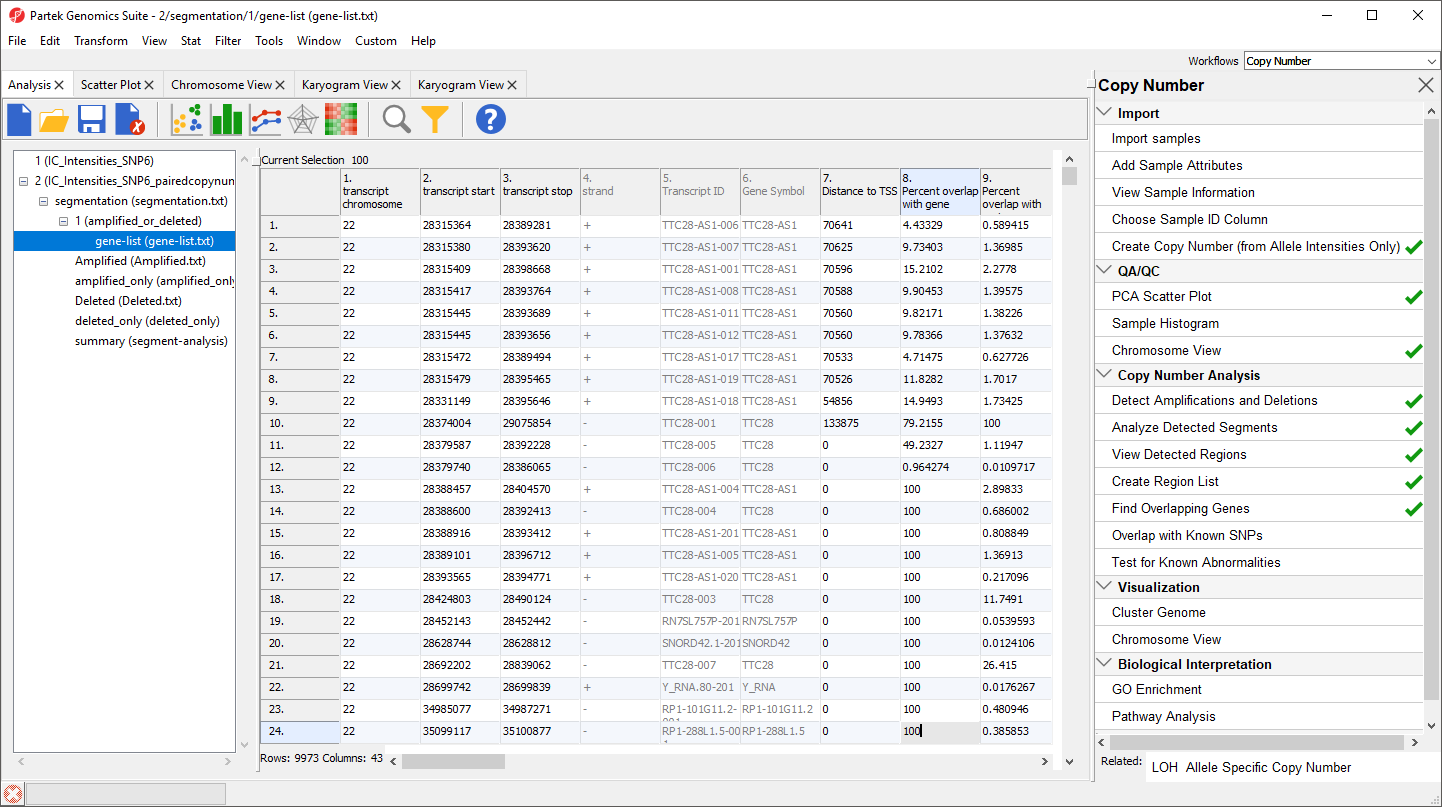
Figure 3. Viewing the gene-list spreadsheet, a result of overlapping genes with regions of copy number changes. Each row of the table represents one Ensembl transcript
Each row corresponds to a transcript and the columns are as follows:
1. Genomic coordinates of the transcript
4. Coding strand
5. Transcript ID
6. Gene Symbol
7. Minimum distance of the region to the transcription start site with positive values indicating downstream and negative values indicating upstream
8. Percent overlap with gene indicates how much of the transcript sequence overlaps the region
9. Percent overlap with region indicates how much of the region is overlapped by the transcript
10. + Correspond to the columns 1+ in the segment-analysis spreadsheet
This gene-list spreadsheet is gene-centric and enables genomic integration. For example, GO and Pathway enrichment can be directly invoked on the gene-list spreadsheet to detect functional groups affected by copy number changes. While not detailed in this tutorial, please feel free to explore these options on your own. For rmore information on enrichment analysis, you can consult the Gene Ontology Enrichment tutorial.
Additional Assistance
If you need additional assistance, please visit our support page to submit a help ticket or find phone numbers for regional support.


| Your Rating: |
|
Results: |

|
34 | rates |
Overview
Content Tools